The Apocalyptionists will be upset! Not only did DTCC close out Lehman’s CDS book without loss:
it successfully closed out over $500 billion in market participants’ exposure from the Lehman Brothers, Inc. (Lehman) bankruptcy which occurred the week of Sept. 22. This was the largest close-out in DTCC’s history. DTCC reports it does not expect there to be any impact to its retained earnings or to market participants’ clearing fund deposits as a result of closing out these pending trade obligations.
“The liquidation of Lehman was complex, involved multiple asset classes, and required a methodical approach to mitigate potential losses from outstanding trading obligations,” said Donald F. Donahue, DTCC chairman and CEO. “Without question, our ability to manage risk and see exposure from a central vantage point was instrumental in helping us ensure that market risk – and systemic risk – was avoided.
… but settlement of CDS obligations on Lehman itself proceeded seamlessly …
On Oct. 21, DTCC also completed, without incident, the automated credit event processing of Lehman Brothers Holdings Inc. (LBHI) involving $72 billion of credit default swaps. DTCC calculated and bilaterally netted all amounts due on credit default swaps written on LBHI. This resulted in approximately US$5.2 billion owed from net sellers of protection on LBHI to net buyers of protection. The portion of this net funds settlement allocable to trades between major dealers was handled through the normal settlement procedures of CLS Bank International, DTCC’s settlement partner for the Warehouse and the world’s central settlement bank for foreign exchange.
DTCC also announced:
it will begin to publish aggregate market data from its Trade Information Warehouse (Warehouse), the worldwide central trade registry it maintains on credit derivatives. Starting Tuesday, November 4 and continuing weekly, DTCC will post on its website www.dtcc.com/derivserv the outstanding gross and net notional values (“stock” values) of credit default swap (CDS) contracts registered in the Warehouse for the top 1,000 underlying single-name reference entities and all indices, as well as certain aggregates of this data on a gross notional basis only. The data is intended to address market concerns about transparency.
According to their 2007 Annual Report:
While the total outstanding of credit default swaps (CDS) has grown to $45.5 trillion in 2007 from $3.7 trillion in 2003, our Deriv/SERV platform has been credited with significantly reducing the risk previously associated with unconfirmed trades. Today, over 90% of CDS trades are matched and confirmed through Deriv/SERV, compared with 15% late in 2003.
I have added the warehouse information address to the links, under “US Fixed Income Data”.
The Treasury guarantee of bank debt – reported on October 27 as seeming cheap – is mired in confusion:
Almost three weeks after the government threw its guarantee behind new bank bonds, no U.S. finance company has braved the market.
While Citigroup Inc., JPMorgan Chase & Co. and Bank of America Corp. were the three largest U.S. banks issuing debt last year, they haven’t sold dollar-denominated corporate bonds since August.
…
Banks are hamstrung because they’re waiting for the “fine print,” said Ira Jersey, an interest-rate strategist at Credit Suisse Group AG in New York. Because they don’t know if the debt will be guaranteed under all circumstances, bonds are difficult to price, he said.
Mind you, the Commercial Paper programme – that is busily grossing up the Fed’s balance sheet – is working great!
Interest rates on U.S. commercial paper fell to about the lowest in four years after the Federal Reserve said it absorbed more than 9 percent of the market.
Interest rates on the highest-ranked 30-day commercial paper dropped 39 basis points to 2.02 percent, about the lowest in four years, according to yields offered by companies and compiled by Bloomberg. Yields on overnight and seven-day paper fell to the lowest levels in at least 13 years, Bloomberg data show.
Naked Capitalism reprints a Financial Times article regarding the effect of changes in bankruptcy law on the recent investment bank collapses:
The 2005 changes made clear that certain derivatives and financial transactions were exempt from provisions in the bankruptcy code that freeze a failed company’s assets until a court decides how to apportion them among creditors.
…
Lawyers said under the old rules, creditors of companies facing financial difficulties were wary of settling trades or seeking extra collateral because they knew such demands could precipitate a bankruptcy filing and potentially freeze their claims.However, when the financial health of Bear, Lehman and AIG took a sharp turn for the worse this year, their trading counterparties – mainly hedge funds and other banks – were not deterred from seeking to settle their trades or forcing the three companies to put up more collateral.
Such pressure exacerbated the liquidity squeeze that ultimately forced the three companies to hoist the white flag. Bear was sold to JPMorgan in a cut-price deal in March, while Lehman filed for bankruptcy last month and AIG was rescued by a $120bn government loan.
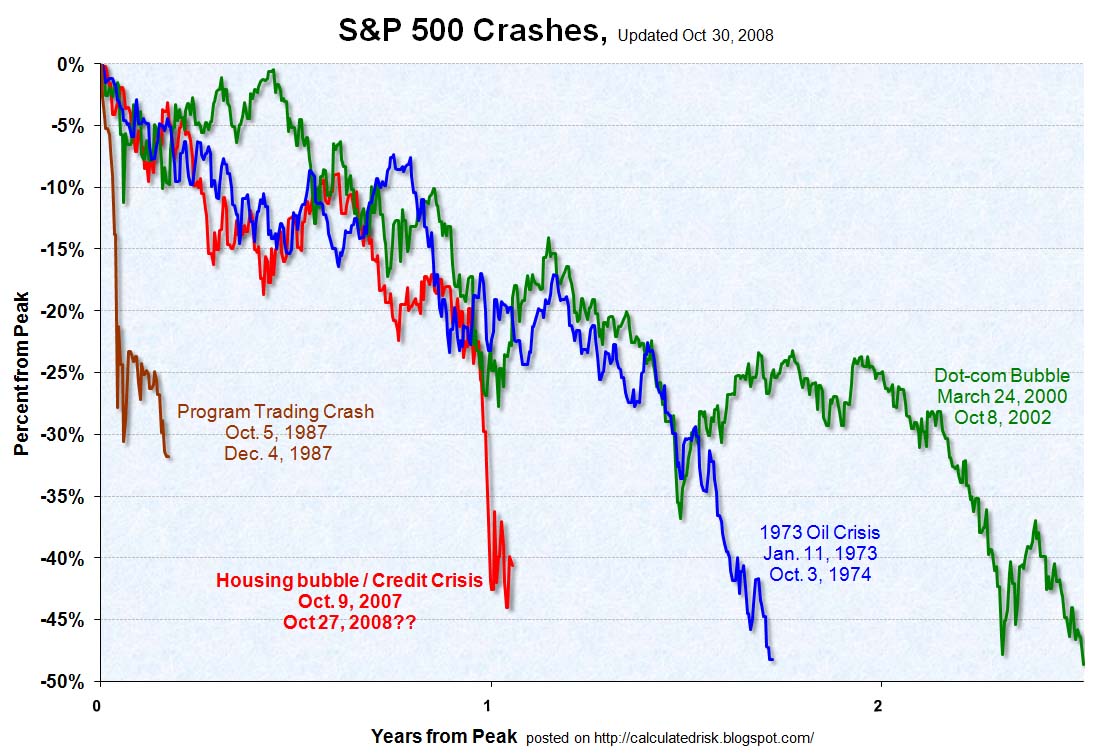
Calculated Risk provides a thoroughly fascinating graph (via Dealbreaker and Abnormal Returns) [click for big]:
And, just to make Hallowe’en a little scarier, the FDIC closed down another bank:
As of October 17, 2008, Freedom Bank had total assets of $287 million and total deposits of $254 million. Fifth Third agreed to assume all the deposits for a premium of 1.16 percent. In addition to assuming the failed bank’s deposits, Fifth Third will purchase approximately $36 million of assets. The FDIC will retain the remaining assets for later disposition.
…
The FDIC estimates that the cost to the Deposit Insurance Fund will be between $80 million and $104 million. Fifth Third’s acquisition of all deposits was the “least costly” resolution for the FDIC’s Deposit Insurance Fund compared to alternatives. The last failure in Florida was First Priority Bank, Bradenton, which was closed on August 1, 2008. Freedom Bank is the seventeenth FDIC-insured institution to be closed this year.
A small bank, but look at the proportions! They had $287-million in assets, and Fifth Third is buying $36-million of them. That leaves the FDIC with $251-million and they’re expecting a loss of between $80-million and $100-million. Now that’s a whacking!
And that’s the end of another month – and it was a pretty horrible one for prefs, believe me! I’ll be doing all the usual posts shortly, but a brief examination is sufficient to conclude that CPD lost 7.21% on the month … a huge number for such a thoroughly diversified fund. MAPF, on the other hand, traded like gangbusters – an absolutely massive trading month – and, while still having lost money, will have out-performed CPD substantially.
The key to portfolio management is to arrange your portfolio into various asset classes that will meet your long terms goals without subjecting the portfolio as a whole to extreme short term risk. Then – and this is where I come in – you attempt to outperform within each asset class.
What a day on the market! Hefty volume, some very chunky crosses and a sharp move upwards! If only there had been more days like that this month!
PerpetualDiscounts were up 1.6586% to yield 6.90% (pre-tax price-weighted mean YTW). At the standard 1.4x equivalency factor, this is equivalent to 9.66% interest; long corporates ar at 7.5%, so the pre-tax interest-equivalent spread is 216bp … starting to narrow, but the bonds are wide!
| Note that these indices are experimental; the absolute and relative daily values are expected to change in the final version. In this version, index values are based at 1,000.0 on 2006-6-30. The Fixed-Reset index was added effective 2008-9-5 at that day’s closing value of 1,119.4 for the Fixed-Floater index. |
|||||||
| Index | Mean Current Yield (at bid) | Mean YTW | Mean Average Trading Value | Mean Mod Dur (YTW) | Issues | Day’s Perf. | Index Value |
| Ratchet | N/A | N/A | N/A | N/A | 0 | N/A | N/A |
| Fixed-Floater | 5.48% | 5.58% | 71,924 | 14.88 | 6 | +0.5903% | 954.3 |
| Floater | 6.77% | 6.87% | 47,375 | 12.68 | 2 | +4.9676% | 511.4 |
| Op. Retract | 5.32% | 6.26% | 138,218 | 4.04 | 14 | -0.0610% | 994.5 |
| Split-Share | 6.31% | 10.59% | 58,596 | 3.95 | 12 | +1.5057% | 932.8 |
| Interest Bearing | 7.84% | 13.20% | 62,801 | 3.31 | 3 | +1.0131% | 903.1 |
| Perpetual-Premium | 7.26% | 7.38% | 55,115 | 12.05 | 1 | -2.2273% | 854.4 |
| Perpetual-Discount | 6.83% | 6.90% | 181,966 | 12.72 | 70 | +1.6586% | 796.4 |
| Fixed-Reset | 5.38% | 5.09% | 744,899 | 15.18 | 10 | -0.3484% | 1,071.9 |
| Major Price Changes | |||
| Issue | Index | Change | Notes |
| TD.PR.Y | FixedReset | -5.1667% | |
| RY.PR.H | PerpetualDiscount | -3.4576% | Now with a pre-tax bid-YTW of 6.59% based on a bid of 21.50 and a limitMaturity. Closing quote 21.50-70, 26×7. Day’s range 21.70-22.85. |
| RY.PR.G | PerpetualDiscount | +3.0000% | Now with a pre-tax bid-YTW of 6.45% based on a bid of 17.51 and a limitMaturity. Closing Quote 17.51-74, 1×9. Day’s range of 16.91-54. |
| GWO.PR.G | PerpetualDiscount | +3.0685% | Now with a pre-tax bid-YTW of 7.02% based on a bid of 18.81 and a limitMaturity. Closing Quote 18.81-99, 1×8. Day’s range of 18.39-99. |
| PWF.PR.G | PerpetualDiscount | +3.0928% | Now with a pre-tax bid-YTW of 6.45% based on a bid of 23.00 and a limitMaturity. Closing Quote 23.00-50, 3×2. Day’s range of 22.30-23.49. |
| BMO.PR.J | PerpetualDiscount | +3.1153% | Now with a pre-tax bid-YTW of 6.82% based on a bid of 16.55 and a limitMaturity. Closing Quote 16.55-73, 25×18. Day’s range of 16.30-74. |
| LFE.PR.A | SplitShare | +3.2917% | Asset coverage of 1.8+:1 as of October 15 according to the company. Now with a pre-tax bid-YTW of 7.92% based on a bid of 9.10 and a hardMaturity 2012-12-1 at 10.00. Closing quote of 9.10-79, 14×4. Day’s range of 8.80-10. |
| PWF.PR.E | PerpetualDiscount | +3.4306% | Now with a pre-tax bid-YTW of 6.86% based on a bid of 20.20 and a limitMaturity. Closing Quote 20.20-50, 2×1. Day’s range of 19.50-20.50. |
| CM.PR.G | PerpetualDiscount | +3.5039% | Now with a pre-tax bid-YTW of 7.32% based on a bid of 18.61 and a limitMaturity. Closing Quote 18.61-73, 3×9. Day’s range of 17.96-40. |
| FIG.PR.A | InterestBearing | +3.5806% | Asset coverage of 1.3+:1 based on Capital Unit NAV of 4.88 and 0.71 Capital Units per Preferred. Now with a pre-tax bid-YTW of 10.75% based on a bid of 8.10 and a hardMaturity 2014-12-31 at 10.00. Closing quote of 8.10-23, 1×2. Day’s range of 8.23-24. |
| ENB.PR.A | PerpetualDiscount | +3.6364% | Now with a pre-tax bid-YTW of 6.13% based on a bid of 22.80 and a limitMaturity. Closing Quote 22.80-22, 1X5. Day’s range of 22.24-00. |
| BAM.PR.H | OpRet | +3.8095% | Now with a pre-tax bid-YTW of 10.57% based on a bid of 21.80 and a softMaturity 2012-3-30 at 25.00. Compare with BAM.PR.I (10.86% to 2013-12-30), BAM.PR.J (9.58% to 2018-3-30) and BAM.PR.O (10.75% to 2013-6-30). Closing quote of 21.80-00, 6×5. Day’s range of 21.00-50. |
| RY.PR.D | PerpetualDiscount | +4.0428% | Now with a pre-tax bid-YTW of 6.45% based on a bid of 17.50 and a limitMaturity. Closing Quote 17.50-74, 7×5. Day’s range of 17.00-51. |
| BCE.PR.C | FixFloat | +4.3929% | |
| RY.PR.E | PerpetualDiscount | +4.4118% | Now with a pre-tax bid-YTW of 6.36% based on a bid of 17.75 and a limitMaturity. Closing Quote 17.75-92, 2×9. Day’s range of 16.91-90. |
| SLF.PR.C | PerpetualDiscount | +5.6063% | Now with a pre-tax bid-YTW of 6.97% based on a bid of 16.20 and a limitMaturity. Closing Quote 16.20-39, 5×7. Day’s range of 15.50-38. |
| PWF.PR.F | PerpetualDiscount | +6.2599% | Now with a pre-tax bid-YTW of 6.55% based on a bid of 16.20 and a limitMaturity. Closing Quote 20.20-99, 5×9. Day’s range of 19.50-90. |
| BNA.PR.A | SplitShare | +8.0000% | Asset coverage of just under 2.8:1 as of September 30 according to the company. Coverage now of 2.0+:1 based on BAM.A at 21.10 and 2.4 BAM.A held per preferred. Now with a pre-tax bid-YTW of 15.42% based on a bid of 21.60 and a hardMaturity 2010-9-30 at 25.00. Compare with BNA.PR.B (10.94% to 2016-3-25) and BNA.PR.C (13.77% to 2019-1-10). Closing quote 21.60-22.89. Day’s range 20.10-00. |
| BAM.PR.B | Floater | +9.1510% | |
| POW.PR.B | PerpetualDiscount | +10.5263% | Now with a pre-tax bid-YTW of 6.57% based on a bid of 20.58 and a limitMaturity. Closing Quote 20.58-91, 1×1. Day’s range of 18.55-20.95 (!). |
| Volume Highlights | |||
| Issue | Index | Volume | Notes |
| WN.PR.A | Scraps (would be PerpetualDiscount but there are credit concerns) | 390,142 | TD crossed 23,700 at 17.75, then Scotia crossed 350,800 at 17.89. Now with a pre-tax bid-YTW of 8.39% based on a bid of 17.66 and a limitMaturity |
| SLF.PR.B | PerpetualDiscount | 375,500 | Nesbitt crossed 262,500 at 16.50, anonymous bought 12,400 from Nesbitt at 16.70, then Nesbitt crossed 75,000 at 16.50. Now with a pre-tax bid-YTW of 7.17% based on a bid of 17.00 and a limitMaturity |
| YPG.PR.B | Scraps (Would be OpRet but there are credit concerns) | 375,423 | Scotia crossed 359,200 at 13.64. Now with a pre-tax bid-YTW of 14.16% based on a bid of 14.00 and a softMaturity 2017-6-29 at 25.00. |
| CL.PR.B | PerpetualPremium (until midnight!) | 193,220 | Scotia crossed 176,200 at 21.98. Now with a pre-tax bid-YTW of 7.38% based on a bid of 21.51 and a limitMaturity. |
| PWF.PR.G | PerpetualDiscount | 192,500 | Scotia crossed 189,100 at 23.49. Now with a pre-tax bid-YTW of 6.45% based on a bid of 23.00 and a limitMaturity. |
| W.PR.J | PerpetualDiscount | 175,167 | Scotia crossed 162,300 at 17.24. Now with a pre-tax bid-YTW of 8.30% based on a bid of 17.10 and a limitMaturity. |
| TD.PR.R | PerpetualDiscount | 168,455 | Scotia crossed 158,500 at 21.99. Now with a pre-tax bid-YTW of 6.44% based on a bid of 21.90 and a limitMaturity. |
| BAM.PR.N | PerpetualDiscount | 164,013 | Scotia crossed 133,700 at 12.94. Now with a pre-tax bid-YTW of 9.50% based on a bid of 12.75 and a limitMaturity. |
| IAG.PR.A | PerpetualDiscount | 146,300 | Scotia crossed 145,200 at 16.73. Now with a pre-tax bid-YTW of 7.07% based on a bid of 16.51 and a limitMaturity. |
| BPP.PR.M | Scraps (Would be Floater but there are credit concerns) | 137,399 | Trades by appointment … but today somebody made an appointment! Scotia crossed 137,300 at 16.99. |
| EPP.PR.A | Scraps (would be PerpetualDiscount but there are credit concerns) | 127,641 | Scotia crossed 123,000 at 14.99. Now with a pre-tax bid-YTW of 8.42% based on a bid of 14.66 and a limitMaturity. |
| POW.PR.C | PerpetualDiscount | 126,300 | Scotia crossed 124,700 at 20.48. Now with a pre-tax bid-YTW of 7.17% based on a bid of 20.48 and a limitMaturity. |
| DC.PR.A | Scraps (would be OpRet but there are credit concerns) | 124,425 | Scotia crossed 123,100 at 14.98. Now with a pre-tax bid-YTW of 15.05% based on a bid of 14.01 and a softMaturity 2016-6-29 at 25.00. |
| BAM.PR.K | Floater | 117,550 | Scotia crossed 116,800 at 11.88. |
| GWO.PR.H | PerpetualDiscount | 117,535 | Scotia crossed 95,100 at 17.68. Now with a pre-tax bid-YTW of 7.24% based on a bid of 17.01 and a limitMaturity. |
| CM.PR.E | PerpetualDiscount | 104,725 | Scotia crossed 100,700 at 19.68. Now with a pre-tax bid-YTW of 7.28% based on a bid of 19.41 and a limitMaturity. |
| DW.PR.A | Scraps (would be OpRet but there are credit concerns) | 103,360 | Scotia crossed 98,500 at 20.49. Now with a pre-tax bid-YTW of 8.02% based on a bid of 20.26 and a limitMaturity. |
| BAM.PR.B | Floater | 102,306 | Scotia crossed 88,100 at 10.04. |
There were forty-five other index-included $25-pv-equivalent issues trading over 10,000 shares today.
I note that BSD.PR.A closed at $5.81 and BSD.UN at 1.00 for a combined market value of $6.81. Since income trusts had a strong monthly close, I estimate NAV at $10.83 (not yet posted on Brookfield’s site), so we have a whopping 37% discount — and you are free to calculate BSD YTM with $10 at exit (for now).
Only 17 cents of time premium on the BSD.UN call options is quite low.
Now if only retraction privilige were active….
I have two questions for you:
i) Where do you find out that, for instance, Scotia crossed 116,800 shares of BAM.PR.K at 11.88?
ii) Can this only be done by a full service broker? Is this only open to large institutions? Is therea minimum number of shares which must be involved? Is it expensive?
Thks
so we have a whopping 37% discount
Wow! With that kind of discount, buying matched units becomes an interesting speculation.
Where do you find out that, for instance, Scotia crossed…
There’s a link on the right-hand panel, under “News”, to Financial Post Block Trades, which reports the daily block trading on the Toronto Exchange.
Can this only be done by a full service broker?
Any broker that can trade on the Toronto Exchange can cross an order.
Is this only open to large institutions?
In theory, no. I do not believe there are any rules about crossing 100 shares. In practice, yes.
I wrote a post about crosses that may be useful to you. The gist is: a cross arises when you have a trade too large to be put up on the TSX and executed 400 shares at a time. So you call your dealer and tell him what you want to do. He then gets on the ‘phone, puts his rolodex to work, and tries to find another one of his clients who is willing to take the other side of your trade. Once he’s got everything arranged, he puts a trade through your account and the other client’s simultaneously and takes a commission (a nickel a share is standard) for his efforts.
Internal crosses, where an investment manager is just shifting shares between accounts under his management and just needs the mechanical assistance of the trader to process the trade, are cheaper.
Thanks James. You fully answered my queries.
[…] is epic. I pointed out the epic nature of this crash on October 31 and now it’s even … um … more […]