Help Wanted: Compliance Officer

October 4th, 2008

In these trying times, it will come as a great relief to many to learn that there will be at least one new hire on Bay Street between now and Christmas (2009). The subject of this post is a little unusual for PrefBlog, but I’m just trying to help out and spread the news of a vacancy. And besides, this is hilarious.

How many of youse guys know what a compliance officer at a registered firm does for a living? According to OSC Rule 31-505:

1.3 Designation of Compliance Officer

(1) A registered dealer or adviser shall designate a registered partner or officer as the compliance officer who is responsible for discharging the obligations of the registered dealer or adviser under Ontario securities law.

(2) The person designated under subsection (1) by a registered dealer or adviser shall also be responsible for opening each new account, supervising trades made for or with each client and supervising advice provided to each client or, if a branch manager is designated under subsection 1.4(1), for supervising the branch manager’s conduct of the activities specified in subsection 1.4(2).

(3) Despite subsections (1) and (2), the designated compliance officer may delegate supervisory functions to an individual who reports to the compliance officer and who meets the proficiency requirements under Rule 31-502 Proficiency Requirements for Registrants for a salesperson in the same category of registration as the dealer or an officer in the same category of registration as the adviser, that has in each case designated the compliance officer.

(4) An applicant for registration or reinstatement of registration as a dealer or adviser shall deliver to the Commission, with the application, written notice of the name of the person proposed to be designated under subsection (1).

The Globe and Mail reports:

He’d soon approach the desk. He’d demand cash, threaten the teller and often say he had a gun – although no weapon was ever seen. Sometimes he was given cash; other times he came out empty-handed. But in each case he ran, and got away.

And so it continued, since 2003, in some 26 suspected robberies carried out by the “exchange bandit.” The most recent happened last month, and this week, the Canadian Bankers Association decided that was enough.

On Thursday, it offered a $10,000 reward for information leading to the arrest and conviction of the thief

On Friday morning, they got a break. A 37-year-old vice-president of a Toronto investment firm walked into a downtown police station, with his lawyer, and turned himself in.

A compliance officer with Paradigm Capital in Toronto’s financial district, Kevin John Pinto’s job was to make sure his company’s deals were all within regulation and above-board. On Friday, Mr. Pinto was charged by Toronto police with 10 bank robberies. More charges from other regions are expected, Constable Tony Vella said.

Friday night, Paradigm Capital confirmed Mr. Pinto had been an employee since January, 2006. Chief executive officer David Roland said the company found out about the allegations Friday afternoon, suspended Mr. Pinto, began contacting all the regulatory bodies which may need to investigate, while striking up an investigation of its own.

Paradigm has 37 registrants. Kevin Pinto was only the Vice President, Compliance; the Chief Compliance Officer is Michael Ward, CA. Mr. Pinto has been suspended.

The Toronto police published a news release about his surrender and arrest. What gets me is:

the latest robbery occurred in Toronto on Friday, September 12, 2008, at Scotiabank, 44 King Street West.

and Paradigm’s address is:

95 Wellington Street West, Suite 2101, P.O. Box 55, Toronto, Ontario, Canada M5J 2N7

What did he do? Walk up during lunch?

Update, 2008-10-08: Via Financial Webring Forum, some colour from the Star.

October 3, 2008

October 3rd, 2008

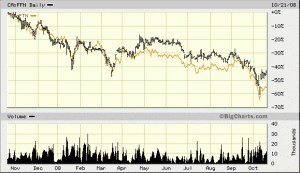
Accrued Interest brings us up to date on US Municipals. He mentioned delevering of closed end funds frantically trying to redeem their Auction Rate Securities … First Trust Advisors redeemed one tranche on Sept. 24, then another tranche Oct. 2 … of the same paper! The symbol (of the “Capital Units”, shall we say) of the fund is FPI and it has not been having a nice time:

FPI invests in tax-advantaged preferreds, but the delevering principal is the same as with municipal funds.

Ten year municipals are trading 50bp over treasuries – before tax effects – which is unusual to say the least. States and cities aren’t doing so well in this market:

Tax-exempt borrowers this week sold less than 15 percent of a typical week’s sales, data compiled by Bloomberg show, and their costs to borrow long term soared to the highest in eight years. Congress passed a $700 billion financial-market rescue plan today designed to unlock credit markets, urged on by California Governor Arnold Schwarzenegger’s warning that his and other states may need emergency loans without it.

States and cities have postponed more than $12 billion in note and bond deals since Lehman Brothers Holdings Inc. declared bankruptcy on Sept. 15, according to data compiled by Bloomberg. California may run out of cash at the end of the month if the state can’t sell billions in short-term debt, Treasurer Bill Lockyer, a Democrat, said Oct. 1.

Assiduous Readers will remember Mr. Lockyer – he’s made many unintentionally hilarious statements about investor behaviour … but should be more careful with what he wishes for.

The Citigroup/Wachovia/Wells Fargo fight promises to be entertaining – who has the most influential regulators?

“The FDIC stands behind its previously announced agreement with Citigroup,” FDIC Chairman Sheila Bair said in a statement today. “The FDIC will be reviewing all proposals and working with the primary regulators of all three institutions to pursue a resolution that serves the public interest.”

Emergency changes allow ideas to be tested in unexpected ways. I remember reading about a professor in the States who had gone so far as to attempt to estimate the effect on climate of jet plane contrails. All very thorough and meticulous, I’m sure, but how could his calculations ever be tested? He got his chance when air traffic over North America was shut down in the wake of 9/11.

And so it is with this moronic short-selling ban. The WSJ publicized some Credit Suisse research and there are a few bits and pieces here and there similarly examining actual data. Basically, the ban has increased volatility and increased transaction costs. This ban will provide grist for academic mills for a long time to come … I may start making a book on when the regulators will come forward and admit ‘We don’t understand the first thing about markets, we panicked and we were wrong’. Should be about maybe next week, eh?

As it happens, they rescinded the ban … its last day will be Wednesday 8th. Surprisingly, the press release makes no mention of staff resignations.

I’ve added material to the post Synthetic Extended Deposit Insurance – the Critique.

CIBC has entered into a risk-sharing agreement with Cerberus:

Canadian Imperial Bank of Commerce, which has taken more writedowns than any Canadian lender during the financial crisis, said Cerberus Capital Management LP will invest $1.05 billion in its U.S. real estate portfolio, helping the bank reduce risk.

The real estate portfolio has a notional value of about $6.3 billion and consists of mortgage-backed securities and collateralized debt obligations. The assets have been written down “by a material amount,” Lalonde said, with a fair value of $1.08 billion at July 31.

“CIBC has given away a portion of what appears to be the economic value of the underlying assets to protect the accounting (i.e. mark-to-market) downside,” National Bank Financial analyst Robert Sedran said in a note to investors.

PerpetualDiscounts off a bit today, marking their ninth consecutive down day. The weighted-mean-average pre-tax bid-YTW is now 6.38%, equivalent to 8.93% at the standard 1.4x equivalency factor. Long Corporates are now at about 6.75, making the pre-tax interest-equivalent spread about 218bp.

Note that these indices are experimental; the absolute and relative daily values are expected to change in the final version. In this version, index values are based at 1,000.0 on 2006-6-30.
The Fixed-Reset index was added effective 2008-9-5 at that day’s closing value of 1,119.4 for the Fixed-Floater index.
Index Mean Current Yield (at bid) Mean YTW Mean Average Trading Value Mean Mod Dur (YTW) Issues Day’s Perf. Index Value
Ratchet N/A N/A N/A N/A 0 N/A N/A
Fixed-Floater 4.84% 4.95% 80,743 15.57 6 -0.7350% 1,062.1
Floater 5.40% 5.44% 48,810 14.79 2 -0.8375% 745.0
Op. Retract 5.10% 5.23% 124,115 3.69 14 -0.2790% 1,025.5
Split-Share 5.84% 8.20% 56,441 4.10 12 +0.3760% 964.2
Interest Bearing 6.44% 7.40% 43,164 3.76 3 +0.9056% 1,071.5
Perpetual-Premium 6.33% 6.37% 55,114 13.36 1 +0.7347% 980.3
Perpetual-Discount 6.31% 6.38% 178,759 13.38 70 -0.0424% 849.6
Fixed-Reset 5.16% 5.05% 1,130,057 15.26 10 -0.3707% 1,100.0
Major Price Changes
Issue Index Change Notes
SBC.PR.A SplitShare -5.1777% Asset coverage of 1.9+:1 as of October 2, according to Brompton Group. Now with a pre-tax bid-YTW of 7.11% based on a bid of 9.34 and a hardMaturity 2012-11-30 at 10.00. Sadly, the capital units are trading at around NAV, making the monthly retraction a chancy thing. Still … the Annual Retraction is at the end of December.
IAG.PR.A PerpetualDiscount -4.6101% Now with a pre-tax bid-YTW of 6.92% based on a bid of 16.76 and a limitMaturity.
LBS.PR.A SplitShare -3.3120% Asset coverage of just under 2.0:1 as of October 2, according to Brompton Group. Now with a pre-tax bid-YTW of 7.52% based on a bid of 9.05 and a hardMaturity 2013-11-29. The capital units are at a premium, making a monthly retraction a speculative proposition, but the annual retraction is at the end of November.
BAM.PR.J OpRet -2.7708% Now with a pre-tax bid-YTW of 9.11% based on a bid of 19.30 and a softMaturity 2018-3-30 at 25.00. Compare with BAM.PR.H (6.73% to 2012-3-30), BAM.PR.I (7.17% to 2013-12-30) and BAM.PR.O (8.97% to 2013-6-30); and with the perpetuals at about 7.80%.
CM.PR.P PerpetualDiscount -2.7638% Now with a pre-tax bid-YTW of 7.13% based on a bid of 19.35 and a limitMaturity.
CM.PR.K FixedReset -2.6369% Now with a pre-tax bid-YTW of 5.43% based on a bid of 24.00 and a limitMaturity.
TD.PR.P PerpetualDiscount -2.5980% Now with a pre-tax bid-YTW of 6.05% based on a bid of 22.12 and a limitMaturity.
BCE.PR.C FixFloat -1.8750%  
CM.PR.E PerpetualDiscount -1.7632% Now with a pre-tax bid-YTW of 7.20% based on a bid of 19.50 and a limitMaturity.
POW.PR.D PerpetualDiscount -1.5633% Now with a pre-tax bid-YTW of 6.89% based on a bid of 18.26 and a limitMaturity.
BCE.PR.G FixFloat -1.4989%  
GWO.PR.G PerpetualDiscount -1.4354% Now with a pre-tax bid-YTW of 6.36% based on a bid of 20.60 and a limitMaturity.
CU.PR.B PerpetualDiscount -1.3682% Now with a pre-tax bid-YTW of 6.19% based on a bid of 24.51 and a limitMaturity.
PWF.PR.H PerpetualDiscount -1.1106% Now with a pre-tax bid-YTW of 6.33% based on a bid of 23.15 and a limitMaturity.
BAM.PR.K Floater -1.0947%  
NA.PR.L PerpetualDiscount -1.0096% Now with a pre-tax bid-YTW of 6.29% based on a bid of 19.61 and a limitMaturity.
BNS.PR.N PerpetualDiscount +1.0054% Now with a pre-tax bid-YTW of 5.81% based on a bid of 22.59 and a limitMaturity.
PWF.PR.L PerpetualDiscount +1.2054% Now with a pre-tax bid-YTW of 6.46% based on a bid of 20.15 and a limitMaturity.
W.PR.J PerpetualDiscount +1.8887% Now with a pre-tax bid-YTW of 6.87% based on a bid of 20.50 and a limitMaturity.
BAM.PR.M PerpetualDiscount +1.9066% Now with a pre-tax bid-YTW of 7.74% based on a bid of 15.50 and a limitMaturity.
ENB.PR.A PerpetualDiscount +1.9523% Now with a pre-tax bid-YTW of 5.92% based on a bid of 23.50 and a limitMaturity.
WFS.PR.A SplitShare +2.1352% Asset coverage of just under 1.6:1 as of September 25, according to Mulvihill. Now with a pre-tax bid-YTW of 11.41% based on a bid of 8.61 and a hardMaturity 2011-6-30. Below $9, some might find even the regular monthly retraction to be attractive.
STW.PR.A InterestBearing +2.1352% Asset coverage of just under 1.7:1 as of September 25, according to Middlefield. Now with a pre-tax bid-YTW of 6.65% (mostly as interest) based on a bid of 9.91 and a hardMaturity 2009-12-31.
FTN.PR.A SplitShare +3.2073% Asset coverage of 2.2+:1 as of September 30 according to the company. Now with a pre-tax bid-YTW of 7.10% based on a bid of 9.01 and a hardMaturity 2014-12-1 at 10.00. The capital unit closed at 10.42, and the Special Annual Concurrent Retraction is this month … so it might be worth checking out this possibility.
ELF.PR.G PerpetualDiscount +3.2787% Now with a pre-tax bid-YTW of 7.59% based on a bid of 15.75 and a limitMaturity.
LFE.PR.A SplitShare +3.913% Asset coverage of 2.2+:1 as of September 15 according to the company. Now with a pre-tax bid-YTW of 6.51% based on a bid of 9.56 and a hardMaturity 2012-12-1 at 10.00
BMO.PR.H PerpetualDiscount +3.9803% Now with a pre-tax bid-YTW of 6.36% based on a bid of 21.16 and a limitMaturity.
BNA.PR.C SplitShare +6.0671% Asset coverage of 3.2+:1 as of August 31 according to the company. Coverage now of 2.5+:1 based on BAM.A at 26.16 and 2.4 BAM.A held per preferred. Now with a pre-tax bid-YTW of 11.21% (!) based on a bid of 14.86 and a hardMaturity 2019-1-10 at 25.00. Compare with BNA.PR.A (9.62% to 2010-9-30) and BNA.PR.B (9.75% to 2016-3-25).
Volume Highlights
Issue Index Volume Notes
NTL.PR.G Scraps (would be Ratchet, but there are credit concerns) 170,875  
MFC.PR.B PerpetualDiscount 169,900 Now with a pre-tax bid-YTW of 6.13% based on a bid of 19.16 and a limitMaturity.
NTL.PR.F Scraps (would be Ratchet but there are credit concerns) 154,557  
GWO.PR.F FixFloat 56,562 Now with a pre-tax bid-YTW of 5.97% based on a bid of 24.86 and a limitMaturity.
BNS.PR.K PerpetualDiscount 34,825 Now with a pre-tax bid-YTW of 5.72% based on a bid of 21.00 and a limitMaturity.
TD.PR.P PerpetualDiscount 23,855 Now with a pre-tax bid-YTW of 6.05% based on a bid of 22.12 and a limitMaturity.
PWF.PR.L PerpetualDiscount 17,325 Now with a pre-tax bid-YTW of 6.46% based on a bid of 20.15 and a limitMaturity.

There were eleven other index-included $25-pv-equivalent issues trading over 10,000 shares today.

October 2, 2008

October 2nd, 2008

Again, very brief commentary. Sorry, folks!

Fed will get hit by mark-to-market accounting rules. Haha! This will fuel political debates for CENTURIES!

The Fed will announce its quarterly estimate of the fair value of Maiden Lane LLC’s $30 billion of holdings that JPMorgan Chase & Co. considered too risky when it acquired Bear Stearns in March, Bank of America analysts Jeffrey Rosenberg and Hans Mikkelsen wrote in a client note. The central bank valued the assets at $29 billion as of June 30, according to the report.

“With the worsening in mortgage markets since last quarter, we estimate a range of $2 billion to $6 billion of unrealized losses,” the New York-based analysts wrote.

Discount window working overtime

Market for short term paper on strike; and some anecdotal colour thereof.

Corporate bond market completely illiquid:

The so-called bid-ask spread on Dallas-based AT&T Inc.’s $600 million of 6.8 percent bonds due in 2036 averaged 121 basis points last week, up from 7 basis points in early 2007, according to data compiled by Bloomberg.

Preferred got smacked today in the backwash from a horrible, horrible, horrible day in equities. A bit more commentary, with an emphasis on the sloppiness of the market at Sloppy, Indeed!

Note that these indices are experimental; the absolute and relative daily values are expected to change in the final version. In this version, index values are based at 1,000.0 on 2006-6-30.
The Fixed-Reset index was added effective 2008-9-5 at that day’s closing value of 1,119.4 for the Fixed-Floater index.
Index Mean Current Yield (at bid) Mean YTW Mean Average Trading Value Mean Mod Dur (YTW) Issues Day’s Perf. Index Value
Ratchet N/A N/A N/A N/A 0 N/A N/A
Fixed-Floater 4.81% 4.91% 81,540 15.64 6 -0.7121% 1,070.0
Floater 5.36% 5.40% 48,056 14.87 2 +0.0646% 751.2
Op. Retract 5.09% 5.15% 125,759 3.71 14 -0.2562% 1,028.4
Split-Share 5.86% 8.21% 56,288 4.08 12 -0.8550% 960.6
Interest Bearing 6.50% 8.15% 43,247 3.79 3 -1.0739% 1,061.9
Perpetual-Premium 6.38% 6.42% 57,006 13.30 1 -2.0000% 973.1
Perpetual-Discount 6.30% 6.37% 180,427 13.37 70 -1.2436% 850.0
Fixed-Reset 5.13% 5.03% 1,159,714 15.26 10 -0.6122% 1,104.0
Major Price Changes
Issue Index Change Notes
ELF.PR.G PerpetualDiscount -5.0436% Now with a pre-tax bid-YTW of 7.83% based on a bid of 15.25 and a limitMaturity.
WFS.PR.A SplitShare -4.4218% Asset coverage of just under 1.6:1 as of September 25, according to Mulvihill. Now with a pre-tax bid-YTW of 12.27% based on a bid of 8.43 and a hardMaturity 2011-6-30. Below $9, some might find even the regular monthly retraction to be attractive.
W.PR.J PerpetualDiscount -4.1905% Now with a pre-tax bid-YTW of 7.00% based on a bid of 20.12 and a limitMaturity.
BMO.PR.H PerpetualDiscount -4.0094% Now with a pre-tax bid-YTW of 6.62% based on a bid of 20.35 and a limitMaturity.
BAM.PR.M PerpetualDiscount -3.6122% Now with a pre-tax bid-YTW of 7.89% based on a bid of 15.21 and a limitMaturity.
POW.PR.D PerpetualDiscount -3.5863% Now with a pre-tax bid-YTW of 6.78% based on a bid of 18.55 and a limitMaturity.
BAM.PR.J OpRet -3.5002% Now with a pre-tax bid-YTW of 8.70% based on a bid of 19.85 and a softMaturity 2018-3-30 at 25.00. Compare with BAM.PR.H (6.73% to 2012-3-30), BAM.PR.I (7.13% to 2013-12-30) and BAM.PR.O (9.08% to 2013-6-30); and with the perpetuals at about 7.85%.
FFN.PR.A SplitShare -2.2581% Asset coverage of just under 1.8:1 as of September 15 according to the company. Now with a pre-tax bid-YTW of 8.03% based on a bid of 8.70 and a hardMaturity 2014-12-1 at 10.00. Sadly, the capital unit is trading at what I suspect is now a premium to NAV [check before you do anything about this!], making the Regular Monthly Retraction a very chancy thing.
PWF.PR.L PerpetualDiscount -3.3964% Now with a pre-tax bid-YTW of 6.54% based on a bid of 19.91 and a limitMaturity.
HSB.PR.C PerpetualDiscount -3.2901% Now with a pre-tax bid-YTW of 6.63% based on a bid of 19.40 and a limitMaturity.
CM.PR.J PerpetualDiscount -2.9922% Now with a pre-tax bid-YTW of 6.96% based on a bid of 16.21 and a limitMaturity.
BAM.PR.N PerpetualDiscount -2.9672% Now with a pre-tax bid-YTW of 7.80% based on a bid of 15.37 and a limitMaturity.
STW.PR.A InterestBearing -2.9146% Asset coverage of just under 1.7:1 as of September 25, according to Middlefield. Now with a pre-tax bid-YTW of 8.83% (mostly as interest) based on a bid of 9.66 and a hardMaturity 2009-12-31. Not bad for one-year money!
CM.PR.I PerpetualDiscount -2.8571% Now with a pre-tax bid-YTW of 6.93% based on a bid of 17.00 and a limitMaturity.
BCE.PR.G FixFloat -2.7083%  
SLF.PR.D PerpetualDiscount -2.6432% Now with a pre-tax bid-YTW of 6.34% based on a bid of 17.68 and a limitMaturity.
HSB.PR.D PerpetualDiscount -2.5641% Now with a pre-tax bid-YTW of 6.64% based on a bid of 19.00 and a limitMaturity.
BMO.PR.J PerpetualDiscount -2.4725% Now with a pre-tax bid-YTW of 6.44% based on a bid of 17.75 and a limitMaturity.
BNA.PR.C SplitShare -2.4373% Asset coverage of 3.2+:1 as of August 31 according to the company. Coverage now of just under 2.7:1 based on BAM.A at 27.69 and 2.4 BAM.A held per preferred. Now with a pre-tax bid-YTW of 12.04% (!) based on a bid of 14.01 and a hardMaturity 2019-1-10 at 25.00. Compare with BNA.PR.A (9.66% to 2010-9-30) and BNA.PR.B (9.37% to 2016-3-25).
IAG.PR.A PerpetualDiscount -2.3889% Now with a pre-tax bid-YTW of 6.60% based on a bid of 17.57 and a limitMaturity.
SLF.PR.A PerpetualDiscount -2.2040% Now with a pre-tax bid-YTW of 6.28% based on a bid of 19.08 and a limitMaturity.
RY.PR.A PerpetualDiscount -2.1196% Now with a pre-tax bid-YTW of 6.28% based on a bid of 18.01 and a limitMaturity.
GWO.PR.G PerpetualDiscount -2.1077% Now with a pre-tax bid-YTW of 6.27% based on a bid of 20.90 and a limitMaturity.
BCE.PR.R FixFloat -2.0833%  
RY.PR.G PerpetualDiscount -2.0288% Now with a pre-tax bid-YTW of 6.23% based on a bid of 18.35 and a limitMaturity.
CM.PR.H PerpetualDiscount -2.0057% Now with a pre-tax bid-YTW of 7.04% based on a bid of 17.10 and a limitMaturity.
CL.PR.B PerpetualPremium (for now!) -2.0000% Now with a pre-tax bid-YTW of 6.42% based on a bid of 24.50 and a limitMaturity. This is the only member of the PerpetualPremium index!
SLF.PR.C PerpetualDiscount -1.9759% Now with a pre-tax bid-YTW of 6.28% based on a bid of 17.86 and a limitMaturity.
TD.PR.O PerpetualDiscount -1.9493% Now with a pre-tax bid-YTW of 6.15% based on a bid of 20.12 and a limitMaturity.
GWO.PR.H PerpetualDiscount -1.9344% Now with a pre-tax bid-YTW of 6.70% based on a bid of 18.25 and a limitMaturity.
SLF.PR.B PerpetualDiscount -1.7722% Now with a pre-tax bid-YTW of 6.24% based on a bid of 19.40 and a limitMaturity.
RY.PR.D PerpetualDiscount -1.7666% Now with a pre-tax bid-YTW of 6.23% based on a bid of 18.35 and a limitMaturity.
PWF.PR.K PerpetualDiscount -1.6890% Now with a pre-tax bid-YTW of 6.38% based on a bid of 19.79 and a limitMaturity.
BCE.PR.I FixFloat -1.6667%  
RY.PR.E PerpetualDiscount -1.6164% Now with a pre-tax bid-YTW of 6.26% based on a bid of 18.26 and a limitMaturity.
LFE.PR.A SplitShare -1.6043% Asset coverage of 2.2+:1 as of September 15 according to the company. Now with a pre-tax bid-YTW of 7.57% based on a bid of 9.20 and a hardMaturity 2012-12-1 at 10.00
DFN.PR.A SplitShare -1.5402% Asset coverage of just under 2.3:1 as of September 15 according to the company. Now with a pre-tax bid-YTW of 7.46% based on a bid of 8.95 and a hardMaturity 2014-12-1 at 10.00. Sadly, the capital units are trading too close – if not over – NAV to make the monthly retraction feature a compelling possibility. But some might wish to keep an eye on it…
CM.PR.G PerpetualDiscount -1.5385% Now with a pre-tax bid-YTW of 7.05% based on a bid of 19.20 and a limitMaturity.
POW.PR.B PerpetualDiscount -1.5377% Now with a pre-tax bid-YTW of 6.78% based on a bid of 19.85 and a limitMaturity.
NA.PR.M PerpetualDiscount -1.4718% Now with a pre-tax bid-YTW of 6.32% based on a bid of 24.10 and a limitMaturity.
RY.PR.H PerpetualDiscount -1.4706% Now with a pre-tax bid-YTW of 6.11% based on a bid of 23.45 and a limitMaturity.
BCE.PR.Z FixFloat -1.4407%  
TD.PR.S FixedReset -1.4022%  
BAM.PR.I OpRet -1.2712% See BAM.PR.J, above.
PWF.PR.H PerpetualDiscount -1.2653% Now with a pre-tax bid-YTW of 6.25% based on a bid of 23.41 and a limitMaturity.
SLF.PR.E PerpetualDiscount -1.2610% Now with a pre-tax bid-YTW of 6.30% based on a bid of 18.01 and a limitMaturity.
BNS.PR.Q FixedReset -1.1670%  
PWF.PR.G PerpetualDiscount -1.0700% Now with a pre-tax bid-YTW of 6.25% based on a bid of 24.04 and a limitMaturity.
MFC.PR.C PerpetualDiscount +1.0182% Now with a pre-tax bid-YTW of 6.03% based on a bid of 18.85 and a limitMaturity.
BAM.PR.H OpRet +1.2078% See BAM.PR.J, above.
ALB.PR.A SplitShare +2.5918% Asset coverage of 1.7+:1 as of September 25 according to Scotia. Now with a pre-tax bid-YTW of 6.74% based on a bid of 23.75 and a hardMaturity 2011-2-28 at 25.00
BCE.PR.C FixFloat +2.8718%  
Volume Highlights
Issue Index Volume Notes
MFC.PR.B PerpetualDiscount 155,250 Desjardins crossed 100,000 at 19.20; CIBC crossed 50,000 at the same price. Now with a pre-tax bid-YTW of 6.13% based on a bid of 19.16 and a limitMaturity.
BNS.PR.L PerpetualDiscount 132,205 Desjardins crossed 100,000 at 19.72; National crossed 25,000 at the same price. Now with a pre-tax bid-YTW of 5.81% based on a bid of 19.72 and a limitMaturity.
BNS.PR.M PerpetualDiscount 124,575 Desjardins crossed 70,000 at 19.72; National crossed 35,000 at the same price. Now with a pre-tax bid-YTW of 5.82% based on a bid of 19.70 and a limitMaturity.
BNS.PR.P FixedReset 73,200 Anonymous bought 36,300 from Scotia at 25.00.
SLF.PR.E PerpetualDiscount 62,450 Desjardins crossed 50,000 at 18.35. Now with a pre-tax bid-YTW of 6.30% based on a bid of 18.01 and a limitMaturity.

There were twenty-one other index-included $25-pv-equivalent issues trading over 10,000 shares today.

Sloppy Indeed!

October 2nd, 2008

It will not have escaped notice that equities got crushed today:

Canadian stocks tumbled the most in almost eight years, led by a record drop in raw-material shares, as tighter credit, rising unemployment and lower home prices threatened to tip the U.S. into a recession.

Potash Corp. of Saskatchewan Inc. fell the most since 1989 after rival Mosaic Co. posted profit that missed analysts’ estimates and cut its sales forecast. Barrick Gold Corp. plunged the most in two decades as bullion declined on speculation the U.S. will approve a $700 billion plan to revive credit markets, reducing the metal’s appeal.

Suncor Energy Inc. touched the lowest in 15 years, leading oil and gas producers lower as crude fell below $95 a barrel and Merrill Lynch & Co. said it may drop to $50. The Standard & Poor’s/TSX Composite Index fell 7 percent to 10,900.54 in Toronto, the most since Oct. 25, 2000.

Preferreds were not immune, although the TXPR’s loss of 1.02% looks a whole better than ‘first-loss’ equities!

But the really illuminating thing about the action is just how SLOPPY this market is. I mean, look … if you want to tell me that the proper yield for preferreds in this environment is X, I’ll listen! For a while, anyway. That sort of speculation is simply market timing and I don’t put much credence in it.

But surely similar securities from the same issuer should trade somewhere around each other! But that’s not the case today … the yield curve has been getting sloppier and sloppier over the past couple of weeks and today … well, I haven’t checked, but it must be some kind of record!

Internal Spreads on
Perpetual Discount Issues
Issuer High Bid Yield Low Bid Yield High/Low
Series ID
BMO 6.62% 6.26% H, L
BNS 5.89% 5.70% N, K
CM 7.07% 6.93% E, I
GWO 6.70% 5.97% H, F
NA 6.39% 6.23% K, L
POW 6.78% 6.38% (B & D), A
PWF 6.54% 6.06% L, E
RY 6.29% 6.11% W, H
SLF 6.34% 6.24% D, B
TD 6.15% 5.84% O, (Q & R)
Issuers included in list if they have at least three issues listed in the “PerpetualDiscount” index

Speaking very generally, there appears to be some positive correlation between Average Daily Trading Value and Yield – that is, the higher the average volume, the higher the yield, which is to say: the liquidity premium is negative … which really shouldn’t happen.

This behavior is consistent with people simply reducing exposure by selling whatever’s easiest to sell, regardless of price.

The weighted mean average pre-tax bid-YTW of the PerpetualDiscount index is now 6.37%, which is about where it was on July 11 (going up) and July 28 (going down). This is equivalent to 8.92% interest at the standard conversion factor of 1.4x. Long corporates now yield about 6.7%, so the PTIE spread is now about 220bp.

SPL.A Downgraded to "D" by DBRS

October 2nd, 2008

DBRS has announced that it:

has today downgraded the Class A Shares issued by Mulvihill Pro-AMS RSP Split Share Corp. (the Company) to D from Pfd-5.

After paying offering expenses and an initial contribution to a Class B Shares forward agreement, the net proceeds from the initial offering were invested in a diversified portfolio of Canadian and U.S. equities (the Managed Portfolio), providing asset coverage of approximately 1.8 times to the Class A Shares. In addition to providing principal protection for the Class A Shares, the Managed Portfolio has been used to make fixed cumulative monthly distributions to the Class A Shares equal to 6.5% per annum and to pay annual fees and expenses. In addition to this, the Company has been making semi-annual contributions of $0.43 per Class A Share from the Managed Portfolio to a forward agreement with the Counterparty for the repayment of the Class A Shares principal on December 31, 2013 (the Termination Date).

On September 3, 2008, the Company announced that distributions to the Class A Shares would be suspended subsequent to the September 2008 distribution payment in order to provide greater certainty to the repayment of principal.

The Managed Portfolio has declined more than 90% since inception. About one-third of the decline has resulted from the semi-annual contributions to the Class A Forward Account. Based on previous contributions to the Class A Forward Account, the Counterparty has guaranteed to repay 89.8% of the Class A Shares principal amount on the Termination Date. The current net asset value (NAV) of the Managed Portfolio is $1.48 (as of September 25, 2008), which is sufficient for the Company to contribute the remaining funds necessary to secure 100% of the principal amount on the Termination Date through the forward agreement. However, there is an additional $3.41 per Class A Share in cumulative dividends still to be paid at maturity. In order for the Company to repay full principal and cumulative dividends on the Termination Date, a return of 23% per year on the Managed Portfolio is required. Once Company expenses are taken into account, the return required to meet all Class A Shares principal and dividend obligations increases to more than 40% per year. Based on the foregoing, DBRS has downgraded the rating of the Class A Shares to D.

SPL.A was last mentioned on PrefBlog when it was downgraded to Pfd-5. SPL.A is tracked by HIMIPref™ and is included in the “Scraps” index – it would be SplitShare … but there are credit concerns!

Index Performance: September 2008

October 2nd, 2008

Performance of the HIMIPref™ Indices for September, 2008, was:

Total Return
Index Performance
September 2008
Three Months
to
September 30, 2008
Ratchet N/A N/A
FixFloat -2.88% +5.09%
Floater -14.79% -14.05%
OpRet -2.01% -1.87%
SplitShare -6.97% -6.39%
Interest -4.42% -3.82%
PerpetualPremium -1.42% -1.82%
PerpetualDiscount -2.31% -1.89%
FixedReset N/A N/A
Funds (see below for calculations)
CPD -2.89% -2.72%
DPS.UN -3.70% -4.29%
Index
BMO-CM 50 -2.59% -1.88%

Claymore has published NAV and distribution data for its exchange traded fund (CPD) and I have derived the following table:

CPD Return, 1- & 3-month, to September, 2008
Date NAV Distribution Return for Sub-Period Monthly Return
June 30 16.88 0.00    
July 31, 2008 16.50 0.00   -2.25%
August 29 16.91 0.00   +2.48%
Sept 25 16.41 0.2135 -1.69% -2.89%
Sept 30, 2008 16.21   -1.22%
Quarterly Return -2.72%

The DPS.UN NAV for October has been published so we may calculate the September returns (approximately!) for this closed end fund:

DPS.UN NAV Return, September-ish 2008
Date NAV Distribution Return for period
August 27 $20.03   +2.82%
Estimated August Stub +0.12%
Sept 24 19.64   -2.07%
Sept 26 19.3321
Estimate
0.30 -0.04%
Estimate
October 1, 2008 18.97   -1.87%
Estimated October Stub -0.25%
Estimated September Return -3.70%
CPD had a NAV of $16.89 on August 27 and $16.91 on August 29. The estimated August end-of-month stub period return for CPD was therefore +0.12%, which is added to the DPS.UN period return.
The return for the period August 27-Sept 24 was -1.95%; since the August stub period return was +0.12%, the August 29-September 24 return is estimated as -2.07%
CPD had NAVs of $16.63, 16.41 & 16.41 on September 24, 25 & 26, respectively; a distribution of $0.2135 was paid with a Sept. 25 ex-date. Total return for September 24-26 was therefore -0.04%.
CPD had a NAV of $16.17 on October 1 and $16.21 on September. The estimated October beginning of month stub period return for CPD was therefore -0.25%, which is added to the DPS.UN period return to estimate a return for the period of -1.62%.
The September return for DPS.UN’s NAV is therefore the product of three period returns, -2.07%, -0.04% and -1.62%, to arrive at an estimate for the calendar month of -3.70%

Now, to see the DPS.UN quarterly NAV approximate return, we refer to the calculations for July and August:

DPS.UN NAV Returns, three-month-ish to end-September-ish, 2008
July-ish -3.16%
August-ish +2.63%
September-ish -3.70%
Three-months-ish -4.29%

October 1, 2008

October 1st, 2008

Just imagine that there are penetrating and astute observations being made here today, OK?

European bank bail-out friction

Possible higher risk-weight for ABS in Europe

Squabbles and alleged skullduggery at Reserve Primary Fund

Note that these indices are experimental; the absolute and relative daily values are expected to change in the final version. In this version, index values are based at 1,000.0 on 2006-6-30.
The Fixed-Reset index was added effective 2008-9-5 at that day’s closing value of 1,119.4 for the Fixed-Floater index.
Index Mean Current Yield (at bid) Mean YTW Mean Average Trading Value Mean Mod Dur (YTW) Issues Day’s Perf. Index Value
Ratchet N/A N/A N/A N/A 0 N/A N/A
Fixed-Floater 4.77% 4.85% 82,740 15.70 6 -0.3554% 1,077.7
Floater 5.36% 5.40% 48,769 14.87 2 -3.3543% 750.8
Op. Retract 5.08% 5.18% 126,326 3.72 14 -0.2095% 1,031.0
Split-Share 5.80% 8.01% 56,785 4.10 12 -0.1437% 968.8
Interest Bearing 6.43% 7.25% 42,707 3.77 3 -0.5934% 1,073.4
Perpetual-Premium 6.25% 6.29% 54,941 13.49 1 0.0000% 993.0
Perpetual-Discount 6.22% 6.29% 179,982 13.49 70 -0.0069% 860.6
Fixed-Reset 5.10% 4.99% 1,186,721 15.32 10 -0.1918% 1,110.8
Major Price Changes
Issue Index Change Notes
BAM.PR.K Floater -6.0000% Closed at 15.51-16.74, with the tmxmoney.com reporting the size as 0x3. Volume 525 shares in the morning, nothing in the afternoon. Ho-hum, just another day of market-making at the Toronto Exchange.
BAM.PR.J OpRet -4.7064% Now with a pre-tax bid-YTW of 8.18% based on a bid of 20.57 and a softMaturity 2018-3-30 at 25.00. Compare with BAM.PR.H (7.11% to 2012-3-30), BAM.PR.I (6.84% to 2013-12-30) and BAM.PR.O (8.84% to 2013-6-30); and with the perpetuals at about 7.6%.
DFN.PR.A SplitShare -2.2581% Asset coverage of just under 2.3:1 as of September 15 according to the company. Now with a pre-tax bid-YTW of 7.15% based on a bid of 9.09 and a hardMaturity 2014-12-1 at 10.00.
POW.PR.B PerpetualDiscount -2.1359% Now with a pre-tax bid-YTW of 6.67% based on a bid of 20.16 and a limitMaturity.
WFS.PR.A SplitShare -2.0000% Asset coverage of just under 1.6:1 as of September 18, according to Mulvihill. Now with a pre-tax bid-YTW of 10.39% based on a bid of 8.82 and a hardMaturity 2011-6-30. Below $9, some might find even the regular monthly retraction to be attractive.
BCE.PR.C FixFloat -1.5612%  
BCE.PR.Z FixFloat -1.4614%  
GWO.PR.I PerpetualDiscount -1.3714% Now with a pre-tax bid-YTW of 6.57% based on a bid of 17.26 and a limitMaturity.
TD.PR.P PerpetualDiscount -1.2981% Now with a pre-tax bid-YTW of 5.86% based on a bid of 22.81 and a limitMaturity.
PWF.PR.L PerpetualDiscount -1.2458% Now with a pre-tax bid-YTW of 6.31% based on a bid of 20.61 and a limitMaturity.
FIG.PR.A InterestBearing -1.2245% Asset coverage of 1.7+:1 as of September 29 according to Faircourt. Now with a pre-tax bid-YTW of 6.95% (mostly as interest) based on a bid of 9.68 and a hardMaturity 2014-12-31 at 10.00
BCE.PR.Y FixFloat -1.2220%  
FTN.PR.A SplitShare -1.1364% Asset coverage of just under 2.2:1 as of September 15 according to the company. Now with a pre-tax bid-YTW of 7.70% based on a bid of 8.70 and a hardMaturity 2015-12-1 at 10.00
GWO.PR.H PerpetualDiscount -1.0633% Now with a pre-tax bid-YTW of 6.57% based on a bid of 18.61 and a limitMaturity.
BNA.PR.C SplitShare -1.0338% Asset coverage of 3.2+:1 as of August 31 according to the company. Coverage now of just under 2.8:1 based on BAM.A at 28.97 and 2.4 BAM.A held per preferred. Now with a pre-tax bid-YTW of 11.68% (!) based on a bid of 14.36 and a hardMaturity 2019-1-10 at 25.00. Compare with BNA.PR.A (9.60% to 2010-9-30) and BNA.PR.B (9.54% to 2016-3-25).
BCE.PR.A FixFloat -1.0309%  
BAM.PR.H OpRet -1.0305% See BAM.PR.J, above
FBS.PR.B SplitShare +1.1957% Asset coverage of 1.6+:1 as of September 25, according to TD Securities. Now with a pre-tax bid-YTW of 7.33% based on a bid of 9.31 and a hardMaturity 2011-12-15 at 10.00
CIU.PR.A PerpetualDiscount +1.2625% Now with a pre-tax bid-YTW of 6.05% based on a bid of 19.25 and a limitMaturity.
HSB.PR.C PerpetualDiscount +1.3131% Now with a pre-tax bid-YTW of 6.41% based on a bid of 20.06 and a limitMaturity.
GWO.PR.G PerpetualDiscount +1.6183% Now with a pre-tax bid-YTW of 6.14% based on a bid of 21.35 and a limitMaturity.
BCE.PR.G FixFloat +1.9108%  
LFE.PR.A SplitShare +1.9629% Asset coverage of 2.2+:1 as of September 15 according to the company. Now with a pre-tax bid-YTW of 7.12% based on a bid of 9.35 and a hardMaturity 2012-12-1 at 10.00
W.PR.H PerpetualDiscount +2.0202% Now with a pre-tax bid-YTW of 6.84% based on a bid of 20.20 and a limitMaturity.
POW.PR.A PerpetualDiscount +2.2770% Now with a pre-tax bid-YTW of 6.38% based on a bid of 22.01 and a limitMaturity.
SBN.PR.A SplitShare +2.7397% Asset coverage of 2.1+:1 as of September 18, according to Mulvihill. Now with a pre-tax bid-YTW of 7.38% based on a bid of 9.00 and a hardMaturity 2014-12-1 at 10.00.
Volume Highlights
Issue Index Volume Notes
SLF.PR.E PerpetualDiscount 84,132 Desjardins crossed 75,000 at 18.35. Now with a pre-tax bid-YTW of 6.22% based on a bid of 18.24 and a limitMaturity.
CM.PR.E PerpetualDiscount 73,500 Nesbitt crossed 13,000 at 20.30, TD crossed 60,000 at 20.10. Now with a pre-tax bid-YTW of 7.02% based on a bid of 20.01 and a limitMaturity.
BNS.PR.M PerpetualDiscount 69,400 Nesbitt crossed 50,000 at 19.75. Now with a pre-tax bid-YTW of 5.81% based on a bid of 19.73 and a limitMaturity.
CM.PR.D PerpetualDiscount 58,784 TD crossed 49,800 at 20.75. Now with a pre-tax bid-YTW of 6.98% based on a bid of 20.66 and a limitMaturity.
BNS.PR.R FixedReset 57,820 RBC bought 10,000 and 25,000, both lots at 24.85, both from anonymous.

There were seventeen other index-included $25-pv-equivalent issues trading over 10,000 shares today.

Synthetic Extended Deposit Insurance – the Critique

October 1st, 2008

Maximizing deposit insurance coverage is a favourite topic with my friends at Financial Webring Forum – see, for example, the thread Multiple RRSP accounts advisable when reach $100k?, and that’s only the first one I found. People go into endless loving detail about how to maximize coverage through use of separate accounts for spouses, joint accounts, trust accounts, multiple institutions … in the States, there’s an outfit called Promontory that handles all that for a fee.

I mentioned Promontory briefly yesterday:

There has been some criticism of a diversification service which allows large deposits to be distributed amongst many banks and be entirely insured:

“When I first saw Promontory, I was amazed that the regulators would let it fly,” says Sherrill Shaffer, a former chief economist at the New York Federal Reserve Bank. “It undermines a lot of the safeguards around the FDIC deposit fund. I’m astounded that the FDIC has not picked up on that and tried to shut down that loophole.”

The loophole Promontory exploits is the FDIC rule that allows an individual to open up federally insured accounts of up to $100,000 at an unlimited number of banks.

Edward Kane, senior fellow of the FDIC’s Center for Financial Research, says CDARS intercepts FDIC premiums.

“It’s portrayed as a public-spirited way to help customers as opposed to a way to game the system,” he says. “They’ve decided there’s a loophole that they’re in charge of.”

… which I confess I don’t understand. The only legitimate criticism I have been able to come up with is that it exploits the minimum and therefore deprives the financial system as a whole of the due diligence that would arise from a large depositor being worried about the soundness of the bank he uses. But this concern is not consistent with the criticism in the article, or with the level of disdain for the process expressed.

However, I have had some discussion with specialists in the field; the concern is that the FDIC is insuring all deposits anyway – the Wachovia deal – and should get paid for it. Infinite deposit insurance! Now there’s a moral hazard issue if ever there was one. Problems at IndyMac & WaMu and the subsequent wipe-out of common shareholders were brought to a head by a run on deposits … it seems to me that infinite deposit insurance will allow banks to ignore the hazards of losing confidence.

So, when you don’t understand something, you ask a question, right? It saves a lot of time. I sent an eMail to Prof. Sherrill Shaffer:

You are quoted in the captioned story at [Bloomberg] as saying ““When I first saw Promontory, I was amazed that the regulators would let it fly. It undermines a lot of the safeguards around the FDIC deposit fund. I’m astounded that the FDIC has not picked up on that and tried to shut down that loophole.”

I regret that I do not understand your criticism. If we can accept that FDIC premia are computed rationally and based on insured deposits, then Promontory is simply engaged in an exchange of value.

The only criticism I have been able to come up with is that when a large depositor’s assets are diversified amongst banks in this manner, the system as a whole is deprived of the due diligence that he might otherwise do if the bulk of the deposit was uninsured. But the Bloomberg story does not bring up this critique.

I would be very grateful if you could help me understand your concern.

Dr. Shaffer was kind enough to respond at length and to grant permission to be quoted.

You are correct that extended deposit insurance coverage (whether statutory or synthesized) does tend to reduce the degree of market discipline exerted by large depositors.

The more market discipline that’s in place, the better it is for everybody … although it should be noted that I am referring to market discipline that is rational. The excesses of irrational (or uninformed) market discipline is what causes perfectly good banks to suffer runs in the first place, which is why the discount window was invented. The Panic of 1907 is the classic example, but there is also the Panic of 1825 and the events following the collapse of Overend and Gurney.

It should be noted, however, that evidence of rational market discipline of banks is a little hard to come by. In the post Banks and Subordinated Debt, I highlighted the Cleveland Fed’s mostly vain attempt to extract useful information from credit spreads. Given that it is institutional investors who will determine these spreads – and FIXED INCOME institutional investors at that, who are well known to be both much smarter and better looking than the equity guys – I suggest that hopes for market discipline exerted by large retail depositors is more of an expression of piety than the foundation of successful regulation.

You are also correct that Promontory would be engaged in a simple exchange of value if the FDIC premia were computed on the basis of insured deposits. However, FDIC premia are instead computed as a fraction of (essentially) total domestic deposits, not merely insured deposits. (The exact assessment base is total deposits, less foreign deposits, less cash & due from depository institutions, less pass-through reserve balances, less a few smaller exclusions – please see pages 2-3 of the attached file.) Under this current system, any means of extending deposit insurance coverage to a larger fraction of total domestic deposits does not directly result in larger premium payments to the FDIC.

I have uploaded the file regarding FDIC assessments.

I hadn’t been aware of that. I am open to correction, but it seems to me that establishing deposit insurance premia based on total deposits rather than insured deposits rather undermines the policy objective of market discipline:

  • The FDIC will be on the moral defensive should it wish to enforce the limit at the expense of uninsured depositors
  • There is no advantage to the insured institution, in terms of premia, to establish a reputation for soundness that will attract uninsured deposits.
  • There is less room than there might otherwise be for institutions to offer higher rates for uninsured deposits, rewarding depositors for the (perceived) additional risk

Rather, the banking industry as a whole is assessed higher premium rates in years when the FDIC’s fund drops below the Designated Reserve Ratio spelled out in federal law. To the extent that Promontory member banks impose larger losses on the FDIC when they fail, non-Promontory banks help pay the tab to the same extent as Promontory banks, and thus cross-subsidize the extra coverage provided to Promontory banks.

So the first problem caused by CDARS is that the FDIC is not compensated for the additional risk ex ante, and any ex post compensation involves an element of cross-subsidization from non-CDARS banks. This is the “unpriced risk” concern.

I agree, all this follows from the fact that premia are charged on uninsured deposits at the same rate as insured ones.

A second problem is that, if our policy makers desired to extend deposit insurance coverage to larger accounts, doing so by statute would avoid the overhead costs (data base costs, marketing costs, administrative and executive costs, etc.) associated with a synthesized coverage such as CDARS. Those overhead costs therefore represent a deadweight loss, paid directly by CDARS banks but ultimately passed on to society. This is the “efficiency concern.”

This is a familiar argument that is seen in virtually everything that can be construed as a “public good” – medicare, toll-roads, transit, you-name-it – not just deposit insurance. One’s views on this question will be heavily influenced by idealogy; there’s no need to go into it in detail here.

There’s not enough information, either! If there was, in fact, a two-tiered deposit system in which the market clearly differentiated between insured and uninsured deposits, then we could start dissecting the data to determine where the line between the two should be drawn. But there ain’t, so we won’t.

A third problem, more philosophical in nature, is that Congress has periodically re-visited the question of whether $100,000 is an appropriate ceiling on FDIC coverage, and thus far has rejected the alternative of raising that cap (although that may change soon). By achieving a much larger cap of $50 million for participating banks, CDARS legally circumvents the expressed intent of Congress. Equivalently, we can view CDARS as extending to all depositors the same protection accorded to depositors in “too-big-to-fail” banks – a protection that Congress has explicitly sought to limit, as in some provisions of the 1991 FDIC Improvement Act. Thus, the effect of CDARS runs contrary to the spirit, though not the letter, of federal law.

On the other hand, one might consider CDARS as being a simple diversification mechanism … like a mutual fund in many ways, although the big difference is that the “diversification” is simply a mechanism to achieve concentration in FDIC’s credit strength. I will suggest that a great deal of this problem would be solved if Congress applied the same limit to premium calculation as it does to insurance coverage.

*********************

There are other cross-currents in the mix. I have briefly mentioned (most recently on May 16) the Fed’s decade-long drive to pay interest on reserves; the idea being that increasing the attractiveness to banks of reservable deposits will assist the Fed to transmit its monetary policy to the broader economy. And we have recently witnessed the bizarre occurance of Treasury writing Credit Default Swaps on MMFs (see September 19) … it’s totally unclear to me what long-term influence that might have, and whether policy will change to require banks to hold capital against branded MMFs.

As far as I know, the CDIC charges premia based on insured deposits only:

Premiums are based on the total amount of insured deposits held by members as of April 30th each year, calculated in accordance with the CDIC Act and its Differential Premiums By-law, which classifies member institutions into one of four premium categories.

Classification is based on a mix of quantitative and qualitative factors. Premium rates in effect for the 2006 premium year, unchanged from 2005, were as follows:
• Category 1—1/72nd of 1% of insured deposits
• Category 2—1/36th of 1% of insured deposits
• Category 3—1/18th of 1% of insured deposits
• Category 4—1/9th of 1% of insured deposits

Note that 2007 “saw 98 percent of its members ranked in the best rated premium categories”. So much for this great-sounding differential premia song-and-dance!

These are strange times and the public demands the right never to lose money on short term investments, particularly the ones that pay higher interest than stinky old T-Bills. But I want to thank Dr. Shaffer again for taking the time to respond in such detail to my eMail.

Update 2008-10-3 Dr. Shaffer has read this post and comments:

Although I haven’t yet begun to dwell on such possibilities, much of the problem would be solved if the FDIC’s premium rate structure could be revised to charge banks in proportion to their insured deposits rather than their total domestic deposits.

A further option could be considered under such a revision: Banks could perhaps be given their choice of what level of coverage to receive (and pay for), whether $100,000 or some larger amount. As long as the pricing was actuarially fair, any such choices would be revenue-neutral to the FDIC on average.

Of course, choosing a larger level of coverage would tend to undermine market discipline, as you corrected noted. But recent events have indicated that the existing market discipline was already inadequate to constrain risk-taking at many institutions, even with the post-1980
$100,000 limit.

The idea of letting the banks themselves decide where to the draw the line is an attractive free-market solution, but I’m not convinced (yet!) that such a move would be in the public interest.

I perceive deposit insurance to serve the purpose of:

  • To aid the economy by letting Mom and Pop know that they are perfectly safe in keeping a cash float at the bank
  • To reduce the risk of self-feeding runs on the banks that might otherwise occur if Mom & Pop decide that their emergency stash is not safe
  • As a public service, so that Mom & Pop don’t have to read and understand a bank’s annual report prior to depositing the weekly paycheque

If everybody was a professional fixed income analyst, there would be no need for deposit insurance at all. And therefore, I say, a variable cut-off (however attractive theoretically) is simply too complicated. Let Mom & Pop know that if they invest their tuppence wisely in the bank it will be safe and sound; and any bank has the same magic number to remember. Simply because of the policy objective to simplify the process.

Incidentally, I think the $100,000 limit is far too high to begin with. Given my views on the proper policy objective, I think that something along the lines of “median household annual income, rounded up to next $10,000, reviewed every five years” is much better. If you have more than that (in cash!) … well, sorry guys, either diversify your banks or buy a money market fund.

Update #2, 2008-10-3: In accordance with legislation passed today, the limit is now $250,000 until Dec. 31, 2009, according to the FDIC.

The Savings & Loan Crisis

October 1st, 2008

I started hunting for a good reference after reading Assiduous Reader lystgl‘s quotation in the comments to September 30.

Timothy Curry and Lynn Shibut of the FDIC wrote a paper for the FDIC Banking Review, The Cost of the Savings and Loan Crisis: Truth and Consequences.

It seems, not surprisingly, that there are a lot of estimates of the cost, which I assume are influenced by political considerations:

Over time, misinformation about the cost of the crisis has been widespread; some published reports have placed the cost at less than $100 billion, and others as high as $500 billion.

Some numbers which provide perspective – and will, I assume, not be particularly controversial – are provided in Table 1. From 1986-1989, there were 296 failures with assets of $125-billion addressed by the Federal Savings and Loan Insurance Corporation; from 1989-1995 there were 747 failures with assets of $394-billion addressed by Resolution Trust Corp.

As of year-end 1986, 441 thrifts with $113 billion in assets were book insolvent, and another 533 thrifts, with $453 billion in assets, had tangible capital of no more than 2 percent of total assets. These 974 thrifts held 47 percent of industry assets.

One of the problems with estimating the costs of this mess is ‘what to do about interest charges’:

During the FSLIC and RTC eras, the industry contributed $38.3 billion sometimes in partnership with the Treasury) in funding for the cleanup. Special government-established financing entities (FICO and REFCORP) raised these funds by selling long-term bonds in the capital markets. The Treasury contributed another $99 billion, 14 some or all of which was also borrowed because the federal government was experiencing large budget deficits during the period. When some analysts tabulated the costs of the cleanup, they included not only the principal borrowed but also interest costs for periods of up to 30 to 40 years on some or all of the borrowings.

Including the financing costs in addition to principal could easily double or triple the estimates of the final cost of the cleanup. However, in our view, including financing costs when tallying the costs of the thrift crisis is methodologically incorrect. It is invalid because, in present value terms, the amount borrowed is equal to the sum of the interest charges plus debt repayment. Adding the sum of interest payments to the amount borrowed would overstate the true economic cost of resolving the crisis.

The authors present their calculations with admirable clarity – I don’t know how much dispute there still might be over the total figure, but their tables look like a very good place to start reconciling differences – and conclude:

The savings and loan crisis of the 1980s and early 1990s produced the greatest collapse of U.S. financial institutions since the Great Depression. Over the 1986–1995 period, 1,043 thrifts with total assets of over $500 billion failed. The large number of failures overwhelmed the resources of the FSLIC, so U.S. taxpayers were required to back up the commitment extended to insured depositors of the failed institutions. As of December 31, 1999, the thrift crisis had cost taxpayers approximately $124 billion and the thrift industry another $29 billion, for an estimated total loss of approximately $153 billion. The losses were higher than those predicted in the late 1980s, when the RTC was established, but below those forecasted during the early to mid-1990s, at the height of the crisis.

HIMIPref™ Index Rebalancing: September 2008

October 1st, 2008
HIMI Index Changes, September 30, 2008
Issue From To Because
SBN.PR.A SplitShare Scraps Volume
DF.PR.A SplitShare Scraps Volume
STW.PR.A Scraps InterestBearing Volume

There were the following intra-month changes:

HIMI Index Changes during September 2008
Issue Action Index Because
BNS.PR.R Add FixedReset New Issue
CM.PR.K Add FixedReset New Issue
TD.PR.A Add FixedReset New Issue
RY.PR.I Add FixedReset New Issue
IQW.PR.D Delete Scraps Price

The Fixed-Reset Index was inaugurated and previously extant but untracked issues added to the database on a backdated basis; the 9/30 position has been uploaded.