BCE Buying Group includes WHO?????

April 9th, 2008

OK, this post is well behind the times, but something odd is going on.

A BCE press release dated December 14 states:

BCE Inc. (TSX, NYSE: BCE) is today issuing a statement in response to certain rumours in the market regarding the status of its definitive agreement to be acquired by an investor group led by Teachers’ Private Capital, the private investment arm of the Ontario Teachers’ Pension Plan, Providence Equity Partners Inc. and Madison Dearborn Partners, LLC (the Investor Group).

A BCE press release dated December 20 states:

BCE today received formal notice that the Canadian Radio-television and Telecommunications Commission has scheduled a public hearing for February 25, 2008, to review the change in control of BCE’s broadcasting licences to an Investor Group led by Teachers’ Private Capital, the private investment arm of the Ontario Teachers’ Pension Plan, Providence Equity Partners Inc., Madison Dearborn Partners, LLC and Merrill Lynch Global Private Equity.

Merrill Lynch Global Private Equity? When did they join? What are the terms? The BCE FAQs on the deal don’t mention them as principal members of the buying group. It also states:

What will be the level of Canadian ownership of BCE as a result of this transaction?

Immediately after the plan of arrangement is completed, not less than 58% of the equity ownership in BCE will be Canadian. The equity ownership of BCE would be as follows:
Teachers’ – 52%
Providence – 32%
Madison – 9%.
Other Canadian investors – 7%
The level of Canadian ownership cannot change as a result of any syndication of equity.

Somehow, Merrill Lynch Global Private Equity joined the consortium, with a very notable lack of fanfare.

IIF Releases Interim Report

April 9th, 2008

The Institute of International Finance has announced:

A report embracing the critical issues in today’s financial markets has been published by the Institute of International Finance (IIF), the global association of financial institutions. “The leadership of our industry recognizes its own responsibility to restore confidence in the financial markets, solve the problems that have arisen and prevent those problems from recurring in the future. We are fully committed to raising standards and improving best practices in the financial services industry,” stated Dr. Josef Ackermann, Chairman of the Board of Directors of the Institute of International Finance (IIF) and Chairman of the Management Board and the Group Executive Committee of Deutsche Bank AG, speaking on behalf of the IIF’s Board of Directors.

Some of the recommendations are priceless:

The suggestion has been made that some firms would find it useful to have at least as a portion of members of the risk committee of the Board (or equivalent) individuals with technical financial sophistication in risk disciplines, or with solid business experience giving clear perspectives on risk issues, consistently with the overall need for the Board to have the skills necessary to conduct meaningful review of management’s actions to manage risk, as to manage other aspects of the business.

Even more basically – but this did not exist at all firms – Boards need to understand the firm’s business strategy from a forward-looking perspective, not just to review current risk issues and audit reports. It should be the duty of senior management to review with the Board how that strategy is evolving over time, and when and to what extent the firm is deviating from that strategy (e.g., when a strategy morphed into heavy dependence on conduits or on structured products).

… whereas some recommendations, to the extent that they have any meaning at all, are dangerous:

Taking the view that consistent achievement of high standards requires a shared sense of norms and yardsticks to help avoid backsliding, the IIF will recommend a suite of best practices to be embraced voluntarily, perhaps in the context of a “code of conduct” to which the world’s leading financial institutions could subscribe. Because there are substantial differences in business models, mix of business, exposures, regulatory oversight and culture, there is unlikely to be a single solution to any issue that would be optimal for all firms and all circumstances. Thus, “best practice” as used here is not a legal obligation but a high standard for firms to apply in developing solutions appropriate to their own situations.

As usually discussed, and as is ideal, “best practice” can mean “Don’t be afraid to learn from others”. Those who have any experience in the matter will know that “best practice” really means “tick these boxes and don’t you dare think about what you’re doing”.

There are a number of recommendations dealing with the issue of managers not talking to each other, which echoes the finding of the International Report on Risk Management Supervision.

The IIF continues to highlight the problem of pro-cyclicity:

Basel II can make a substantial difference to the stability of regulated institutions. One of its main strengths is sensitivity to risk. However, it is important to recognize that as currently structured, the Accord will have procyclical effects, especially as banks reduce internal ratings and adjust models for current events. Therefore, further consideration will be needed as how to mitigate these effects, including broadening the use of through-the-cycle rating methodologies.

They make a formal genuflection to the cause celebre du jour:

52. There is a strong sense that externally mandated compensation policies would be at odds with the need to forge competitive, efficient firms that serve the interests of consumer and corporate clients. While recognizing that compensation policies should remain subject to the discretion of the CEO and the oversight of the Board, there is strong support for the view that the incentive compensation model should be closely related by deferrals or other means to shareholders’ interests and long-term, firmwide profitability. Focus on the longer term implies that compensation programs ought as a general matter to take better into account cost of capital, not just revenues. Consideration should be given to ways through which the financial targets against which compensation is assessed can be measured on a risk-adjusted basis. The principle of making the compensation model consistent with shareholders’ interests is well established in some contexts but has been unevenly applied across the industry, especially with respect to compensation of sales and trading functions.

53. Severance pay packages should be tied to performance, consistently with the general principle of alignment with the long-term interests of shareholders.

54. Transparency and proper disclosure to shareholders of compensation policies and criteria, including appropriate alignment of such policies with the firm’s business strategy, is important. Due to competitive issues, disclosure should be focused on principles and process.

There is also some recognition that bank-sponsored conduits are not as off-balance-sheet as might be desired:

Recent events highlight the need for firms to address the proper assessment of nonlegal reputational risk of off-balance sheet vehicles and other potential exposures. Such analysis should include consideration of whether risk of reputation damage could lead a firm to take exposures back onto its balance sheet with adverse liquidity and capital implications. Senior management must be confident that such return of assets would not happen if these exposures are treated as off-balance sheet for regulatory purposes, and Boards should assure themselves that management is properly attentive to this issue. And, on the other hand, supervisors should not take firms’ internal assessment of such risk as necessary grounds to require consolidation for accounting or capital purposes.

The next one’s really going to annoy the Internuts, who are already up in arms about Level 3 “Mark to Make-Believe” accounting … in times like this, when for many instruments there is nothing – nothing! – to be marked to, the Committee seems sympathetic to what will shortly be dubbed Level 4 valuation “Mark to What Looks Good”:

For these reasons, the Committee believes that broad thinking is needed on how to address such consequences, whether through means to switch to modified valuation techniques in thin markets, or ways to implement some form of “circuit breaker” in the process that could cut short damaging feedback effects while remaining consistent with the basics of fair-value accounting. And, while there is no desire to move away from the fundamentals of fair-value accounting, the Committee feels that it is nonetheless essential to consider promptly whether there are viable sound proposals that could limit the destabilizing downward spiral of forced liquidations, writedowns and higher risk and liquidity premia. The Committee is developing specific proposals for consideration in a timely fashion.

My reaction to recommendation #86 is mixed in the extreme!

86. Many investors relied on the rating when making credit decisions. More sophisticated investors were able to make their own assessments to a degree but many less sophisticated investing institutions relied on investment mandates where the rating was the paramount feature. The Committee finds that though rating agencies make their models available to investors, without detailed underlying loan-back data from the banks, additional information on stress testing and the underlying assumptions of the model, it is not possible for investors to verify the accuracy of the ratings models. It would in any case also be beyond the capacity of many investors to validate independently the rating agency models. More detailed loan data needs to be made more readily available and more information on stress testing particularly from a credit perspective will be released by the rating agencies, but for many investors the ratings models will remain a black box. Given this, ratings models should be subject to standards of independent review and external validation (akin to those in Basel II for Internal Ratings-Based Models).

OK … so I like the bit about making more data available. But I don’t really care about whether or not it’s beyond the capacity of many investors to validate independently the rating agency models … if it’s beyond their capacity, they should get competent advice. And I really dislike the idea of subjecting ratings models to independent review and external validation.

Credit ratings are investment opinions, dammit! Take it, leave it, get other independent advice … but don’t get the government or agency thereof involved in validating and reviewing investment advice. That’s a road to ruin if ever I saw one.

Recommendation #88 is full of helpful little hints for investors to abnegate responsibility for their investments and ensure that credit ratings don’t need to be understood as long as all the little boxes are ticked. Recommendation #89 contains such an absolutely priceless phrase that I’m going to quote it without further comment:

For example, the Market Best Practices might suggest that investors, making use of enhanced disclosures suggested elsewhere in this paper:
• Understand vehicles clearly, including the position of rated tranches and cash flows in the structure.

And as we proceed to #91, I’m so highly amused I can barely type:

91. Key issues that need attention at the level of the structured product include:
a. Quality of information provided in offer documents for structured products varies significantly based on the originating firm, country of origination and type of product. Offer documents can range from five pages to more than fifty pages and sometimes are difficult to read.

Awwww … the offer documents are sometimes difficult to read, are they? Awwww. Holy smokes, it should have become apparent by now that what the banks behind the IIF really want is a world of plain vanilla investments that banks can flog for high fees without anybody taking any risk.

All in all, a report more notable for its entertainment value than its contribution to debate.

April 8, 2008

April 8th, 2008

Naked Capitalism points out that banks’ balance sheets tend to bloat in times of economic stress (this has been true for a long time – see Banks’ Advantage in Hedging Liquidity Risk) but manages to overstate his case:

A reader pointed us to this Bloomberg story, “Tribune, Dole May Need to Draw Down Bank Credit Lines,” which suggests that these two companies accessing committed credit lines is a harbinger of further demands on bank equity (note that a standby line does not result in a capital charge until the funds are drawn down).

Unfortunately, the helpful note is incorrect: a standby line does indeed result in a capital charge, equal to 50% of the charge that would be applied if the funds were actually drawn, provided this line is irrevokable:

Off-balance sheet items subject to a 50 percent conversion factor:
(1) Transaction-related contingencies, including performance standby letters of credit, shipside guarantees, bid bonds, performance bonds, and warranties.
(2) Unused portions of commitments with an original maturity exceeding one year, including underwriting commitments and commercial credit lines.
(3) Revolving underwriting facilities (RUFs), note issuance facilities (NIFs), and other similar arrangements, regardless of maturity.

Off-balance sheet items subject to a zero percent conversion factor:
(1) Unused portions of commitments with an original maturity of one year or less.
(2) Unused portions of commitments (regardless of maturity) which are unconditionally cancellable at any time, provided a separate credit decision is made before each drawing.

Assiduous Readers will remember that liquidity guarantees for ABCP are charged at a 10% conversion factor, subject to certain qualifying rules, and that there are rumblings (supported by me) that this might change.

For further confirmation of this fact, we can look at Citigroup’s Annual Report, page 75, “Components of Capital Under Regulatory Guidelines”, Note 7:

Risk-adjusted assets also include the effect of other off-balance-sheet exposures, such as unused loan commitments and letters of credit, and reflect deductions for certain intangible assets and any excess allowance for credit losses.

According to the most recent FDIC quarterly report:

Unused loan commitments – includes credit card lines, home equity lines, commitments to make loans for construction, loans secured by commercial real estate, and unused commitments to originate or purchase loans. (Excluded are commitments after June 2003 for originated mortgage loans held for sale, which are accounted for as derivatives on the balance sheet.)

This line item (see Table II-A) totalled USD 8.3-trillion in the fourth quarter of 2007, up 10% from 4Q06.

Accrued Interest looks at the US Jobs number as a predictor of stock prices:

Conclusion? During the last recession, unemployment predicted nothing useful to investors. Even had you been given a crystal ball and knew for a fact what future unemployment figures would be, it still wouldn’t have consistently indicated the right market trade. In fact it often would have given you the wrong indication.

True enough, but the last recession was a little funny … the market spent the first 2-3 years of this century unwinding the Tech Wreck … which is not to say that Accrued Interest is wrong, mind you, but rather to point out that there are a lot of factors in this chaotic world, and it is just as wrong to dismiss an indicator out of hand as it is to place blind faith in it. It’s all data.

Volume picked up today, although it can be called “good” only in contrast to recent depressed levels. Not too many price moves.

Note that these indices are experimental; the absolute and relative daily values are expected to change in the final version. In this version, index values are based at 1,000.0 on 2006-6-30
Index Mean Current Yield (at bid) Mean YTW Mean Average Trading Value Mean Mod Dur (YTW) Issues Day’s Perf. Index Value
Ratchet 5.18% 5.22% 28,707 15.20 2 -0.0609% 1,088.8
Fixed-Floater 4.85% 5.39% 62,096 15.02 8 +0.0340% 1,029.2
Floater 5.13% 5.17% 72,102 15.24 2 -2.4196% 811.8
Op. Retract 4.86% 4.19% 82,951 3.52 15 +0.0655% 1,046.6
Split-Share 5.36% 5.92% 91,100 4.09 14 +0.1595% 1,030.5
Interest Bearing 6.19% 6.29% 65,491 3.91 3 -0.0337% 1,095.3
Perpetual-Premium 5.91% 5.44% 206,445 5.87 7 +0.0398% 1,017.7
Perpetual-Discount 5.68% 5.71% 304,416 14.14 63 +0.0128% 916.6
Major Price Changes
Issue Index Change Notes
BAM.PR.K Floater -4.8361%  
ELF.PR.G PerpetualDiscount -2.8424% Now with a pre-tax bid-YTW of 6.35% based on a bid of 18.80 and a limitMaturity.
BAM.PR.G FixFloat -1.0116%  
IAG.PR.A PerpetualDiscount +1.2249% Now with a pre-tax bid-YTW of 5.61% based on a bid of 20.66 and a limitMaturity.
Volume Highlights
Issue Index Volume Notes
TD.PR.R PerpetualDiscount 239,800 TD bought 38,600 from Nesbitt at 24.90; Nesbitt crossed 100,000 at 24.90; TD bought 25,000 from Desjardins at 24.89. Now with a pre-tax bid-YTW of 5.68% based on a bid of 24.89 and a limitMaturity.
BMO.PR.L PerpetualDiscount 128,300 Nesbitt crossed 50,000 at 24.61, then bought 38,000 in two tranches at 24.60 from “Anonymous” (not necessarily the same anonymous). Now with a pre-tax bid-YTW of 5.93% based on a bid of 24.60 and a limitMaturity.
MFC.PR.B PerpetualDiscount 109,165 TD crossed 100,000 at 22.10. Now with a pre-tax bid-YTW of 5.33% based on a bid of 22.00 and a limitMaturity.
NA.PR.L PerpetualDiscount 59,320 Nesbitt crossed 13,400 at 21.07. Ex-Dividend April 9. Now with a pre-tax bid-YTW of 5.88% based on a bid of 20.98 and a limitMaturity.
BMO.PR.J PerpetualDiscount 37,365 Nesbitt crossed 30,000 at 20.09. Now with a pre-tax bid-YTW of 5.70% based on a bid of 20.05 and a limitMaturity.

There were twenty-three other index-included $25-pv-equivalent issues trading over 10,000 shares today.

TOC.PR.B : Ticker Change to TRI.PR.B on April 17

April 8th, 2008

The Thomson Corporation has announced:

new stock ticker symbols for Thomson Reuters that will be effective at the opening of trading on April 17, following the expected close of Thomson’s acquisition of Reuters Group PLC earlier that morning.

Thomson Reuters will have two parent companies, both of which will be publicly listed – The Thomson Corporation, an Ontario company, will be renamed Thomson Reuters Corporation, and Thomson Reuters PLC will be a new UK company in which existing Reuters shareholders will receive shares as part of their consideration in the transaction.

On April 17, Thomson Reuters Corporation common shares will begin trading on the New York Stock Exchange (NYSE) and Toronto Stock Exchange (TSX) under the ticker symbol “TRI”. Thomson common shares will continue to trade under the symbol “TOC” through April 16. The symbol for Thomson’s Series II preference shares that are listed on the TSX will change to “TRI.PR.B” from “TOC.PR.B”.

The CUSIP number for TRI.PR.B will be 884903 30 3.

TOC.PR.B is tracked by HIMIPref™; it has been in and out of the HIMIPref™ indices over the years on volume concerns – it is currently “out” due to volume concerns. Following a credit review, it was affirmed as Pfd-2(low) by DBRS.

FTU.PR.A : How to Analyze?

April 8th, 2008

In the list of March’s good and bad performers, I suggested that FTU.PR.A should, perhaps, be analyzed as an equity substitute … I’ve been thinking a bit more about this, on a very casual basis.

The issue is fully described on the fund’s website. The underlying portfolio is 15 US Financials, the asset coverage is only a little over 1.4:1 and the chance of a formal default is more than some might really be comfortable with – which is, presumably, why DBRS has them under review.

But hear me out! They’re currently quoted at 8.76-97 on the TSX and, given a bid of 8.76, yield 8.62% (dividend/capital gain) to maturity 2012-12-1. They may have been marked down too far, due to the “US Financials” angle and the relatively low asset coverage. If you assume you can take a good-sized position at $9.00 then your asset coverage on the actual amount invested is 1.6:1. If you further assume that:
(a) all dividend payments ($0.04375 monthly = $0.525 annually) are made
(b) the NAV declines by 37.5% to $9, implying a total return on US Financials over the next 4 3/4 years of -20% (after allowance of 17.5% for dividends paid) see update, below
(c) then the entire $9 will be paid to the pref holders
(d) and the return on the investment will be approximately $0.525/$9.00 = 5.8% annually.

Better performance by the US Financials would increase the investment return, to a maximum of the non-defaulting 8.62% rate.

That would be a fixed-incomey way of analyzing them … are there other ways? We have this … thing … worth $14.41 as of March 31. We can say that preferred shareholders have written a deep in the money call on the position, at $10 strike price, exercise 2012-12-1, after buying it at $9 (the assumed invested capital in the prefs). So, perhaps, in option terms, we’ve paid $14.41 for the position in US financials and received $5.41 for writing our call.

I know some Assiduous Readers LOVE options … perhaps some might have comments as to whether we’re happy or sad about the price we’ve received for the call?

Update: Assiduous Reader prefhound points out in the comments that expenses for the fund, plus withholding taxes on US dividends, will reduce the NAV by $1.58 over the remaining life of the fund. Therefore, point (b) of the analysis above should read:

(b) the NAV declines by 37.5% to $9, implying a total return on US Financials over the next 4 3/4 years of -20% -8.7% (after allowance of 17.5% for dividends paid and 11.3% for withholding & expenses and 0.0% for capital share dividends)

Mea culpa! I was too interested in casting the problem as an option exercise to do a proper job on the regular fixed-income style analysis.

IMF Global Financial Stability Report

April 8th, 2008

The IMF has announced:

The widening and deepening fallout from the U.S. subprime mortgage crisis could have profound financial system and macroeconomic implications, according to the IMF’s latest Global Financial Stability Report (GFSR).
At present, the issuance of most structured credit products—instruments that pool and tranche credit risk exposures in various ways—is at a standstill and many banks are coping with losses and involuntary balance expansions, the April 2008 report said. The report examines this and other forces that could push the current credit crisis into a full credit crunch, as well as offering policy recommendations to mitigate the impact.

The full report is available online (all 211 pages!).

There is bound to be massive excitement regarding their estimate of $945-billion in total losses due to the credit crunch – this has already been picked up by the Globe and Mail and, in turn, by Financial Webring Forum.

This figure comes from Table 1.1 of the report, and is most interesting since it is in two parts: the first half of the table estimates losses from Unsecuritized US Loans as being $225-billion on $12,370-billion outstanding (= 1.8%), while the “Estimate of Mark-to-Market Losses on Related Securities” is $720-billion on $10,840-billion outstanding (=6.6%). This is not entirely due to the somewhat different mix of these sectors – unsecuritized commercial real estate has an estimated loss rate of 1.25%, while CMBS has a loss rate of 22.3%. There will undoubtedly be some screaming that the bad paper was securitized, but let’s have a look at the methodology for the estimates, found in Annex 1.2 on page 46 of the report (page 63 of the PDF):

Losses on different types of loans were estimated from regression analysis using various relevant factors, such as changes in unemployment, lending standards, and housing and commercial real estate pricing, as relevant. In each case, the outstanding stock of the type of loan was multiplied with the change in the forecasted loss (charge-off) rate. The underlying historical data on loan loss rates and changes in lending standards were obtained from the Federal Reserve.

Losses on residential and commercial mortgages were also estimated by a second procedure. This one involved a three-step process. We first estimated the percentage of loans that would become delinquent, then the percentage of delinquent loans that would default, and fi nally losses on defaulted loans after completion of the foreclosure or recovery process. Each of these steps is detailed below.

Reasonable enough. How about for the securitized loans?:

Losses for securities were next estimated by multiplying the outstanding stock of each type of security by the change in the market price of the relevant index over the course of a year. The average price change was obtained by weighting price changes for constituent indices comprised of different vintages and ratings by the issuance in each of these categories.

In other words, this is simply the first method described in the leveraged losses paper by Greenlaw et al. that I have discussed previously.

As the authors note, however:

The fall in market prices may be overshooting potential declines in cash flows over the lifetime of underlying loans.

I suspect that this overshoot is quite considerable. If we apply the 1.25% loss rate for unsecuritized commercial real-estate to CMBS, we reduce the projected loss to $12-billion from $210-billion. If we apply the unsecuritized sub-prime loss rate of 15% to the ABS & ABS CDOs, we reduce these projected losses to $225-billion from $450-billion.

Clearly, my calculations above (which reduce total projected losses from $945-billion to $522-billion) are completely pie-in-the-sky, back of an envelope approximations. That being said, I would like to see more discussion on why securitized loans are projected to have such huge incremental losses over non-securitized loans … preferably, a discussion including actual facts.

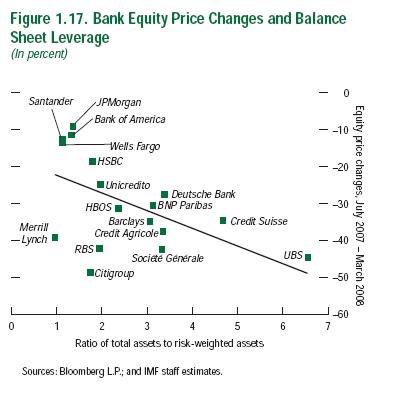
There’s a very interesting point made on page 19 of the report, with its accompanying figure 1.17:

Some banks have rapidly expanded their balance sheets in recent years, largely by increasing their holdings of highly rated securities that carry low risk weightings for regulatory capital purposes (see Box 1.3 on page 31). Part of the increase in assets reflects banks’ trading and investment activities. Investments grew as a share of total assets, and wholesale markets, including securitizations used to finance such assets, grew as a share of total funding (Figure 1.16). Banks that adopted this strategy aggressively became more vulnerable to illiquidity in the wholesale money markets, earnings volatility from marked-to-market assets, and illiquidity in structured finance markets. Equity markets appear to be penalizing those banks that adopted this strategy most aggressively (Figure 1.17).

We may well see a bigger charge – and more differentiated by issuer – for non-government AAA assets in the next Basel agreement! Table 1.2 shows that the market is already making adjustments to the relative level of its haircuts … but in proportions that bely the headlines!

I’m mainly interested in policy implications, however: one, which echoes the new FASB rules on QSPEs, is introduced on page 38:

Stricter rules are needed on the use of off-balance-sheet entities by banks, and disclosure should be improved so that investors can assess the sponsor’s risk to the entity. Supervisors may need to strengthen guidelines regarding the circumstances under which risk transfers to off-balance-sheet entities warrant capital relief (see Chapter 2).

The executive summary of the report includes (on pp. xii – xvi) a number of short- and medium-term recommendations for future regulation and conduct. I’ll be returning to this topic … eventually!

Update: This report – and the loss estimate – has also been noted on Econbrowser by Prof. Menzie Chinn.

April 7, 2008

April 7th, 2008

Not much interesting today!

There is some excitement over a recent accounting initiative – how’s that for an attention-grabbing lead-in – which Naked Capitalism believes to mean the end of SIVs.

At issue is the ultimate effect of a FASB change in guidelines that will:

remove the Qualified Special Purpose Entity (QSPE) concept (used for some securitizations) from FAS 140, Accounting for Transfers and Servicing of Financial Assets and Extinguishments of Liabilities

The QSPE concept specified in FAS 140 had been criticized, particularly in light of recent market turmoil tied largely to origination (and related issues involving securitization) of subprime mortgages. To obtain ‘sale treatment’ or off-balance sheet treatment for assets transferred or sold to a QSPE, (and for asset transfers generally) the transferor (e.g. a bank or other originator of mortgages) must give up control over the assets, otherwise the assets would have to remain on the transferors balance sheet (and gain on sale would be limited). The QSPE concept as defined in FAS 140 provided a means to demonstrate control was given up by the transferor, however, the restrictions specified in FAS 140 prohibiting a QSPE from managing the underlying assets, unless pre-specified in the original documents of the securitization trust, or agreed to subsequently by a majority of the investors in the trust, was viewed by some as threatening the ability of lenders and servicers to modify the terms of mortgages to help borrowers avoid foreclosure in the recent credit crunch.

“For five years now we’ve struggled with application of [FAS] 140 [and] the fundamental question related to servicer discretion,” said board member Larry Smith. “We said, it’s almost impossible to structure a vehicle with the objectives the board had in mind when they created QSPEs: that is, an entity that has no decision making whatsoever relative to the run-out of these assets.”

He added, “I think the staff is appropriate in recommending that we do away with QSPE’s; there are no assets short of US treasury assets that somebody doesn’t make decisions over during the life of [those] assets.”

“We have a concept that really isn’t working, and we need to come up with some other way to help investors evaluate what these transactions are,” said Smith. “At the end of the day, I don’t think the current application of 140 is what the board that approved 140 had in mind, therefore I think we should just stop pretending, and eliminate QSPE’s from our literature, and rely on other aspects of the consolidation model to give [us an] answer that is appropriate.”

A major problem with the declaration that SIVs are dead is that SIVs are not equivalent to QSPEs:

QSPE (Qualified Special Purpose Entity)
A QPSE is described in FASB Statement of Standards No. 140 “Accounting for Transfers and Servicing of Financial Assets and Extinguishments of Liabilities”, which includes conditions to limit the permissible activities of the QSPE, what the QSPE can hold, and when the QSPE can sell or dispose of non cash financial assets.

SIV (Structured Investment Vehicle)
SIV (Structured Investment Vehicle) are credit arbitrage vehicles. They issue debt in the U.S. and Euro medium-term note and commercial paper markets, and with the proceeds, purchase assets of varying maturities. These assets consist of traditional classes of debt and ABS. Derivatives transactions are used to eliminate both interest-rate and foreign-exchange risk. Since the SIVs are funding at the inexpensive AAA levels (commercial paper, junior notes and medium-term notes) but can purchase securities/assets at varying investment-grade rating levels, they can pick up credit spread over the life of that asset. Some SIVs are bank sponsored and some are privately sponsored. In either case, the SIV and its assets are usually off the balance sheet of the sponsor. For instance, on November 26, 2007, HSBC announced that it would place 2 of its SIVs back on its balance sheet and provide them with additional funding in the amount of $35 billion in order to restore investor confidence.

This could be important to Canadian investors, because there’s quite a bit of securitization done by Canadian banks via QSPEs – for instance, the Royal Bank 2007 Annual Report discloses $25-billion in securitized assets (page 82 of the PDF) which could, potentially, be affected by this change (they may reappear on the balance sheet, to be considered equivalent to covered bonds).

As far as I can make out, however, an independent SIV can still be an independent SIV … although these may find their liquidity guarantees to be more expensive in the future.

A slight upward move on the market today; volume increased a little, but not enough to take notice of.

Note that these indices are experimental; the absolute and relative daily values are expected to change in the final version. In this version, index values are based at 1,000.0 on 2006-6-30
Index Mean Current Yield (at bid) Mean YTW Mean Average Trading Value Mean Mod Dur (YTW) Issues Day’s Perf. Index Value
Ratchet 5.20% 5.23% 28,658 15.19 2 +0.0409% 1,089.5
Fixed-Floater 4.85% 5.41% 60,912 14.99 8 -0.0098% 1,028.8
Floater 5.00% 5.04% 71,316 15.47 2 -0.3779% 832.0
Op. Retract 4.86% 4.18% 81,984 3.34 15 +0.0564% 1,045.9
Split-Share 5.37% 5.95% 91,362 4.09 14 +0.2976% 1,028.9
Interest Bearing 6.18% 6.20% 65,597 3.91 3 +0.0680% 1,095.6
Perpetual-Premium 5.92% 5.49% 207,943 5.88 7 +0.1245% 1,017.3
Perpetual-Discount 5.68% 5.71% 303,631 14.14 63 +0.1498% 916.5
Major Price Changes
Issue Index Change Notes
BCE.PR.Z FixFloat -2.1277%  
CIU.PR.A PerpetualDiscount -1.6229% Now with a pre-tax bid-YTW of 5.66% based on a bid of 20.61 and a limitMaturity.
PWF.PR.F PerpetualDiscount -1.4462% Now with a pre-tax bid-YTW of 5.67% based on a bid of 23.17 and a limitMaturity.
SLF.PR.E PerpetualDiscount -1.1628% Now with a pre-tax bid-YTW of 5.56% based on a bid of 20.40 and a limitMaturity.
BAM.PR.G FixFloat -1.1429%  
BAM.PR.H OpRet +1.1058% Now with a pre-tax bid-YTW of 5.14% based on a bid of 25.60 and a softMaturity 2012-3-30 at 25.00. Compare with BAM.PR.I (4.87% to call 2010-7-30 at 25.50) and BAM.PR.J (5.45% to softMaturity 2018-3-30).
BNS.PR.N PerpetualDiscount +1.1154% Now with a pre-tax bid-YTW of 5.58% based on a bid of 23.57 and a limitMaturity.
PWF.PR.K PerpetualDiscount +1.1463% Now with a pre-tax bid-YTW of 5.62% based on a bid of 22.06 and a limitMaturity.
PWF.PR.E PerpetualDiscount +1.1880% Now with a pre-tax bid-YTW of 5.49% based on a bid of 24.70 and a limitMaturity.
SLF.PR.C PerpetualDiscount +1.4536% Now with a pre-tax bid-YTW of 5.54% based on a bid of 20.24 and a limitMaturity.
ELF.PR.F PerpetualDiscount +1.6577% Now with a pre-tax bid-YTW of 6.39% based on a bid of 20.85 and a limitMaturity.
FFN.PR.A SplitShare +1.9467% Asset coverage of 1.9+:1 as of March 31, according to the company. Now with a pre-tax bid-YTW of 5.39% based on a bid of 9.95 and a hardMaturity 2014-12-1 at 10.00.
SLF.PR.D PerpetualDiscount +2.0192% Now with a pre-tax bid-YTW of 5.55% based on a bid of 20.21 and a limitMaturity.
HSB.PR.D PerpetualDiscount +2.1948% Now with a pre-tax bid-YTW of 5.63% based on a bid of 22.35 and a limitMaturity.
BCE.PR.I FixFloat +3.4783%  
Volume Highlights
Issue Index Volume Notes
SLF.PR.D PerpetualDiscount 151,528 Nesbitt crossed 150,000 at 20.03. Now with a pre-tax bid-YTW of 5.55% based on a bid of 20.21 and a limitMaturity.
BMO.PR.K PerpetualDiscount 83,200 Nesbitt crossed 75,000 at 23.00. Now with a pre-tax bid-YTW of 5.78% based on a bid of 23.01 and a limitMaturity.
BMO.PR.L PerpetualDiscount 79,945 Recent new issue. Now with a pre-tax bid-YTW of 5.93% based on a bid of 24.60 and a limitMaturity.
BMO.PR.I OpRet 64,400 TD bought 10,000 from Nesbitt at 25.15, then another 29,500 at the same price. Anonymous bought 10,000 from CIBC at 25.15. Now with a pre-tax bid-YTW of 5.03% based on a bid of 25.10 and a softMaturity 2008-11-24 at 25.00.
SLF.PR.B PerpetualDiscount 34,686 Now with a pre-tax bid-YTW of 5.58% based on a bid of 21.61 and a limitMaturity.

There were twelve other index-included $25-pv-equivalent issues trading over 10,000 shares today.

IIAC Reviews 2007 Canadian Bond Markets

April 7th, 2008

The Investment Industry Association of Canada announced on March 28:

There is no doubt that the late summer re-pricing of global credit risk reverberated through the Canadian financial system. Due to the augmented volatility, corporate financings in the second half took a step back. More specifically, Maple issuance accounted for only $4.9 billion, 18% of the $26.9 billion issued throughout the year. Similarly, asset-backed securities, which have been on the rise for the past four years, slowed tremendously down 65% year over year. The Investment Industry Association of Canada (IIAC) today released its periodical An Issue of Debt: Inside Canada’s Debt Markets that included analysis and results for the year that was.

The periodical An Issue of Debt contains excellent issuance and trading statistics for Canadian Fixed Income instruments for the third and fourth quarters of 2007, together with the final figures for the year.

MAPF Performance : March 2008

April 7th, 2008

The fund’s amazing run of three superb months in a row came to a halt in March as the market swooned with the fund having overweighted PerpetualDiscount issues, the hardest hit sector. A fair bit of trading mitigated, but could not eliminate, the damage.

This was only one month, however, and the fund takes a long-term approach to the markets – it is recognized that not every month will deliver excess returns, or even every quarter. Trades are executed when there is a good probability of relative profit and in the past this has brought excess returns over time, albeit with considerable lumpiness in the timing of these excess returns.

Returns to March, 2008
Period MAPF Index
One Month -4.56% -2.79%
Three Months +0.16% -0.31%
One Year -1.59% -7.07%
Two Years (annualized) +1.88% -1.58%
Three Years (annualized) +3.82% +0.65%
Four Years (annualized) +4.35% +0.99%
Five Years (annualized) +10.69% +2.61%
Six Years (annualized) +8.19% +3.13%
Seven Years (annualized) +9.28% +2.86%
The Index is the BMO-CM “50”

Returns assume reinvestment of dividends, and are shown after expenses but before fees. Past performance is not a guarantee of future performance. You can lose money investing in Malachite Aggressive Preferred Fund or any other fund. For more information, see the fund’s main page.

The competition was outpaced for the quarter: the fund outperformed the closed-end fund (DPS.UN), which returned an estimated -2.26% on the month and an estimated -0.79% on the quarter, as well as the exchange-traded fund (CPD) which returned -2.90% and -1.23% on the month and quarter. Calculation details for these two performances have been posted separately.

The yields available on high quality preferred shares remain elevated, which is reflected in the current estimate of sustainable income.

Calculation of MAPF Sustainable Income Per Unit
Month NAVPU Portfolio
Average
YTW
Leverage
Divisor
Sustainable
Income
June, 2007 9.3114 5.16% 1.03 0.4665
September 9.1489 5.35% 0.98 0.4995
December, 2007 9.0070 5.53% 0.942 0.5288
March, 2008 8.8512 6.17% 1.047 0.5216
NAVPU is shown after quarterly distributions.

It should be noted that I do not have this calculation audited in any way, so unitholders will not be able to see an explicit confirmation of these figures, although you will be able to derive the year end figure for yourselves – I will be happy to provide supporting documents for the calculation to unitholders on request. Readers should also note that the fund is indifferent to whether investment returns are in the form of capital gains or dividends – portfolio management seeks to maximize total return after tax for a notional high-marginal-rate investor based in Ontario. It should also be noted that this sustainable income figure is not targetted in any manner; it may well go down if, for instance, it is decided that quality is cheap and trades are executed to increase credit quality at the expense of yield.

For all that, though, there is a point to the calculation – it shows that in the recent past, and subject to the usual warning that historical performance is not necessarily indicative of future returns:

  • Income expectations are a lot more stable than market prices, and
  • the overall trend is upwards

In the year ended March, 2008, however, the total dividend distribution of $0.525925 was very close to the theoretical figure, albeit with considerable quarterly variance.

The market finished March just a little bit above the trough of November, 2007, as several new issues (NA 6% Perps, BMO 5.80% Perps, BNS Reset Perps and TD 5.60% Perps) knocked the market down considerably. I suspect that there will be something of a pause in issuance for the nonce, as the market recovers … but I’ve been wrong on these macro-calls before and I’ll be wrong again in the future! The issuers will do what’s good for their business, without worrying too much about what’s good for the marketplace.

Long term investors will be most interest in the dividend-friendly Ontario budget, which went a long way towards countering the future effects of the dividend hostile Federal budget.

The fund did considerable trading during the month, but most of this trading was simply opportunistic switching between issues with similar characteristics.

MAPF : Preferred Share Fund 2007 Financials Posted

April 6th, 2008

The audited financial statements for my pooled fund, Malachite Aggressive Preferred Fund, for 2007, have been posted, together with a full statement of transactions in 2007.

The monthly, quarterly, annual and annualized performances to the end of the first quarter, 2008, have also been published. A commentary on the performance for March 2008 is in preparation.

While the year to March 31 was disappointing in terms of absolute return, I was very pleased to see that the fund handily outperformed its benchmark during a vicious downturn – the causes of this downturn have been previously discussed. Large market moves are, in general, good for the fund’s relative performance because individual issues will become out of alignment with their peers, which allows trading opportunities. Unitholders can be assured that I work constantly to ensure that the fund’s outperformance will be maintained in the future, in both up and down markets.

Full information regarding the fund is available at the fund’s main page, where subscription information is also available.