Archive for January, 2010

Weston Prefs and a Possible MBO Scenario

Saturday, January 9th, 2010

Assiduous Reader BL writes in and says:

First, congratulations on your blog, an excellent read!

That’s the spirit, BL! You know how to get me to respond to eMail!

I’ve been looking at the George Weston common shares recently and there has been some speculation of a possible management buyout. If that ever were to happen, I’d like to know what you think would happen to the prefs? Do you think they would fall in value (like BCEs) because the company would probably have to take massive leverage to proceed to the MBO or do you think they would be taken out with the common stock at at least face value? Just curious to understand if there is any way to play this possible deal with the prefs.

The answer to that question depends on the structure of the deal.

The BCE deal was structured as a Plan of Arrangement under the Corporations Act. It is my understanding – as a layman in matters of law and tax – that this was done in order to make the deal simpler.

Since it was a Plan of Arrangement, each class of shareholder voted separately; since the preferred shareholders would have seen a marked decline in credit quality if their shares had remained outstanding, they needed to be placated with a redemption offer in order to obtain their assent.

If it had been a regular take-over, with XYZ making a normal offer for the common shares, the preferred shareholders would not have got a vote and would have been squashed by the weight of new debt; this would have been the case had the earlier intention to become an Income Trust come to fruition.

In the case of Weston and its possible MBO – you can rest assured that an army of expensive lawyers and accountants will be making the decisions based on what’s good for the guy paying them. Without expertise in such matters or access to the talks regarding financing of a possible deal, an outsider is simply guessing.

January 8, 2010

Saturday, January 9th, 2010

One way of recruiting in a bonus-hostile environment is to double base pay:

London’s investment banks are luring back traders and analysts they lost to brokerage firms during the credit crisis, compensating for lower bonuses by as much as doubling base salaries.

The hires show how London’s investment banks are regrouping after boutique firms poached traders during the credit crisis with the promise of greater job security and a bonus. London’s investment banks cut about 49,000 jobs and logged more than $560 billion of writedowns during the credit crisis, according to data compiled by Bloomberg. Brokers including Eden Financial Ltd. and Liberum Capital Ltd. added sales traders and analysts to win clients from rivals that had received taxpayer bailouts.

While bankers are considering their options on relocating to Germany or Switzerland to avoid the tax, [headhunter Jason] Kennedy said the bonus levy isn’t an issue for traders and bankers looking to move after April to larger firms because the government has said the charge will apply only to this year’s bonuses.

Holy smokes, this market’s on wheels. PerpetualDiscounts were up 46bp today and FixedResets gained 11bp, this being accomplished in a fairly well-behaved manner – there are only eight entries on the performance highlights table. Volume eased off a bit, but was still reasonably respectable.

HIMIPref™ Preferred Indices
These values reflect the December 2008 revision of the HIMIPref™ Indices

Values are provisional and are finalized monthly
Index Mean
Current
Yield
(at bid)
Median
YTW
Median
Average
Trading
Value
Median
Mod Dur
(YTW)
Issues Day’s Perf. Index Value
Ratchet 0.00 % 0.00 % 0 0.00 0 0.4864 % 1,715.4
FixedFloater 5.70 % 3.85 % 35,752 18.95 1 -1.0886 % 2,733.5
Floater 2.29 % 2.64 % 110,041 20.70 3 0.4864 % 2,143.0
OpRet 4.81 % -10.64 % 110,011 0.09 13 0.0792 % 2,334.1
SplitShare 6.36 % -6.46 % 172,588 0.08 2 0.2199 % 2,111.1
Interest-Bearing 0.00 % 0.00 % 0 0.00 0 0.0792 % 2,134.3
Perpetual-Premium 5.76 % 5.58 % 147,017 2.28 12 0.0230 % 1,904.9
Perpetual-Discount 5.72 % 5.75 % 183,881 14.28 63 0.4589 % 1,835.4
FixedReset 5.39 % 3.48 % 318,752 3.87 41 0.1120 % 2,184.6
Performance Highlights
Issue Index Change Notes
NA.PR.N FixedReset -1.97 % YTW SCENARIO
Maturity Type : Call
Maturity Date : 2013-09-14
Maturity Price : 25.00
Evaluated at bid price : 26.32
Bid-YTW : 3.65 %
BAM.PR.G FixedFloater -1.09 % YTW SCENARIO
Maturity Type : Limit Maturity
Maturity Date : 2040-01-08
Maturity Price : 25.00
Evaluated at bid price : 19.08
Bid-YTW : 3.85 %
BAM.PR.K Floater 1.08 % YTW SCENARIO
Maturity Type : Limit Maturity
Maturity Date : 2040-01-08
Maturity Price : 14.91
Evaluated at bid price : 14.91
Bid-YTW : 2.65 %
MFC.PR.C Perpetual-Discount 1.13 % YTW SCENARIO
Maturity Type : Limit Maturity
Maturity Date : 2040-01-08
Maturity Price : 19.75
Evaluated at bid price : 19.75
Bid-YTW : 5.76 %
MFC.PR.B Perpetual-Discount 1.19 % YTW SCENARIO
Maturity Type : Limit Maturity
Maturity Date : 2040-01-08
Maturity Price : 20.45
Evaluated at bid price : 20.45
Bid-YTW : 5.75 %
ELF.PR.F Perpetual-Discount 1.26 % YTW SCENARIO
Maturity Type : Limit Maturity
Maturity Date : 2040-01-08
Maturity Price : 20.15
Evaluated at bid price : 20.15
Bid-YTW : 6.62 %
RY.PR.C Perpetual-Discount 1.42 % YTW SCENARIO
Maturity Type : Limit Maturity
Maturity Date : 2040-01-08
Maturity Price : 21.37
Evaluated at bid price : 21.37
Bid-YTW : 5.46 %
POW.PR.D Perpetual-Discount 1.57 % YTW SCENARIO
Maturity Type : Limit Maturity
Maturity Date : 2040-01-08
Maturity Price : 21.60
Evaluated at bid price : 21.94
Bid-YTW : 5.71 %
Volume Highlights
Issue Index Shares
Traded
Notes
TRP.PR.A FixedReset 190,721 Nesbitt crossed blocks of 50,000 and 70,000 at 25.90, then bought blocks of 23,700 and 10,600 from National at the same price.
YTW SCENARIO
Maturity Type : Call
Maturity Date : 2015-01-30
Maturity Price : 25.00
Evaluated at bid price : 25.90
Bid-YTW : 3.85 %
BNS.PR.R FixedReset 64,040 Scotia sold 10,000 to TD at 26.46, then another 14,400 at 26.45, then crossed 25,700 at 26.45.
YTW SCENARIO
Maturity Type : Call
Maturity Date : 2014-02-25
Maturity Price : 25.00
Evaluated at bid price : 26.50
Bid-YTW : 3.35 %
GWO.PR.H Perpetual-Discount 56,329 RBC sold 12,700 to Scotia at 20.72, then crossed 30,000 at the same price.
YTW SCENARIO
Maturity Type : Limit Maturity
Maturity Date : 2040-01-08
Maturity Price : 20.72
Evaluated at bid price : 20.72
Bid-YTW : 5.90 %
RY.PR.X FixedReset 37,476 RBC crossed 25,000 at 28.17.
YTW SCENARIO
Maturity Type : Call
Maturity Date : 2014-09-23
Maturity Price : 25.00
Evaluated at bid price : 28.16
Bid-YTW : 3.55 %
BAM.PR.B Floater 31,393 Nesbitt crossed 19,200 at 14.90.
YTW SCENARIO
Maturity Type : Limit Maturity
Maturity Date : 2040-01-08
Maturity Price : 14.99
Evaluated at bid price : 14.99
Bid-YTW : 2.64 %
IGM.PR.B Perpetual-Discount 29,725 YTW SCENARIO
Maturity Type : Limit Maturity
Maturity Date : 2040-01-08
Maturity Price : 24.54
Evaluated at bid price : 24.75
Bid-YTW : 6.03 %
There were 27 other index-included issues trading in excess of 10,000 shares.

BIG.PR.C Greenshoe Taken Up a Bit

Friday, January 8th, 2010

Big 8 Split Corp has announced (though not yet on their website):

that, pursuant to an over-allotment option, it has completed an additional issuance of 23,500 Class C Preferred Shares, Series 1 (the “Class C Preferred Shares”) and 23,500 Class A Capital Shares (the “Capital Shares”) raising $752,000. As a result, the company has raised gross proceeds totalling approximately $25.2 million under its recent offering. The Class C Preferred Shares and Capital Shares were offered to the public by a syndicate of agents led by TD Securities Inc and Scotia Capital Inc., and including BMO Capital Markets, National Bank Financial Inc., Canaccord Capital Corporation, GMP Securities L.P., HSBC Securities (Canada) Inc., Raymond James Ltd., Blackmont Capital Inc., Desjardins Securities Inc., Dundee Securities Corporation, Manulife Securities Incorporated and Wellington West Capital Markets Inc.

Big 8 Split Inc. was established to generate dividend income for the preferred shares while providing holders of the Capital Shares with a leveraged opportunity to participate in capital appreciation from a portfolio of common shares of Bank of Montreal, The Bank of Nova Scotia, Canadian Imperial Bank of Commerce, Royal Bank of Canada, The Toronto-Dominion Bank, Great-West Lifeco Inc., Manulife Financial Corporation, and Sun Life Financial Inc. Information concerning Big 8 Split Inc. is available on our website at www.tdsponsoredcompanies.com

TXPR Reaches for Yield

Friday, January 8th, 2010

Standard & Poor’s has announced (although not yet on their official index news page):

the following index changes as a result of the semi-annual S&P/TSX Preferred Share Index Review. These changes will be effective at the open on Monday, January 18, 2010

TXPR Revision 2010/1
Additions
Ticker HIMIPref™
SubIndex
DBRS
Rating
Last
Index
Action
ACO.PR.A OpRet Pfd-2(low) Deleted
2009-1
CZP.PR.B Scraps
(FixedReset)
Pfd-3  
DC.PR.A Scraps
(OpRet)
Pfd-3(low)  
DC.PR.B Scraps
(FixedReset)
Pfd-3(low)  
DW.PR.A Scraps
(OpRet)
Pfd-3 Deleted
2009-1
FFH.PR.C Scraps
(FixedReset)
Pfd-3(low)  
GWO.PR.J FixedReset Pfd-1(low)  
IAG.PR.E Perpetual-Premium Pfd-2(high)  
IGM.PR.B Perpetual-Discount Pfd-2(high)  
NA.PR.O FixedReset Pfd-2  
POW.PR.C Perpetual-Discount Pfd-2(high) Deleted
2009-7
TCL.PR.D Scraps
(FixedReset)
Pfd-3(high)  
TRP.PR.A FixedReset Pfd-2(low)  
YPG.PR.C Scraps
(FixedReset)
Pfd-3(high)  

TXPR Revision 2010/1
Deletions
Ticker HIMIPref™
SubIndex
DBRS
Rating
Last
Index
Action
CL.PR.B Perpetual-Premium Pfd-1(low) Added
2008-7
ENB.PR.A Perpetual-Premium Pfd-2(low) Added
2008-7
NA.PR.N FixedReset Pfd-2 Added
2008-7
TCA.PR.X Perpetual-Discount Pfd-2(low) Added
2009-1
W.PR.J Perpetual-Discount Pfd-2(low) Added
2009-1

The net effect of these changes (counting solely by issue count, not by the undisclosed index weight; and counting HIMIPref™ "Scraps" issues according to their bracketted ‘would be’ subindex) are:

TXPR
Net Changes by Issue
January 2010
Category Adds Deletions Net
Class
FixedReset 8 1 +7
OpRet 3 0 +3
PerpDis 2 2 0
PerpPrem 1 2 -1
Credit
Pfd-1(low) 1 1 0
Pfd-2(high) 3 0 +3
Pfd-2 1 1 0
Pfd-2(low) 2 3 +1
Pfd-3(high) 2 0 +2
Pfd-3 2 0 +2
Pfd-3(low) 3 0 +3

Note: Sorry, folks, but with PrefLetter due out this weekend (among other things), I’m a little pushed for time! I’ll fill in the blanks as soon as I can … but just off the top of my head, it looks like fully half of the additions are below investment grade.

Update, 2010-1-9: Done!

Update, 2010-1-11: It should be noted that the summary tables do not reflect the year-end deletion of the issues that were redeemed, GWO.PR.X (Pfd-1(low), OpRet) and IGM.PR.A (Pfd-2(high), Opret). Thus, the credit quality decline from the last revision is actually more severe than may be inferred from the summary tables of this revision.

NY Fed Research on Term Spread & Business Cycle

Friday, January 8th, 2010

The Federal Reserve Bank of New York has released Staff Report 421 by Tobias Adrian, Arturo Estrella, and Hyun Song Shin titled Monetary Cycles, Financial Cycles, and the Business Cycle:

One of the most robust stylized facts in macroeconomics is the forecasting power of the term spread for future real activity. The economic rationale for this forecasting power usually appeals to expectations of future interest rates, which affect the slope of the term structure. In this paper, we propose a possible causal mechanism for the forecasting power of the term spread, deriving from the balance sheet management of financial intermediaries. When monetary tightening is associated with a flattening of the term spread, it reduces net interest margin, which in turn makes lending less profitable, leading to a contraction in the supply of credit. We provide empirical support for this hypothesis, thereby linking monetary cycles, financial cycles, and the business cycle.

I’ve never really been to comfortable with the idea that expectations inverts the yield curve – it seems to me to be asking too much of the world – expectations implies forecasting and forecasting, at least in my book, implies “wrong”. I’m a much bigger fan of the “roundaboutness” process, whereby a slowdown in consumer demand causes goods to pile up at each stage of the production cycle, which means that vendors of these goods have to borrow short term funds to finance the unexpected inventory, which drives up short rates and, as production slows down, also results in a general economic slowdown.

In other words, the curve flattening and the economic cycle are not causally related, but are both results of the same cause; it’s just that the yield curve reacts quicker. This explanation leave out the role of central banks, but I like it as the ‘unfettered free market’ explanation; central banks are simply there to smooth the extremes.

However, the authors of this paper put the central banks front and centre and seek to understand how the central bank action affects subsequent events – naturally enough, since that’s their job:

In this paper, we offer a possible causal mechanism that operates via the role of financial intermediaries and their active management of balance sheets in response to changing economic conditions. Banks and other financial intermediaries typically borrow in order to lend. Since the loans offered by banks tend to be of longer maturity than the liabilities that fund those loans, the term spread is indicative of the marginal profitability of an extra dollar of loans on intermediaries’ balance sheets. For any risk premium prevailing in the market, the compression of the term spread may mean that the marginal loan becomes uneconomic and ceases to be a feasible project from the bank’s point of view. There will, therefore, be an impact on the supply of credit to the economy, and, to the extent that the reduction in the supply of credit has a dampening effect on real activity, a compression of the term spread will be a causal signal of subdued real activity. Adrian and Hyun Song Shin (2009 a, b) argue that the reduced supply of credit also has an amplifying effect due to the widening of the risk premiums demanded by the intermediaries, putting a further downward spiral on real activity.

We explore this hypothesis, and present empirical evidence consistent with it.

They claim their results are relevant to the “Greenspan Conundrum”:

Our results shed light on the recent debate about the “interest rate conundrum.” When the FOMC raised the Fed Funds target by 425 basis points between June 2004 and June 2006 (from from 1 to 5.25 percent), the 10-year Treasury yield only increased by 38 basis points over that same time period (from 4.73 to 5.11 percent). Greenspan (2005) referred to this behavior of longer term yields as a conundrum for monetary policy makers. In the traditional, expectations driven view of monetary transmission, policy works as increases in short term rates lead to increases in longer term rates, which ultimately matter for real activity.

Our findings suggest that the monetary tightening of the 2004-2006 period ultimately did achieve a slowdown in real activity not because of its impact on the level of longer term interest rates, but rather because of its impact on the slope of the yield curve. In fact, while the level of the 10-year yield only increased from 38 basis points between June 2004 and 2006, the term spread declined 325 basis points (from 3.44 to .19 percent). The fact that the slope flattened meant that intermediary profitability was compressed, thus shifting the supply of credit, and hence inducing changes in real activity. The .19 percent at the end of the monetary tightening cycle is below the threshold of .92 percent, and, as a result, a recession occurred within 18 months of the end of the tightening cycle (the NBER dated the start of the recession as December 2007). The 18 month lag between the end of the tightening cycle, and the beginning of the recession is within the historical length.

They show a strong relationship between Fed action and the term spread:

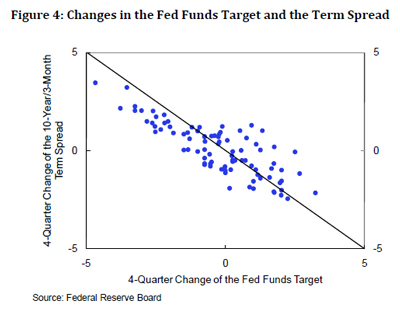
The important impact of changes in the Fed Funds target is not on the level of longer term interest rates, but rather on the slope of the yield curve. In fact, Figure 4 below shows that there is a near perfect negative one-to-one relationship between 4-quarter changes of the Fed Funds target and 4-quarter changes of the term spread (the plot uses data from 1987q1 to 2008q3). Variations in the target affect real activity because they change the profitability of financial intermediaries, thus shifting the supply of credit.

January 7, 2010

Thursday, January 7th, 2010

Assiduous Reader prefhound points out that I didn’t reproduce his chart when appending his comment to the January 4 post. Well, it’s reproduced now!

A grizzled and cynical old lawyer once told me that the first thing you learn in law school is that a contract is holy. The first thing you learn as a practicing lawyer is that a contract is where you start. And, it appears, Citigroup is as duplicious as any of them:

Last June, Citi was supposed to pay five former senior executives millions in severance payouts, but what the bank decided to do, instead, was not make those payment. The ex-employees were owed about $100 million (half of which had been paid out) but not wanting to be compared to AIG which, at the time, was in the midst of receiving death threats over bonuses, Citi chose to inform the group that it shouldn’t count on the remainder of the cash.

Deferred compensation at banks will give a massive competitive advantage to hedge funds and shadow banks.

Another zippetty-doo-dah-day for Canadian Preferreds, with PerpetualDiscounts up 33bp and FixedResets up 1bp. Volume was good.

HIMIPref™ Preferred Indices
These values reflect the December 2008 revision of the HIMIPref™ Indices

Values are provisional and are finalized monthly
Index Mean
Current
Yield
(at bid)
Median
YTW
Median
Average
Trading
Value
Median
Mod Dur
(YTW)
Issues Day’s Perf. Index Value
Ratchet 0.00 % 0.00 % 0 0.00 0 1.3607 % 1,707.1
FixedFloater 5.64 % 3.79 % 37,030 19.03 1 2.8252 % 2,763.6
Floater 2.30 % 2.65 % 110,566 20.65 3 1.3607 % 2,132.6
OpRet 4.82 % -10.81 % 113,548 0.09 13 0.1970 % 2,332.2
SplitShare 6.38 % -7.13 % 174,480 0.08 2 0.1542 % 2,106.5
Interest-Bearing 0.00 % 0.00 % 0 0.00 0 0.1970 % 2,132.6
Perpetual-Premium 5.76 % 5.56 % 147,097 2.28 12 0.2737 % 1,904.4
Perpetual-Discount 5.75 % 5.78 % 184,027 14.24 63 0.3341 % 1,827.0
FixedReset 5.40 % 3.53 % 321,830 3.87 41 0.0133 % 2,182.2
Performance Highlights
Issue Index Change Notes
CIU.PR.B FixedReset -1.96 % YTW SCENARIO
Maturity Type : Call
Maturity Date : 2014-07-01
Maturity Price : 25.00
Evaluated at bid price : 28.07
Bid-YTW : 3.92 %
PWF.PR.L Perpetual-Discount -1.09 % YTW SCENARIO
Maturity Type : Limit Maturity
Maturity Date : 2040-01-07
Maturity Price : 21.44
Evaluated at bid price : 21.76
Bid-YTW : 5.86 %
BAM.PR.K Floater 1.03 % YTW SCENARIO
Maturity Type : Limit Maturity
Maturity Date : 2040-01-07
Maturity Price : 14.75
Evaluated at bid price : 14.75
Bid-YTW : 2.68 %
POW.PR.D Perpetual-Discount 1.17 % YTW SCENARIO
Maturity Type : Limit Maturity
Maturity Date : 2040-01-07
Maturity Price : 21.60
Evaluated at bid price : 21.60
Bid-YTW : 5.82 %
MFC.PR.C Perpetual-Discount 1.19 % YTW SCENARIO
Maturity Type : Limit Maturity
Maturity Date : 2040-01-07
Maturity Price : 19.53
Evaluated at bid price : 19.53
Bid-YTW : 5.82 %
RY.PR.C Perpetual-Discount 1.20 % YTW SCENARIO
Maturity Type : Limit Maturity
Maturity Date : 2040-01-07
Maturity Price : 21.07
Evaluated at bid price : 21.07
Bid-YTW : 5.54 %
W.PR.J Perpetual-Discount 1.23 % YTW SCENARIO
Maturity Type : Limit Maturity
Maturity Date : 2040-01-07
Maturity Price : 23.68
Evaluated at bid price : 23.95
Bid-YTW : 5.87 %
BMO.PR.M FixedReset 1.24 % YTW SCENARIO
Maturity Type : Call
Maturity Date : 2013-09-24
Maturity Price : 25.00
Evaluated at bid price : 26.91
Bid-YTW : 2.95 %
MFC.PR.A OpRet 1.55 % YTW SCENARIO
Maturity Type : Call
Maturity Date : 2010-07-19
Maturity Price : 26.25
Evaluated at bid price : 26.87
Bid-YTW : -0.17 %
BAM.PR.G FixedFloater 2.83 % YTW SCENARIO
Maturity Type : Limit Maturity
Maturity Date : 2040-01-07
Maturity Price : 25.00
Evaluated at bid price : 19.29
Bid-YTW : 3.79 %
BAM.PR.B Floater 2.97 % YTW SCENARIO
Maturity Type : Limit Maturity
Maturity Date : 2040-01-07
Maturity Price : 14.90
Evaluated at bid price : 14.90
Bid-YTW : 2.65 %
Volume Highlights
Issue Index Shares
Traded
Notes
TD.PR.S FixedReset 116,476 Nesbitt crossed 100,000 at 26.05.
YTW SCENARIO
Maturity Type : Call
Maturity Date : 2013-08-30
Maturity Price : 25.00
Evaluated at bid price : 26.00
Bid-YTW : 3.69 %
IGM.PR.B Perpetual-Discount 102,415 Nesbitt crossed 42,400 at 24.57, then another 30,000 at 24.58.
YTW SCENARIO
Maturity Type : Limit Maturity
Maturity Date : 2040-01-07
Maturity Price : 24.40
Evaluated at bid price : 24.61
Bid-YTW : 6.06 %
CM.PR.A OpRet 99,557 Nesbitt crossed 92,100 at 26.60. There was also a sizeable cross yesterday. If these trades are being generated by my recent post on this issue, I want a commission!
YTW SCENARIO
Maturity Type : Call
Maturity Date : 2010-02-06
Maturity Price : 25.25
Evaluated at bid price : 26.51
Bid-YTW : -50.66 %
TRP.PR.A FixedReset 84,118 Nesbitt crossed 65,000 at 25.83.
YTW SCENARIO
Maturity Type : Call
Maturity Date : 2015-01-30
Maturity Price : 25.00
Evaluated at bid price : 25.83
Bid-YTW : 3.91 %
RY.PR.P FixedReset 57,009 TD crossed 34,600 at 28.00.
YTW SCENARIO
Maturity Type : Call
Maturity Date : 2014-03-26
Maturity Price : 25.00
Evaluated at bid price : 28.00
Bid-YTW : 3.42 %
BMO.PR.J Perpetual-Discount 38,600 YTW SCENARIO
Maturity Type : Limit Maturity
Maturity Date : 2040-01-07
Maturity Price : 21.01
Evaluated at bid price : 21.01
Bid-YTW : 5.43 %
There were 35 other index-included issues trading in excess of 10,000 shares.

LFE.PR.A: Capital Unitholders Get Warrants

Thursday, January 7th, 2010

Canadian Life Companies Split Corp. has announced:

that it has filed a final prospectus relating to an offering of warrants (“Warrants”) to all Class A Shareholders. Each Class A Shareholder of record on January 15, 2010 will receive one Warrant for each Class A Share held. Each Warrant will entitle the holder to purchase a “Unit” (consists of one Class A Share and one Preferred Share) upon payment of the subscription price of $15.65 (which is the sum of the most recently calculated NAV per Unit prior to the date of the preliminary prospectus plus the estimated per Unit fees and expenses of the Offering). Warrants may be exercised at any time before the earlier of i) October 27, 2010 or ii) such date which is 20 business days from the date the Company exercises its right to call the Warrants.

The net proceeds from the subscription of Units will be used to acquire additional securities in accordance with the Company’s investment objectives. The exercise of Warrants by holders will provide the Company with additional capital that can be used to take advantage of attractive investment opportunities and is also expected to increase the trading liquidity of the Class A Shares and the Preferred Shares and reduce the management expense ratio of the Company.

The Warrants are being exclusively provided to all Class A Shareholders. Warrantholders will have the opportunity to potentially acquire Units at a price lower than the trading price in the marketplace.

The NAVPU was 15.67 as of Dec 31, according to the company. The prospectus is available.

LFE.PR.A was last mentioned on PrefBlog when it was upgraded to Pfd-3(low) by DBRS. LFE.PR.A is tracked by HIMIPref™ but is relegated to the Scraps index on credit concerns.

January 6, 2010

Wednesday, January 6th, 2010

A long comment by Assiduous Reader prefhound has been appended to the January 4 post.

The Federal Reserve Bank of Kansas City has released the TEN Magazine, Winter 2010 with feature articles:

  • “How Will Unemployment Fare Following the Recession?”
  • LIVESTOCK’S LONG ROAD: Recession, global pullback weigh on producers
  • COMING HOME : Resurgence of working-age residents may boost rural economies
  • RESIDENTIAL MORTGAGES AND COMMUNITY BANKS: Smaller insured financial institutions see less decline

Preferred shares continued their rally, with PerpetualDiscounts up 22bp and FixedResets gaining 6bp – which took the median weighted average yield for that index down to 3.49%. PerpetualDiscounts now yield 5.80%, equivalent to 8.12% interest at the standard equivalency factor of 1.4x. Long Corporates continue to yield 6.0%, so the pre-tax interest-equivalent spread is now 212bp, continuing to tighten from its December 31 figure of 220bp. Volume was good.

HIMIPref™ Preferred Indices
These values reflect the December 2008 revision of the HIMIPref™ Indices

Values are provisional and are finalized monthly
Index Mean
Current
Yield
(at bid)
Median
YTW
Median
Average
Trading
Value
Median
Mod Dur
(YTW)
Issues Day’s Perf. Index Value
Ratchet 0.00 % 0.00 % 0 0.00 0 1.1974 % 1,684.2
FixedFloater 5.80 % 3.94 % 36,475 18.83 1 -2.2917 % 2,687.7
Floater 2.33 % 2.71 % 111,341 20.51 3 1.1974 % 2,104.0
OpRet 4.83 % -10.06 % 114,425 0.09 13 0.1291 % 2,327.6
SplitShare 6.39 % -4.67 % 180,877 0.08 2 0.0220 % 2,103.2
Interest-Bearing 0.00 % 0.00 % 0 0.00 0 0.1291 % 2,128.4
Perpetual-Premium 5.77 % 5.59 % 148,142 5.88 12 0.1627 % 1,899.2
Perpetual-Discount 5.77 % 5.80 % 185,184 14.25 63 0.2195 % 1,820.9
FixedReset 5.40 % 3.49 % 330,555 3.87 41 0.0640 % 2,181.9
Performance Highlights
Issue Index Change Notes
BAM.PR.G FixedFloater -2.29 % YTW SCENARIO
Maturity Type : Limit Maturity
Maturity Date : 2040-01-06
Maturity Price : 25.00
Evaluated at bid price : 18.76
Bid-YTW : 3.94 %
TCA.PR.X Perpetual-Discount -1.39 % YTW SCENARIO
Maturity Type : Limit Maturity
Maturity Date : 2040-01-06
Maturity Price : 46.42
Evaluated at bid price : 49.70
Bid-YTW : 5.56 %
BNS.PR.P FixedReset -1.25 % YTW SCENARIO
Maturity Type : Call
Maturity Date : 2013-05-25
Maturity Price : 25.00
Evaluated at bid price : 26.12
Bid-YTW : 3.49 %
NA.PR.N FixedReset -1.11 % YTW SCENARIO
Maturity Type : Call
Maturity Date : 2013-09-14
Maturity Price : 25.00
Evaluated at bid price : 26.66
Bid-YTW : 3.26 %
SLF.PR.F FixedReset -1.05 % YTW SCENARIO
Maturity Type : Call
Maturity Date : 2014-07-30
Maturity Price : 25.00
Evaluated at bid price : 27.46
Bid-YTW : 3.71 %
PWF.PR.K Perpetual-Discount 1.06 % YTW SCENARIO
Maturity Type : Limit Maturity
Maturity Date : 2040-01-06
Maturity Price : 21.60
Evaluated at bid price : 21.60
Bid-YTW : 5.74 %
SLF.PR.B Perpetual-Discount 1.06 % YTW SCENARIO
Maturity Type : Limit Maturity
Maturity Date : 2040-01-06
Maturity Price : 20.93
Evaluated at bid price : 20.93
Bid-YTW : 5.78 %
PWF.PR.H Perpetual-Discount 1.18 % YTW SCENARIO
Maturity Type : Limit Maturity
Maturity Date : 2040-01-06
Maturity Price : 24.07
Evaluated at bid price : 24.45
Bid-YTW : 5.88 %
PWF.PR.L Perpetual-Discount 1.22 % YTW SCENARIO
Maturity Type : Limit Maturity
Maturity Date : 2040-01-06
Maturity Price : 21.89
Evaluated at bid price : 22.00
Bid-YTW : 5.80 %
HSB.PR.D Perpetual-Discount 1.31 % YTW SCENARIO
Maturity Type : Limit Maturity
Maturity Date : 2040-01-06
Maturity Price : 22.26
Evaluated at bid price : 22.40
Bid-YTW : 5.62 %
GWO.PR.G Perpetual-Discount 1.69 % YTW SCENARIO
Maturity Type : Limit Maturity
Maturity Date : 2040-01-06
Maturity Price : 22.12
Evaluated at bid price : 22.27
Bid-YTW : 5.88 %
TRI.PR.B Floater 1.69 % YTW SCENARIO
Maturity Type : Limit Maturity
Maturity Date : 2040-01-06
Maturity Price : 21.37
Evaluated at bid price : 21.64
Bid-YTW : 1.79 %
BAM.PR.K Floater 2.38 % YTW SCENARIO
Maturity Type : Limit Maturity
Maturity Date : 2040-01-06
Maturity Price : 14.60
Evaluated at bid price : 14.60
Bid-YTW : 2.71 %
Volume Highlights
Issue Index Shares
Traded
Notes
TD.PR.I FixedReset 171,770 Dundee sold blocks of 24,000 shares, 21,000 and 14,000 to RBC at 27.75 and sold 20,000 to Desjardins at the same price. Desjardins crossed 20,000 at 27.75; RBC crossed 64,000 at the same price.
YTW SCENARIO
Maturity Type : Call
Maturity Date : 2014-08-30
Maturity Price : 25.00
Evaluated at bid price : 27.75
Bid-YTW : 3.61 %
BAM.PR.K Floater 79,300 Nesbitt crossed 50,000 at 14.62 and bought 21,600 from TD at the same price.
YTW SCENARIO
Maturity Type : Limit Maturity
Maturity Date : 2040-01-06
Maturity Price : 14.60
Evaluated at bid price : 14.60
Bid-YTW : 2.71 %
CM.PR.A OpRet 72,200 RBC crossed 69,100 at 26.69. I suspect the buyer didn’t read last night’s post on this issue!
YTW SCENARIO
Maturity Type : Call
Maturity Date : 2010-02-05
Maturity Price : 25.25
Evaluated at bid price : 26.60
Bid-YTW : -53.83 %
RY.PR.T FixedReset 69,673 RBC crossed 14,300 at 28.15 and 40,000 at 28.18.
YTW SCENARIO
Maturity Type : Call
Maturity Date : 2014-09-23
Maturity Price : 25.00
Evaluated at bid price : 28.12
Bid-YTW : 3.57 %
BNA.PR.C SplitShare 65,840 RBC crossed blocks of 50,000 and 12,000 at 19.05. They also crossed 74,900 BNA.PR.B at 21.79, but this issue isn’t in the indices (volume concerns) and so doesn’t get reported in these tables.
YTW SCENARIO
Maturity Type : Hard Maturity
Maturity Date : 2019-01-10
Maturity Price : 25.00
Evaluated at bid price : 19.00
Bid-YTW : 8.29 %
GWO.PR.L Perpetual-Discount 58,159 Nesbitt crossed 35,000 at 23.45.
YTW SCENARIO
Maturity Type : Limit Maturity
Maturity Date : 2040-01-06
Maturity Price : 23.29
Evaluated at bid price : 23.44
Bid-YTW : 6.07 %
There were 41 other index-included issues trading in excess of 10,000 shares.

CM.PR.A Trades Through Canadas

Wednesday, January 6th, 2010

Now I’ve seen it all.

CM.PR.A closed today at 26.65-80 after trading 3,142 shares in a range of 26.80-85.

According to the prospectus dated 2001-1-17:

The non-cumulative class A preferred shares Series 23 (the “Series 23 Shares”) of Canadian Imperial Bank of Commerce (“CIBC”) will be entitled to non-cumulative preferential cash dividends, payable quarterly, as and when declared by the Board of Directors of CIBC. Quarterly dividends shall be payable at a rate of $0.33125 per share.

on and after October 31, 2007, CIBC may redeem the Series 23 Shares in whole or in part by the payment in cash of a sum equal to the issue price per share plus, if redeemed before October 31, 2010, a premium, together with declared and unpaid dividends to the date fixed for redemption.

On and after July 31, 2011, subject to the right of CIBC on two days’ notice prior to the conversion date to redeem for cash or to find substitute purchasers, each Series 23 Share will be convertible at the option of the holder on the last business day of January, April, July and October in each year on 30 days’ notice into that number of freely-tradeable Common Shares determined by dividing $25.00 together with declared and unpaid dividends to the date of conversion, by the greater of $2.00 and 95% of the weighted average trading price of the Common Shares.

OK, is everybody clear on this? It’s important. The retraction date is 2011-7-31; it may therefore be assumed that the shares will be called at par 2011-7-30. So here’s the standard reasoning:

  • If retracted by the holders, the holders will receive common shares worth $26.04
  • Therefore, they will exercise their retraction privilege if the preferreds are trading at less than $26.04
  • The shares will only trade above $26.04 on the retraction date if the coupon is significantly higher than market yields at that time
  • If the coupon is significantly higher than the market yield, it will be in CM’s interest to call the issue.
  • It is in CM’s interest to avoid retraction, since they would much rather sell $26.04 worth of common for $26.04 rather than taking $25 face value of preferreds for it.
  • Therefore, it may be assumed that CM will call the issue – at the latest! – on the day prior to the holders getting the retraction privilege

It is possible to find fault with this logic – it’s not a mathematical theorum, for heaven’s sake – but the probability of a call at $25.00 is so overwhelmingly likely that any deviation from the scenario should be considered a bonus.

It should be noted that the very existence of this issue should be considered a bonus. Assiduous Reader adrian2 won a PrefLetter some time ago when I had a contest about the analysis of issues with a negative yield-to-worst. The explanation referred to ACO.PR.A, but it can be applied to anything.

Since CM.PR.A is currently callable at 25.25, it is clear that the market isn’t too worried about an immediate call and expects CM to hang on to the money for as long as possible.

But here’s the curious part – the cash flow analysis to the presumed maturity 2011-7-30:

2010-05-01 DIVIDEND 0.33 0.998579 0.33
2010-08-01 DIVIDEND 0.33 0.997453 0.33
2010-11-01 DIVIDEND 0.33 0.996328 0.33
2011-02-01 DIVIDEND 0.33 0.995205 0.33
2011-05-01 DIVIDEND 0.33 0.994120 0.33
2011-07-30 FINAL DIVIDEND 0.33 0.993023 0.32
2011-07-30 MATURITY 25.00 0.993023 24.83

There are only six more dividends payable prior to the presumed maturity at $25.00 and each dividend is for $0.33125 (rounded to 0.33 in the table above). Hence, the total cash flow expected from this issue is 26.9875 – not much higher than today’s prices.

In fact, when you perform a yield calculation for this issue, the yield until the 2011-7-30 softMaturity is 0.45%.

Let me repeat that:0.45%. And that’s the maximum. If it’s called earlier – like, for instance, 2010-10-31, the first day they can call at par – then the realized yield from today’s price will be less than this figure.

According to Canadian Bond Indices the 1.25% Canada bonds due June 1, 2011 are yielding 0.98%.

Now I’ve seen it all.

Update: Assiduous Reader BC writes in and says:

I periodically read the prefletter website and very much enjoy it. It is very useful and informative.

I have bought CM.PR.A although not above $26. In your Jan 6th posting you say CM ‘would much rather sell $26.04 worth of common for $26.04 rather than take $25 face value of the preferreds for it”

Before i bought i analyzed this risk and i think a factor your analysis might not take into account is that if CM goes to the market to sell common even if it is internally via CIBC WM they sill will pay commissions. Thus to me the analysis is not a straight $26.04 versus $25 but the $26.04 less their costs of issuance versus the $25.

With interest rates unlikely to go lower [ if that were even possible ] they might let the preferreds stay out there.

I think that at least makes the analysis more interesting. What do you think?

With respect to this specific situation, I will say that the annual dividend on this issue is $1.325, representing 5.3% of issue price – so this isn’t cheap money for them! I suggest that the only thing that has kept the issue alive so far is their desire to save the 25 cents per year in declining redemption price and that they will be overjoyed to redeem it on November 1 following their year-end.

More generally, the question of issuance costs is important – they are used in HIMIPref™ to adjust the probability of redemption calls in general. However, a 5% discount to market value is kind of steep, which is why it was set to 5% in the first place! Even accounting for issue costs, it is still cheaper for them to call CM.PR.A and issue something else.

But I would say the strongest argument against holding them is simply the fact that you have to indulge in these fancy analytics to justify the holding in the first place. There’s a fair bit of downside risk to these things that you need to minimize with arguments such as the above – there are less risky ways of making the same money.

Look at it from the holder’s perspective: after October 31, the call price finally drops to par and after 2011-7-31 it’s convertible to cheap common. Say it’s continuing to trade at $26.50. A holder has three choices:

  • Convert to common
  • Sell on the market
  • Hold

If he holds, he is risking a call at $25 at any time; lots of risk. Converting to common and locking in at least some of the premium is much more likely. Either way, the price of $26.50 is hard to justify.
January 5, 2010

Tuesday, January 5th, 2010

On December 31 I mentioned the scourge of windmill-promoting enviro-weenies. I now see there is a huge run to the trough in the UK:

The U.K. is targeting 15 percent of energy from renewable sources in 2020, of which 70 percent will have to come from offshore projects, according to the Carbon Trust.

The Crown Estate is seeking to add 25,000 megawatts in the third round, up from a combined 8,000 megawatts in the first rounds, and estimates potential market investment at 100 billion pounds. The U.K. has nine operating offshore farms with capacity of about 690 megawatts, enough for 400,000 homes, according to the British Wind Energy Association.

This disingenuous organization claims:

The BWEA Chief Executive rebutted claims about wind energy as ‘bizarre pseudo-science’, specifically she pointed out that:

  • •There is no Government subsidy for building wind farms. As much as £2 billion of private investment has been made in the UK wind industry.
  • •The support mechanism – Renewable Obligations Certificates (ROC) – is only available for electricity that wind farms have already produced and supplied to utilities
  • •In 30 years of monitoring there have been no days when the wind has not blown throughout the UK.
  • •Wind farms generate power for approximately 85% of the time.
  • •The wind supplies over 2 GW of electricity in the UK, which is 1.5% of UK electricity needs.

Point three is the most entertaining, although point one is most objectionable.

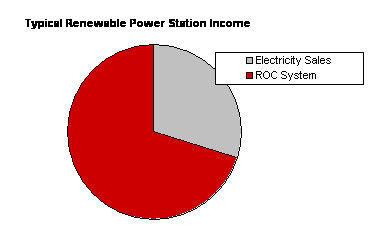
An organization called No Wind Farm At Parham did some credible calculations to determine the monetary value to the pseudo-industry of the ROC system:

Seventy percent is even more than the figure I calculated for Ontario, but it should be noted that the Ontario figure is only the headline number; I feel confident that a thorough investigation would reveal less honest subsidies.

Unfortunately, this is one of the (many) areas of modern politics in which the average interested citizen will never, ever hear a rational and informative debate. The vested interests have taken over – and when the trough is as full as it is, the piggies will defend it to the death.

Sorry for all this windmill news – just call me Don Quixote – but there’s not much of interest to report that is more directly relevant to fixed income! It’s not like last year at this time when news was, shall we say, somewhat more gripping. Besides, the windmill story was on Bloomberg, so there!

It was a happy day for preferred share owners, as Floaters continued their stunning ascent, PerpetualDiscounts gained 32bp and FixedResets gained 4bp (yields down to 3.52%!) on heavy volume.

HIMIPref™ Preferred Indices
These values reflect the December 2008 revision of the HIMIPref™ Indices

Values are provisional and are finalized monthly
Index Mean
Current
Yield
(at bid)
Median
YTW
Median
Average
Trading
Value
Median
Mod Dur
(YTW)
Issues Day’s Perf. Index Value
Ratchet 0.00 % 0.00 % 0 0.00 0 1.7255 % 1,664.2
FixedFloater 5.66 % 3.82 % 35,785 19.00 1 0.0000 % 2,750.7
Floater 2.36 % 2.71 % 102,725 20.50 3 1.7255 % 2,079.1
OpRet 4.82 % -6.28 % 114,965 0.09 13 -0.4208 % 2,324.6
SplitShare 6.39 % -2.63 % 188,084 0.08 2 0.0220 % 2,102.8
Interest-Bearing 0.00 % 0.00 % 0 0.00 0 -0.4208 % 2,125.7
Perpetual-Premium 5.75 % 5.64 % 148,669 5.94 12 0.0953 % 1,896.2
Perpetual-Discount 5.77 % 5.82 % 183,470 14.16 63 0.3224 % 1,816.9
FixedReset 5.38 % 3.52 % 318,140 3.84 41 0.0355 % 2,180.5
Performance Highlights
Issue Index Change Notes
BAM.PR.J OpRet -3.60 % YTW SCENARIO
Maturity Type : Soft Maturity
Maturity Date : 2018-03-30
Maturity Price : 25.00
Evaluated at bid price : 26.22
Bid-YTW : 4.72 %
BMO.PR.J Perpetual-Discount -1.75 % YTW SCENARIO
Maturity Type : Limit Maturity
Maturity Date : 2040-01-05
Maturity Price : 20.75
Evaluated at bid price : 20.75
Bid-YTW : 5.50 %
BMO.PR.K Perpetual-Discount 1.06 % YTW SCENARIO
Maturity Type : Limit Maturity
Maturity Date : 2040-01-05
Maturity Price : 23.56
Evaluated at bid price : 23.75
Bid-YTW : 5.60 %
ELF.PR.G Perpetual-Discount 1.20 % YTW SCENARIO
Maturity Type : Limit Maturity
Maturity Date : 2040-01-05
Maturity Price : 17.72
Evaluated at bid price : 17.72
Bid-YTW : 6.74 %
IAG.PR.A Perpetual-Discount 1.86 % YTW SCENARIO
Maturity Type : Limit Maturity
Maturity Date : 2040-01-05
Maturity Price : 19.70
Evaluated at bid price : 19.70
Bid-YTW : 5.89 %
BAM.PR.B Floater 2.25 % YTW SCENARIO
Maturity Type : Limit Maturity
Maturity Date : 2040-01-05
Maturity Price : 14.57
Evaluated at bid price : 14.57
Bid-YTW : 2.71 %
BAM.PR.K Floater 2.59 % YTW SCENARIO
Maturity Type : Limit Maturity
Maturity Date : 2040-01-05
Maturity Price : 14.26
Evaluated at bid price : 14.26
Bid-YTW : 2.77 %
Volume Highlights
Issue Index Shares
Traded
Notes
BAM.PR.P FixedReset 193,631 Nesbitt crossed three blocks at 27.25, of 100,000 shares, 25,000 shares and 20,000 shares.
YTW SCENARIO
Maturity Type : Call
Maturity Date : 2014-10-30
Maturity Price : 25.00
Evaluated at bid price : 27.20
Bid-YTW : 4.99 %
RY.PR.A Perpetual-Discount 145,994 RBC crossed 42,700 at 20.25.
YTW SCENARIO
Maturity Type : Limit Maturity
Maturity Date : 2040-01-05
Maturity Price : 20.25
Evaluated at bid price : 20.25
Bid-YTW : 5.57 %
GWO.PR.J FixedReset 140,959 RBC crossed blocks of 75,000 and 35,000 at 27.29, then one of 30,800 at 27.30.
YTW SCENARIO
Maturity Type : Call
Maturity Date : 2014-01-30
Maturity Price : 25.00
Evaluated at bid price : 27.32
Bid-YTW : 3.56 %
GWO.PR.H Perpetual-Discount 126,104 RBC crossed three blocks at 20.70: one of 15,700, one of 83,600 and the last of 16,400 shares.
YTW SCENARIO
Maturity Type : Limit Maturity
Maturity Date : 2040-01-05
Maturity Price : 20.61
Evaluated at bid price : 20.61
Bid-YTW : 5.93 %
PWF.PR.H Perpetual-Discount 111,760 Desjardins crossed two blocks of 50,000 each at 24.65.
YTW SCENARIO
Maturity Type : Limit Maturity
Maturity Date : 2040-01-05
Maturity Price : 24.14
Evaluated at bid price : 24.52
Bid-YTW : 5.96 %
MFC.PR.B Perpetual-Discount 97,227 Nesbitt crossed 13,000 at 20.00, while RBC crossed 75,000 at 20.15.
YTW SCENARIO
Maturity Type : Limit Maturity
Maturity Date : 2040-01-05
Maturity Price : 20.00
Evaluated at bid price : 20.00
Bid-YTW : 5.88 %
There were 50 other index-included issues trading in excess of 10,000 shares.