Archive for January, 2011

SEC Entrenches Selective Disclosure

Sunday, January 9th, 2011

The Securities and Exchange Commission spent 2010 busily entrenching the practice of selective disclosure with respect to the credit quality of investible intruments.

In 17 CFR Parts 240 and 243 “Amendments to Rules for Nationally Recognized Statistical Rating Organizations”:

Under the re-proposed amendments: (1) NRSROs that are hired by arrangers to perform credit ratings for structured finance products would have been required to disclose on a password-protected Internet Web site the deals for which they have been hired and provide access to that site to non-hired NRSROs that have furnished the Commission with the certification described below; (2) NRSROs that are hired by arrangers to perform credit ratings for structured finance products would have been required to obtain representations from those arrangers that the arranger would provide information given to the hired NRSRO to non-hired NRSROs that have furnished the Commission with the certification described below as well; and (3) NRSROs seeking to access information maintained by the NRSROs and the arrangers pursuant to the new rule would have been required to furnish the Commission an annual certification that they are accessing the information solely to determine credit ratings and would determine a minimum number of credit ratings using the information.

So the SEC acknowledges – and, in fact, emphasizes – that it is difficult, if not impossible, to asset the credit quality of a structured-finance instrument without acess to material non-public information.

Currently, when an NRSRO is hired to rate a structured finance product, some of the information it relies on to determine the rating is generally not made public. As a result, structured finance products frequently are issued with ratings from only one or two NRSROs that have been hired by the arranger, with the attendant conflict of interest that creates. The amendments to Rule 17g-5 are designed to increase the number of credit ratings extant for a given structured finance product and, in particular, to promote the issuance of credit ratings by NRSROs that are not hired by the arranger. This will provide users of credit ratings with more views on the creditworthiness of the structured finance product. In addition, the amendments are designed to reduce the ability of arrangers to obtain better than warranted ratings by exerting influence over NRSROs hired to determine credit ratings for structured finance products. Specifically, opening up the rating process to more NRSROs will make it easier for the hired NRSRO to resist such pressure by increasing the likelihood that any steps taken to inappropriately favor the arranger could be exposed to the market through the credit ratings issued by other NRSROs.

… and only NRSROs are granted access to that information. Investors (or “Investor Scum”, as I believe they are generally known to regulators) must be made dependent upon NRSROs for assessments of credit quality – this will, of course, make it easier to blame them for that dependence when – as will inevitably happen in a competitive economy – things go pear-shaped.

Later, in an exemption to address extra-territoriality the SEC repeated:

Rule 17g-5(a)(3), among other things, requires that the NRSRO must:

  • Maintain on a password-protected Internet Web site a list of each structured finance product for which it currently is in the process of determining an initial credit rating in chronological order and identifying the type of structured finance product, the name of the issuer, the date the rating process was initiated, and the Internet Web site address where the arranger represents the information provided to the hired NRSRO can be accessed by other NRSROs;
  • Provide free and unlimited access to such password-protected Internet Web site during the applicable calendar year to any NRSRO that provides it with a copy of the certification described in paragraph (e) of Rule 17g-5 that covers that calendar year;12 and
  • Obtain from the arranger a written representation that can reasonably be relied upon that the arranger will, among other things, disclose on a password-protected Internet web site the information it provides to the hired NRSRO to determine the initial credit rating (and monitor that credit rating) and provide access to the web site to an NRSRO that provides it with a copy of the certification described in paragraph (e) Rule 17g-5.13

… and DBRS confirms that every single particle of information that they use to rate structured finance wil be on these semi-seqret websites:

To ensure compliance with the Representation Agreement, DBRS requests the Arranger not provide new information orally to DBRS. Rather, the Arranger should post all new information on its website at the same time as it provides it to DBRS. Discussions between the Arranger and DBRS about the application of DBRS methodologies that do not relate to a transaction or a potential transaction would not need to be posted.

I have long argued that Regulation FD (and the corresponding Canadian National Policy 51-201) must be repealed; instead, it is being entrenched. One wonders when the first scandal regarding leakage of passwords will occur.

QE2 and Inflation

Saturday, January 8th, 2011

The Federal Reserve Board of St. Louis has published an article by Richard G. Anderson, Charles S. Gascon, and Yang Liu titled Doubling Your Monetary Base and Surviving: Some International Experience:

The authors examine the experience of selected central banks that have used large-scale balancesheet expansion, frequently referred to as “quantitative easing,” as a monetary policy instrument. The case studies focus on central banks responding to the recent financial crisis and Nordic central banks during the banking crises of the 1990s; others are provided for comparison purposes. The authors conclude that large-scale balance-sheet increases are a viable monetary policy tool provided the public believes the increase will be appropriately reversed.

The authors review current and past examples of central bank balance sheet expansion and conclude:

During the past two decades, large increases — and decreases — in central bank balance sheets have become a viable monetary policy tool. Historically, doubling or tripling a country’s monetary base was a recipe for certain higher inflation. Often such increases occurred only as part of a failed fiscal policy or, perhaps, as part of a policy to defend the exchange rate. Both economic models and central bank experience during the past two decades suggest that such changes are useful policy tools if the public understands the increase is temporary and if the central bank has some credibility with respect to desiring a low, stable rate of inflation. We find little increased inflation impact from such expansions.

For monetary policy, our study suggests several findings:

  • (i) A large increase in a nation’s balance sheet over a short time can be stimulative.
  • (ii) The reasons for the action should be communicated. Inflation expectations do not move if households and firms understand the reason(s) for policy actions so long as the central bank can credibly commit to unwinding the expansion when appropriate.
  • (iii) The type of assets purchased matters less than the balance-sheet expansion.
  • (iv) When the crisis has passed, the balance sheet should be unwound promptly.

Econbrowser’s James Hamilton has presented a review of QE2 and concludes:

I agree with John that the primary effects of QE2 come from restructuring the maturity of government debt, and that any effects one claims for such a move are necessarily modest. But unlike John, I believe those modest effects are potentially helpful.

Just to reiterate, my position is that when you combine the Fed’s actions with the Treasury’s, the net effect has been a lengthening rather than shortening of the maturity structure:

given the modest size, pace, and focus of QE2, and given the size and pace at which the Treasury has been issuing long-term debt, the announced QE2 would have been associated with a move in the maturity structure of the opposite direction from that analyzed in our original research. The effects of the combined actions by the Treasury and the Fed would be to increase rather than decrease long-term interest rates.

He has also noted the effects on commodity prices:

I feel that there is a pretty strong case for interpreting the recent surge in commodity prices as a monetary phenomenon. Now that we know there’s a response when the Fed pushes the QE pedal, the question is how far to go.

My view has been that the Fed needs to prevent a repeat of Japan’s deflationary experience of the 1990s, but that it also needs to watch commodity prices as an early indicator that it’s gone far enough in that objective. In terms of concrete advice, I would worry about the potential for the policy to do more harm than good if it results in the price of oil moving above $90 a barrel.

And we’re uncomfortably close to that point already.

Oil is now over USD 90/bbl.

Another effect I haven’t seen discussed much is a reversal of crowding-out:

Company bond sales in the U.S. reached a record this week and relative yields on investment- grade debt shrank to the narrowest since May as money managers boosted bets economic growth is gaining momentum.

Issuance soared to $48.5 billion, eclipsing the $46.9 billion raised in the week ended May 8, 2009, as General Electric Co.’s finance unit sold $6 billion of notes in the largest offering in 11 months, according to data compiled by Bloomberg. Investment-grade bond spreads narrowed to 162 basis points, or 1.62 percentage points, more than Treasuries, Bank of America Merrill Lynch index data show.

Appetite for corporate debt is growing after annual sales topped $1 trillion for the second consecutive year as the securities return more than Treasuries.

Foreign borrowers dominated U.S. sales this week, with companies from Sydney-based Macquarie Group Ltd. to the U.K.’s Barclays Plc accounting for 57 percent of the total, Bloomberg data show.

“The expectation coming into this year was that Yankee issuance would be heavy,” said Jim Probert, managing director and head of investment grade capital markets at Bank of America Merrill Lynch. “There’s enough maturing debt coming out of European financials in particular that they needed to be in the marketplace, and right now, U.S. dollars is a good alternative, in addition to euros.”

Meanwhile, Janet L. Yellen, the Fed’s Vice-Chair, has delivered a speech titled The Federal Reserve’s Asset Purchase Program:

As inflation has trended downward, measures of underlying inflation have fallen somewhat below the levels of about 2 percent or a bit less that most Committee participants judge to be consistent, over the longer run, with the FOMC’s dual mandate. In particular, a modest positive rate of inflation over time allows for a slightly higher average level of nominal interest rates, thereby creating more scope for the FOMC to respond to adverse shocks. A modest positive inflation rate also reduces the risk that such shocks could result in deflation, which can be associated with poor macroeconomic performance.

Figure 3 depicts the results of such a simulation exercise, as reported in a recent research paper by four Federal Reserve System economists. For illustrative purposes, the simulation imposes the assumption that the purchases of $600 billion in longer-term Treasury securities are completed within about a year, that the elevated level of securities holdings is then maintained for about two years, and that the asset position is then unwound linearly over the following five years.

This trajectory of securities holdings causes the 10-year Treasury yield to decline initially about 1/4 percentage point and then gradually return toward baseline over subsequent years. That path of longer-term Treasury yields leads to a significant pickup in real gross domestic product (GDP) growth relative to baseline and generates an increase in nonfarm payroll employment that amounts to roughly 700,000 jobs.

Inflation and bank reserves. A second reason that some observers worry that the Fed’s asset purchase programs could raise inflation is that these programs have increased the quantity of bank reserves far above pre-crisis levels. I strongly agree with one aspect of this argument–the notion that an accommodative monetary policy left in place too long can cause inflation to rise to undesirable levels. This notion would be true regardless of the level of bank reserves and pertains as well in situations in which monetary policy is unconstrained by the zero bound on interest rates. Indeed, it is one reason why the Committee stated that it will review its asset purchase program regularly in light of incoming information and adjust the program as needed to meet its objectives. We recognize that the FOMC must withdraw monetary stimulus once the recovery has taken hold and the economy is improving at a healthy pace. Importantly, the Committee remains unwaveringly committed to price stability and does not seek inflation above the level of 2 percent or a bit less than that, which most FOMC participants see as consistent with the Federal Reserve’s mandate.

The research paper referenced in conjunction with Figure 3 is Have We Underestimated the Likelihood and Severity of Zero Lower Bound Events? by Hess Chung, Jean-Philippe Laforte, David Reifschneider and John C. Williams:

Before the recent recession, the consensus among researchers was that the zero lower bound (ZLB) probably would not pose a significant problem for monetary policy as long as a central bank aimed for an inflation rate of about 2 percent; some have even argued that an appreciably lower target inflation rate would pose no problems. This paper reexamines this consensus in the wake of the financial crisis, which has seen policy rates at their effective lower bound for more than two years in the United States and Japan and near zero in many other countries. We conduct our analysis using a set of structural and time series statistical models. We find that the decline in economic activity and interest rates in the United States has generally been well outside forecast confidence bands of many empirical macroeconomic models. In contrast, the decline in inflation has been less surprising. We identify a number of factors that help to account for the degree to which models were surprised by recent events. First, uncertainty about model parameters and latent variables, which were typically ignored in past research, significantly increases the probability of hitting the ZLB. Second, models that are based primarily on the Great Moderation period severely understate the incidence and severity of ZLB events. Third, the propagation mechanisms and shocks embedded in standard DSGE models appear to be insufficient to generate sustained periods of policy being stuck at the ZLB, such as we now observe. We conclude that past estimates of the incidence and effects of the ZLB were too low and suggest a need for a general reexamination of the empirical adequacy of standard models. In addition to this statistical analysis, we show that the ZLB probably had a first-order impact on macroeconomic outcomes in the United States. Finally, we analyze the use of asset purchases as an alternative monetary policy tool when short-term interest rates are constrained by the ZLB, and find that the Federal Reserve’s asset purchases have been effective at mitigating the economic costs of the ZLB. In particular, model simulations indicate that the past and projected expansion of the Federal Reserve’s securities holdings since late 2008 will lower the unemployment rate, relative to what it would have been absent the purchases, by 1½ percentage points by 2012. In addition, we find that the asset purchases have probably prevented the U.S. economy from falling into deflation.
Adverse Selection, Liquidity and Market Breakdown

Saturday, January 8th, 2011

The Bank of Canada has released a working paper by Koralai Kirabaeva titled Adverse Selection, Liquidity, and Market Breakdown:

This paper studies the interaction between adverse selection, liquidity risk and beliefs about systemic risk in determining market liquidity, asset prices and welfare. Even a small amount of adverse selection in the asset market can lead to fire-sale pricing and possibly to a market breakdown if it is accompanied by a flight-to-liquidity, a misassessment of systemic risk, or uncertainty about asset values. The ability to trade based on private information improves welfare if adverse selection does not lead to a market breakdown. Informed trading allows financial institutions to reduce idiosyncratic risks, but it exacerbates their exposure to systemic risk. Further, I show that in a market equilibrium, financial institutions overinvest into risky illiquid assets (relative to the constrained efficient allocation), which creates systemic externalities. Also, I explore possible policy responses and discuss their effectiveness.

He makes the point (tangentially) that the Efficient Market Hypothesis is dependent, in part, on an assumption of infinite liquidity:

Market liquidity is characterized by the cost (in terms of the foregone payo¤) of selling a long-term asset before its maturity.1 Two factors contribute to illiquidity in the market:a shortage of safe assets and adverse selection (characterized by the fraction of low quality assets in the market). On one hand, market liquidity depends on the amount of the safe asset held by investors that is available to buy risky assets from liquidity traders. Following the Allen and Gale ([9], [11]) “cash-in-the-market” framework, the market price is determined by the lesser of the following two amounts: expected payo¤ and the amount of the safe asset available from buyers per unit of assets sold. Therefore, this “cash-in-the-market” pricing may lead to market prices below fundamentals if there is not enough cash (safe assets) to absorb asset trades. On the other hand, market liquidity depends on the quality of assets traded in the market. In particular, adverse selection can cause market illiquidity if assets sold in the market are likely to be of low quality (as in Eisfeldt [25]).

He also explicitly considers liquidity risk as part of his model:

The long-term investment is risky not only because of its uncertain quality but also because of the cost associated with its premature liquidation or sale. Therefore, investors are exposed to the market liquidity risk through their holding of long-term assets. Holdings of the safe asset provide partial insurance against the possibility of a liquidity shock as well as against low asset quality realizations. In addition to the value as means of storage, the safe asset has value as means for reallocating risky assets from investors who have experienced a liquidity shock to those who have not. This is similar to the concept of liquidity value for ability to transfer resources in Kiyotaki and Moore [35].

In the course of determining the implications of his model the author examines the relative roles of private information and liquidity:

As a benchmark, I examine portfolio choice when investors have private information about their investment quality but the identity of investors hit by a liquidity shock is public information. Then I analyze the situation when the investor’s type (both liquidity needs and asset quality) is private information. In the latter case investors can take advantage of their private information by selling the low-payo¤ investments and keeping the high quality ones. This generates the lemons problem: buyers do not know whether an asset is sold because of its low quality or because the seller experienced a sudden need for liquidity.

His playing with the model leads to policy recommendations:

There are policy implications for government interventions during a crisis as well as for preemptive policy regulations. The e¤ectiveness of policy responses during crises depends on which ampli…cation e¤ect contributes to a market breakdown. If it is due to an increase in liquidity preferences or to a small probability of the crisis then liquidity provision can restore the trading. However, if the no-trade outcome is caused by a large fraction of lemons or by the Knightian uncertainty about it, then it is more e¤ective to remove these low quality assets from the market. The preemptive policy response is an ex-ante requirement of larger liquidity holdings, which prevents market breakdowns during crises, especially if the economy is in the multiple equilibria range.

This last point is presumably part of the intellectual underpinnings of the Global Liquidity Standard in Basel III: A global regulatory framework for more resilient banks and banking systems. Other elements of this standard were discussed in the post Basel III.

He also provides intellectual underpinnings for a tax (deposit insurance premia?) on risky assets:

It should be noted that there is a moral hazard problem associated with government interventions during crises. If market participants anticipate government interventions then the optimal holdings of risky assets are larger. Therefore, a larger intervention is required. The moral hazard problem can be corrected if the liquidity provision at date t = 1 is …nanced by a tax τ per unit of investment, which is imposed at date t = 0. The tax τx should be equal to the amount of liquidity λ that is required to restore market price to the level of p2,

[formula]

Imposing such tax increases liquidity holdings at t = 0 and prevents market breakdowns at t = 1, leading to a higher expected utility

I find it very disappointing that the author only examines a broad tax on risky holdings at time t=0. It would be more in line with the traditional role of a central bank to determine – given plausible assumptions – the required penalty rate for liquidity provision that would optimize welfare. Additionally, the welfare cost of a higher amount of liquid holdings is not addressed. And finally, investors – and the government – are assumed to know with perfect foresight which holdings are “risky” and which holdings are “liquid”. Holders of long-term Greek government bonds might be forgiven for questioning this assumption!

This last point is acknowledged by the author in his discussion of the Panic of 2007:

Financial institutions were exposed to systemic risk through securities holdings which had skewed payo¤s: they produced high returns in normal times but incurred substantial losses during the crisis. Before the crisis, many of these created securities were rated AAA, which implied a minimal risk of default. In particular, these assets were considered very liquid: if needed, these securities could be sold at a fair market price. During the crisis, the value of securities became more sensitive to private information.

January 7, 2011

Friday, January 7th, 2011

Willem Buiter of Citibank is predicting a bail-out of Portugal:

“Now that the Irish government has reached an agreement with the EU/IMF on a financial support package and associated conditionality, the market’s attention will turn to Portugal, whose sovereign, at current levels of interest rates and growth rates, we judge to be less dramatically, but quietly insolvent,” Buiter wrote in a research note Friday.

“We consider it likely that Portugal, too, will need to access the EFSF/EFSM soon.” Buiter said.

Buiter said the current size of the liquidity facilities in place within the European Union is sufficient to deal with another speculative attack or as he puts it “even fund Spain completely for three years”

I don’t normally report brokerage analysis on considerations of quality – but I was quoting Buiter before he got the cushy job, so why not?

But Portugal’s not shut out just yet:

The Portuguese government issued 1 billion euros ($1.29 billion) of 2.5-year notes through a private placement as the nation seeks to narrow its budget gap.

Portugal sold zero-coupon debt due July 2012 in a transaction led by Deutsche Bank AG, according to data compiled by Bloomberg. The Finance Ministry confirmed the medium-term note offering in an e-mail today without providing more details.

Portugal sold 500 million euros of six-month bills on Jan. 5, according to the country’s debt agency. The yield on the bills jumped to 3.686 percent from 2.045 percent at a sale of similar-maturity securities in September. A year ago, the country paid just 0.592 percent to borrow for six months.

The FDIC’s attempt to risk-weight deposit insurance premia, discussed in the post FDIC Addresses Systemic Risk is having some interesting knock-on effects:

Increased FDIC fees may cut into banks’ interest income and drive money market rates lower, the strategists said. The volume weighted average for overnight fed funds, the so-called effective rate, may slide by as much as 0.1 percentage point if the FDIC change is implemented, according to Wrightson ICAP LLC, a Jersey City, New Jersey research unit of ICAP Plc.

Even lower short-term interest rates will potentially make it even harder for the $2.8 trillion money-market fund industry to retain customer assets. The FDIC changes will add to catalysts for lower money-market rates, chiefly the Fed siphoning of about $1 trillion in Treasuries from the market through its debt purchases by June, according to New-York based Brian Smedley, a strategist at Bank of America Merrill Lynch, a unit of Bank of America Corp.

“The Fed will likely achieve lower short-term rates even without lowering the 25 basis points it currently pays on banks’ excess reserve balances,” said Smedley, a former senior trader at the Federal Reserve Bank of New York. With short-term interest rates likely to decline this year, “it will make money- market mutual fund managers lives more difficult and could lead to further consolidation of the industry.”

Deborah Cunningham, chief investment officer in Pittsburgh for taxable money markets at Federated Investors Inc., which manages more than $336 billion in money-market investments, said a fall in overnight rates would at most be only about five basis points and wouldn’t be sufficient to speed any consolidation of the money-fund industry.

OSFI reports that Jean-Claude Ménard, Chief Actuary, gave a speech on mortality and the CPP:

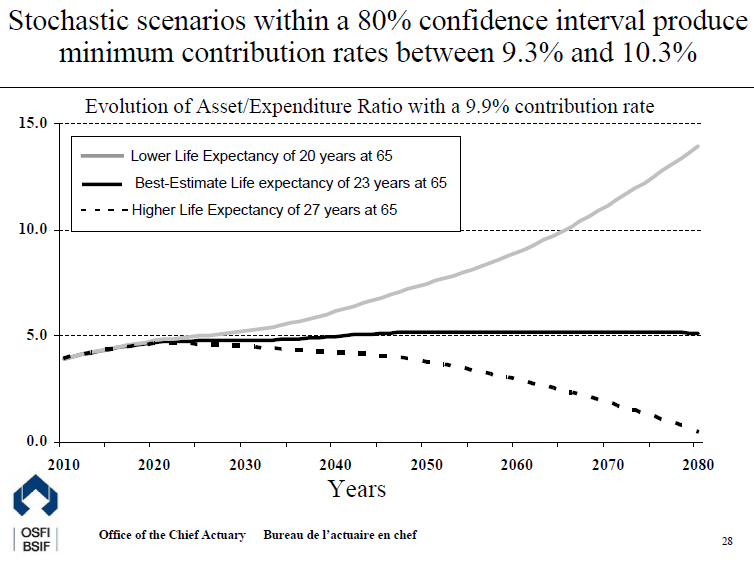
The actuarial report on the Canada Pension Plan is based on the projection of its revenues and expenditures over a long period of time. Under a set of best-estimate assumptions, the most recent actuarial report confirms that the legislated contribution rate of 9.9% is sufficient to pay future expenditures and accumulate assets of $275 billion in 2020, or 4.7 times the expenditures. Having said that, both the length of the projection period and the number of assumptions required ensure that actual future experience will not develop precisely in accordance with the best-estimate assumptions. For the second time, in the most recent actuarial reports, many of the sensitivity tests are determined based on stochastic modeling techniques that estimate the probability distribution of the outcome for each of the main assumptions.

This chart shows the evolution of the asset to expenditure ratio under three scenarios: the best-estimate assumption and the two stochastically determined scenarios based on a 80% confidence interval. The result is that the minimum contribution rate required to finance the plan over a 75-year period could fall between 9.3% and 10.3%.


Click for big

It was a relatively quiet, but nevertheless profitable day on the Canadian preferred share market, with PerpetualDiscounts up 10bp and FixedResets gaining 5bp on average volume.

HIMIPref™ Preferred Indices
These values reflect the December 2008 revision of the HIMIPref™ Indices

Values are provisional and are finalized monthly
Index Mean
Current
Yield
(at bid)
Median
YTW
Median
Average
Trading
Value
Median
Mod Dur
(YTW)
Issues Day’s Perf. Index Value
Ratchet 0.00 % 0.00 % 0 0.00 0 0.1230 % 2,318.4
FixedFloater 4.81 % 3.54 % 28,332 18.91 1 0.0000 % 3,497.2
Floater 2.58 % 2.37 % 45,052 21.28 4 0.1230 % 2,503.2
OpRet 4.80 % 3.34 % 62,055 2.33 8 -0.1681 % 2,393.7
SplitShare 5.34 % 1.62 % 657,951 0.92 4 -0.1658 % 2,449.1
Interest-Bearing 0.00 % 0.00 % 0 0.00 0 -0.1681 % 2,188.9
Perpetual-Premium 5.66 % 5.27 % 122,584 5.06 20 0.0848 % 2,025.1
Perpetual-Discount 5.42 % 5.45 % 230,981 14.75 57 0.0987 % 2,040.7
FixedReset 5.24 % 3.44 % 292,058 3.09 52 0.0476 % 2,270.7
Performance Highlights
Issue Index Change Notes
GWO.PR.F Perpetual-Premium -1.71 % YTW SCENARIO
Maturity Type : Call
Maturity Date : 2012-10-30
Maturity Price : 25.00
Evaluated at bid price : 25.31
Bid-YTW : 5.27 %
GWO.PR.L Perpetual-Discount -1.21 % YTW SCENARIO
Maturity Type : Limit Maturity
Maturity Date : 2041-01-07
Maturity Price : 24.29
Evaluated at bid price : 24.50
Bid-YTW : 5.80 %
RY.PR.H Perpetual-Premium 1.01 % YTW SCENARIO
Maturity Type : Call
Maturity Date : 2017-06-23
Maturity Price : 25.00
Evaluated at bid price : 26.06
Bid-YTW : 5.03 %
HSB.PR.C Perpetual-Discount 1.03 % YTW SCENARIO
Maturity Type : Limit Maturity
Maturity Date : 2041-01-07
Maturity Price : 23.25
Evaluated at bid price : 23.50
Bid-YTW : 5.46 %
PWF.PR.P FixedReset 2.66 % YTW SCENARIO
Maturity Type : Limit Maturity
Maturity Date : 2041-01-07
Maturity Price : 25.05
Evaluated at bid price : 25.10
Bid-YTW : 4.04 %
Volume Highlights
Issue Index Shares
Traded
Notes
BNS.PR.Q FixedReset 114,493 RBC crossed 14,500 at 26.10. TD crossed blocks of 57,200 and 25,000 at the same price.
YTW SCENARIO
Maturity Type : Call
Maturity Date : 2013-11-24
Maturity Price : 25.00
Evaluated at bid price : 26.06
Bid-YTW : 3.28 %
TD.PR.I FixedReset 109,620 Nesbitt crossed 99,300 at 27.35.
YTW SCENARIO
Maturity Type : Call
Maturity Date : 2014-08-30
Maturity Price : 25.00
Evaluated at bid price : 27.35
Bid-YTW : 3.41 %
TD.PR.A FixedReset 67,900 TD crossed 60,000 at 26.25.
YTW SCENARIO
Maturity Type : Call
Maturity Date : 2014-03-02
Maturity Price : 25.00
Evaluated at bid price : 26.20
Bid-YTW : 3.24 %
TD.PR.K FixedReset 64,200 RBC crossed 56,300 at 27.45.
YTW SCENARIO
Maturity Type : Call
Maturity Date : 2014-08-30
Maturity Price : 25.00
Evaluated at bid price : 27.45
Bid-YTW : 3.31 %
SLF.PR.B Perpetual-Discount 49,944 Desjardins bought 37,000 from RBC at 22.20.
YTW SCENARIO
Maturity Type : Limit Maturity
Maturity Date : 2041-01-07
Maturity Price : 21.82
Evaluated at bid price : 22.17
Bid-YTW : 5.44 %
BNS.PR.T FixedReset 25,885 TD crossed 25,000 at 27.35.
YTW SCENARIO
Maturity Type : Call
Maturity Date : 2014-05-25
Maturity Price : 25.00
Evaluated at bid price : 27.30
Bid-YTW : 3.29 %
There were 26 other index-included issues trading in excess of 10,000 shares.

January 6, 2011

Thursday, January 6th, 2011

On December 14 I highlighted Hoenig’s dissent from the FOMC decision and speculated:

It occurs to me that Mr. Hoenig is being used – probably with his enthusiastic cooperation – as a straw man. The Fed wants to send an explicit signal that they’ve thought about this, discussed this and reached a concensus to reject this. There’s no shortage of blogs out there claiming hyperinflation is imminent! Given the increased public discussion of economic data, with various levels of competence, one wonders if more public pronouncements by governments and their agencies will set up straw men in their releases and recognize that forecasts are necessarily imprecise.

Hoenig has delivered a speech on the topic, titled Monetary policy and the role of dissent:

Based on audience questions, news coverage and pundit columns throughout the year, it has become obvious to me that the role of dissent in the FOMC is misunderstood and viewed without context. The idea that a dissenting vote is confusing, counterproductive, and generally undesirable is unhealthy. It is also historically inaccurate.

In my remaining time today, I will discuss why dissenting views at the FOMC are critical to the success of the Federal Reserve System and that public debate was the intent of its congressional founders. I will also describe how open debate and dissent are fundamental to achieving transparency of FOMC deliberations and to supporting the credibility of the committee in difficult economic times.
..
As an economist, I cannot be certain that my views are correct. Certainly, a majority of my counterparts on the FOMC last year did not agree with my views. But it is important to recognize that in the face of uncertainty, arriving at the best policy decision is built on divergent opinions and vigorous debate.

Because of this, the role of open dissent is at least as critical to FOMC monetary policy decisions as it is to deliberations by the Supreme Court, the United States Congress or any other body with important public responsibilities from the local through the federal level. If you find it unusual to consider the FOMC as being similar to these other deliberative bodies, it is perhaps because many–including some former Federal Reserve officials–tend to speak of Fed policy as being done by a single actor.

A deliberative body does not gain credibility by concealing dissent when decision making is most difficult. In fact, credibility is sacrificed as those on the outside realize that unanimity – difficult in any environment – simply may not be a reasonable expectation when the path ahead is the most confounding.

As for me, I recognize that the committee’s majority might be correct. In fact, I hope that it is. However, I have come to my policy position based on my experience, current data and economic history. If I had failed to express my views with my vote, I would have failed in my duty to you and to the committee.

In these days of political obsession with staying “on message”, and puerile voters who want a simple story just like mommy used to tell them, Hoenig’s expression of his views is rather refreshing!

Contingent Capital as a concept has often been criticized on the basis that it might be difficult to sell – but banks have been selling this type of issue with gusto:

Barclays Plc, based in London, and UBS AG in Zurich led more than a dozen banks selling reverse convertibles, which are short-term bonds generally marketed to individuals that convert into stock if a company’s share price plummets.

Structured note sales rose 46 percent last year to a record $49.4 billion in the U.S., Bloomberg data show. The securities fed demand from individual investors frustrated with record low rates on everything from certificates of deposit to money market funds with the Federal Reserve holding its target interest rate for overnight loans between banks in a range of zero to 0.25 percent since 2008. Banks issued $33.9 billion in 2009, according to StructuredRetailProducts.com, a database used by the industry.

Royal Bank of Scotland Group Plc sold $1.15 million in three-month notes tied to Rochester, New York-based Eastman Kodak Co. on June 10 that paid 24 percent annualized interest, a filing with the U.S. Securities and Exchange Commission shows. That’s 24 times the average rate on one-year certificates of deposit, according to data from Bankrate Inc. in North Palm Beach, Florida.

Buyers couldn’t lose money unless shares of the camera maker fell to below $3.54 from $5.06. Kodak dropped to $3.50 on Aug. 31 in New York trading. RBS converted the bonds into stock and investors lost about 18 percent even with the high interest rate.

I will admit, however, that the perpetual nature of Contingent Capital is another difficulty in flogging it.

Regular debt is selling pretty well, too!

Company bond sales in the U.S. surged to the most on record this week and relative yields on investment-grade debt shrank to the narrowest since May as investors boosted bets that economic growth is gaining momentum.

Issuance soared to $48.2 billion, eclipsing the $46.9 billion raised in the week ended May 8, 2009, as General Electric Co.’s finance unit sold $6 billion of notes in the largest sale in 11 months, according to data compiled by Bloomberg. Investment-grade bond spreads narrowed to 162 basis points, or 1.62 percentage points, the tightest since May 4, 2010, Bank of America Merrill Lynch index data show.

Investors’ appetite for company debt is growing even after annual sales topped $1 trillion for the second consecutive year as the securities outperform Treasuries.

Offerings from foreign borrowers dominated U.S. sales this week, with transactions by companies from Sydney-based Macquarie Group Ltd. to the U.K.’s Barclays Plc accounting for 57 percent of the total, Bloomberg data show. Relative yields on U.S. corporate bonds became narrower than those on company debt worldwide last month for the first time on record, Bank of America Merrill Lynch index data show.

The Canadian preferred share market had a good day on average volume, with PerpetualDiscounts gaining 21bp and FixedResets up 10bp. Sun Life PerpetualDiscounts saw some good volume.

HIMIPref™ Preferred Indices
These values reflect the December 2008 revision of the HIMIPref™ Indices

Values are provisional and are finalized monthly
Index Mean
Current
Yield
(at bid)
Median
YTW
Median
Average
Trading
Value
Median
Mod Dur
(YTW)
Issues Day’s Perf. Index Value
Ratchet 0.00 % 0.00 % 0 0.00 0 0.1725 % 2,315.5
FixedFloater 4.81 % 3.54 % 29,489 18.92 1 0.0442 % 3,497.2
Floater 2.58 % 2.37 % 46,908 21.28 4 0.1725 % 2,500.1
OpRet 4.80 % 3.33 % 64,571 2.33 8 -0.1142 % 2,397.8
SplitShare 5.33 % 1.30 % 668,053 0.92 4 0.2620 % 2,453.2
Interest-Bearing 0.00 % 0.00 % 0 0.00 0 -0.1142 % 2,192.5
Perpetual-Premium 5.66 % 5.28 % 124,399 5.21 20 0.1087 % 2,023.4
Perpetual-Discount 5.42 % 5.48 % 232,597 14.72 57 0.2055 % 2,038.7
FixedReset 5.24 % 3.41 % 297,153 3.09 52 0.1036 % 2,269.7
Performance Highlights
Issue Index Change Notes
PWF.PR.P FixedReset -2.70 % YTW SCENARIO
Maturity Type : Limit Maturity
Maturity Date : 2041-01-06
Maturity Price : 24.40
Evaluated at bid price : 24.45
Bid-YTW : 4.15 %
TRP.PR.B FixedReset -1.63 % YTW SCENARIO
Maturity Type : Limit Maturity
Maturity Date : 2041-01-06
Maturity Price : 24.69
Evaluated at bid price : 24.74
Bid-YTW : 3.76 %
FTS.PR.F Perpetual-Discount -1.52 % YTW SCENARIO
Maturity Type : Limit Maturity
Maturity Date : 2041-01-06
Maturity Price : 22.58
Evaluated at bid price : 22.75
Bid-YTW : 5.45 %
HSB.PR.D Perpetual-Discount 1.04 % YTW SCENARIO
Maturity Type : Limit Maturity
Maturity Date : 2041-01-06
Maturity Price : 23.03
Evaluated at bid price : 23.25
Bid-YTW : 5.41 %
PWF.PR.I Perpetual-Premium 1.08 % YTW SCENARIO
Maturity Type : Call
Maturity Date : 2011-05-30
Maturity Price : 25.25
Evaluated at bid price : 25.30
Bid-YTW : 4.48 %
W.PR.J Perpetual-Discount 1.20 % YTW SCENARIO
Maturity Type : Limit Maturity
Maturity Date : 2041-01-06
Maturity Price : 24.23
Evaluated at bid price : 24.52
Bid-YTW : 5.73 %
ELF.PR.F Perpetual-Discount 1.23 % YTW SCENARIO
Maturity Type : Limit Maturity
Maturity Date : 2041-01-06
Maturity Price : 21.95
Evaluated at bid price : 22.25
Bid-YTW : 5.97 %
MFC.PR.B Perpetual-Discount 1.32 % YTW SCENARIO
Maturity Type : Limit Maturity
Maturity Date : 2041-01-06
Maturity Price : 21.56
Evaluated at bid price : 21.56
Bid-YTW : 5.45 %
TD.PR.E FixedReset 1.34 % YTW SCENARIO
Maturity Type : Call
Maturity Date : 2014-05-30
Maturity Price : 25.00
Evaluated at bid price : 27.66
Bid-YTW : 2.87 %
NA.PR.O FixedReset 1.97 % YTW SCENARIO
Maturity Type : Call
Maturity Date : 2014-03-17
Maturity Price : 25.00
Evaluated at bid price : 27.70
Bid-YTW : 2.85 %
Volume Highlights
Issue Index Shares
Traded
Notes
BAM.PR.N Perpetual-Discount 158,604 RBC crossed five blocks: 22,900 shares, 25,000 shares, 40,000 and two of 25,300 each, all at 20.63.
YTW SCENARIO
Maturity Type : Limit Maturity
Maturity Date : 2041-01-06
Maturity Price : 20.56
Evaluated at bid price : 20.56
Bid-YTW : 5.83 %
SLF.PR.D Perpetual-Discount 125,402 Desjardins crossed blocks of 70,900 at 20.40 and 49,700 at 20.45.
YTW SCENARIO
Maturity Type : Limit Maturity
Maturity Date : 2041-01-06
Maturity Price : 20.43
Evaluated at bid price : 20.43
Bid-YTW : 5.49 %
SLF.PR.A Perpetual-Discount 84,690 Desjardins crossed 71,400 at 21.88.
YTW SCENARIO
Maturity Type : Limit Maturity
Maturity Date : 2041-01-06
Maturity Price : 21.81
Evaluated at bid price : 21.81
Bid-YTW : 5.49 %
BNS.PR.Q FixedReset 74,651 RBC crossed 50,000 at 26.10.
YTW SCENARIO
Maturity Type : Call
Maturity Date : 2013-11-24
Maturity Price : 25.00
Evaluated at bid price : 26.06
Bid-YTW : 3.28 %
CM.PR.H Perpetual-Discount 70,352 Desjardins crossed blocks of 38,300 and 15,000, both at 22.65.
YTW SCENARIO
Maturity Type : Limit Maturity
Maturity Date : 2041-01-06
Maturity Price : 22.43
Evaluated at bid price : 22.62
Bid-YTW : 5.31 %
SLF.PR.C Perpetual-Discount 51,660 TD crossed 25,000 at 20.50.
YTW SCENARIO
Maturity Type : Limit Maturity
Maturity Date : 2041-01-06
Maturity Price : 20.43
Evaluated at bid price : 20.43
Bid-YTW : 5.49 %
There were 29 other index-included issues trading in excess of 10,000 shares.

HIMIPref™ Index Performance: December 2010

Thursday, January 6th, 2011

Performance of the HIMIPref™ Indices for December, 2010, was:

Total Return
Index Performance
December 2010
Three Months
to
December 30, 2010
Ratchet +2.00% *** +7.46% ***
FixFloat -0.35% ** +7.19% **
Floater +2.00% +7.46%
OpRet +0.68% +1.10%
SplitShare -0.84% +3.65%
Interest +0.68%**** +1.10%****
PerpetualPremium +0.50% +1.25%
PerpetualDiscount -0.47% +2.55%
FixedReset +0.03% +0.49%
** The last member of the FixedFloater index was transferred to Scraps at the June, 2010, rebalancing; subsequent performance figures are set equal to the Floater index. The index was repopulated at the October, 2010, rebalancing
*** The last member of the RatchetRate index was transferred to Scraps at the July, 2010, rebalancing; subsequent performance figures are set equal to the Floater index
**** The last member of the InterestBearing index was transferred to Scraps at the June, 2009, rebalancing; subsequent performance figures are set equal to the OperatingRetractible index
Passive Funds (see below for calculations)
CPD -0.01% +1.44%
DPS.UN +0.14% +1.19%
Index
BMO-CM 50 -0.04% +2.64%
TXPR Total Return 0.00% +1.86%

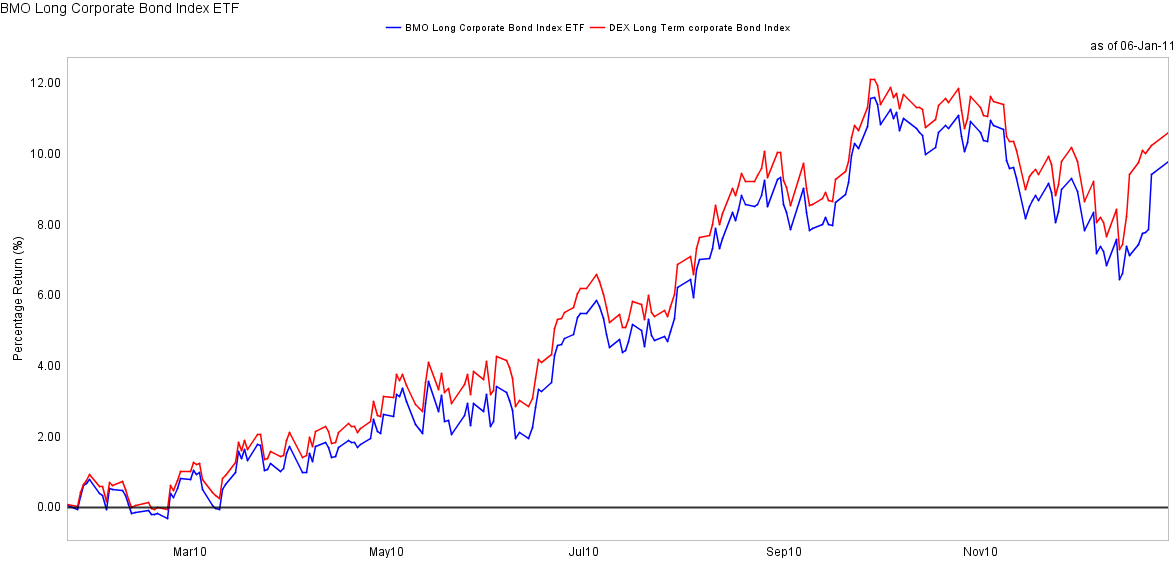
The pre-tax interest equivalent spread of PerpetualDiscounts over Long Corporates (which I also refer to as the Seniority Spread) ended the year at 225bp, a slight increase from the 220bp reported at November month end. Long corporate yields remained constant 5.4% during the period (albeit with interesting things happening in the interim) while PerpetualDiscounts increased slightly to 5.48% from 5.41% dividend yield. I would be happier with long corporates in the 6.00-6.25% range with a seniority spread in the range of 100-150bp, but what do I know? The market has never shown any particular interest in my happiness.

The wild ride of long corporates during the month is illustrated by the BMO Long Corporate Bond Index ETF tracking error chart:


Click for Big

Charts related to the Seniority Spread and the Bozo Spread (PerpetualDiscount Current Yield less FixedReset Current Yield) are published in PrefLetter.

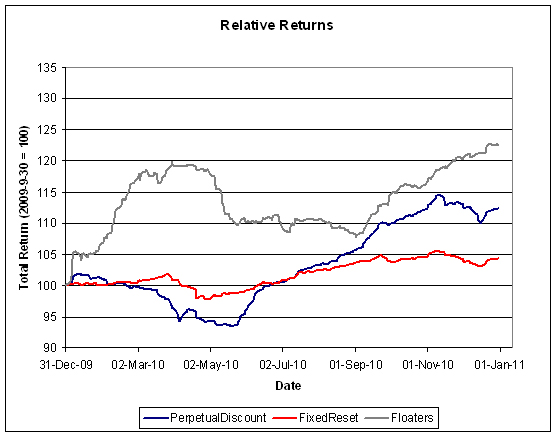
The trailing year returns are starting to look a bit more normal.


Click for big

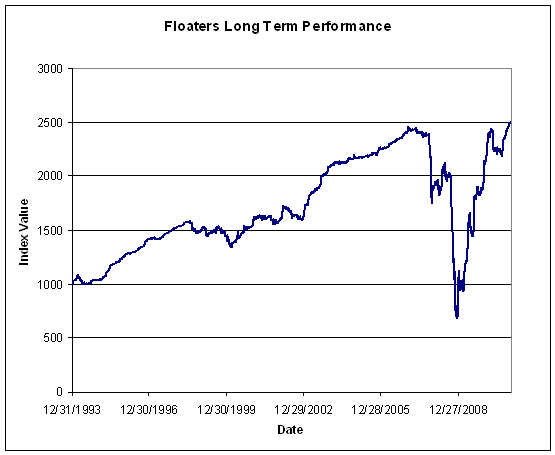
Floaters have had a wild ride; the latest decline is presumably due to the idea that the BoC will be slower rather than faster in hiking the overnight rate. I’m going to keep publishing updates of this graph until the one-year trailing return for the sector no longer looks so gigantic:


Click for big

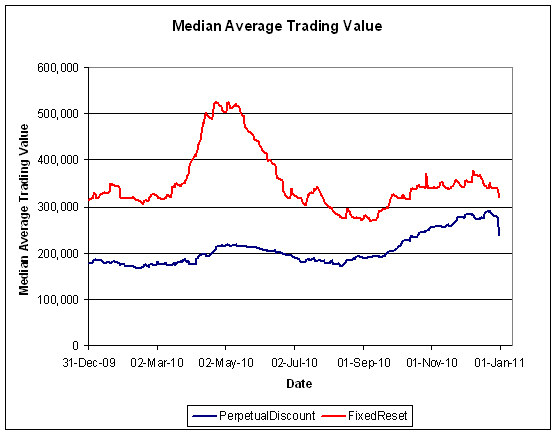
Volumes are on their way back up Volume may be under-reported due to the influence of Alternative Trading Systems (as discussed in the November PrefLetter), but I am biding my time before incorporating ATS volumes into the calculations, to see if the effect is transient or not. The droop at year end is quite pronounced.


Click for big

Compositions of the passive funds were discussed in the September, 2010, edition of PrefLetter.

Claymore has published NAV and distribution data (problems with the page in IE8 can be kludged by using compatibility view) for its exchange traded fund (CPD) and I have derived the following table:

CPD Return, 1- & 3-month, to December 30, 2010
Date NAV Distribution Return for Sub-Period Monthly Return
September 30 17.07      
October 26 17.21 0.069 +1.22% +1.40%
October 29, 2010 17.24   +0.17%
November 25 17.25 0.069 +0.46% +0.23%
November 30 17.21   -0.23%
December 24 17.09 0.069 -0.30% -0.01%
December 31 17.14   +0.29%
Quarterly Return +1.44%

Claymore currently holds $596,621,272 (advisor & common combined) in CPD assets, up about $14-million (2.47%) from the $582,195,003 reported at November month-end and up about $223-million (+59.64%) from the $373,729,364 reported at year-end 2009. Their tracking error does not seem to be affecting their ability to gather assets!

The DPS.UN NAV for December 29 has been published so we may calculate the approximate December returns.

DPS.UN NAV Return, December-ish 2010
Date NAV Distribution Return for sub-period Return for period
December 1 21.33      
December 29 21.01 0.30   -0.09%
Estimated December Beginning Stub *
Estimated December Ending Stub +0.29% *****
Estimated December Return +0.14% ******
**CPD had a NAVPU of 17.21 on November 30 and 17.20 on December 1, therefore the return for the day was -0.06%. The return for DPS.UN in this period is presumed to be equal.
*****CPD had a NAVPU of 17.09 on December 29 and 17.14 on December 31, hence the total return for the period for CPD was +0.29%. The return for DPS.UN in this period is presumed to be equal.
**** The estimated December return for DPS.UN’s NAV is therefore the product of three period returns, -0.06%, -0.09%, +0.29% to arrive at an estimate for the calendar month of +0.14%

Now, to see the DPS.UN quarterly NAV approximate return, we refer to the calculations for October and November:

DPS.UN NAV Returns, three-month-ish to end-December-ish, 2010
October-ish +0.17%
November-ish +0.88%
December-ish +0.14%
Three-months-ish +1.19%

Sentry Select is now publishing performance data for DPS.UN, but this appears to be price-based, rather than NAV-based. I will continue to report NAV-based figures.

BSD.PR.A to Allow Retractions

Thursday, January 6th, 2011

Brookfield Soundvest Funds has announced:

that the annual redemption rights attributable to the Capital Units and the Combined Securities (being one Capital Unit and a $10.00 principal amount of Preferred Securities) of the Brookfield Soundvest Split Trust (TSX:BSD.UN)(TSX:BSD.PR.A) (the “Trust”) are being reinstated. The Trust’s annual redemption rights were suspended in October 2008 as a result of provisions in the Declaration of Trust that are applicable where it is anticipated that, after giving effect to redemptions, the Combined Value (NAV plus the Repayment Price which is the $10.00 principal amount of a Preferred Security plus all accrued and unpaid interest on such $10.00 principal amount of a Preferred Security) determined as of the Redemption Date would fall below 1.4 times the Repayment Price determined as of the Redemption Date (“the 1.4 times coverage ratio”). The Trust has performed strongly over the past several months and it is now anticipated that redemptions may be processed without violating the 1.4 times coverage ratio.

Consequently, the Trust intends to reinstate the suspended redemption rights with a specified redemption date of February 14, 2011. This date provides for the notice period required by CDS and the provisions of the Declaration of Trust relevant to the redemption process that apply. Accordingly, each Unitholder who has requested a redemption by depositing Capital Units or Combined Securities with the Registrar and Transfer Agent at least 15 business days prior to February 14, 2011 and in accordance with their deposit requirements will be entitled to receive redemption proceeds calculated and paid in accordance with the Declaration of Trust no later than 15 business days after February 14, 2011.

When Capital Units alone are surrendered for redemption, an equal number of Preferred Securities must be acquired for cancellation, either in the market or, in limited circumstances, pursuant to the Call Right as defined in the Trust Indenture. If the average cost of acquiring Preferred Securities for cancellation exceeds their $10.00 face value plus accrued and unpaid interest thereon, the amount the Capital Unit holder will be entitled to receive will be reduced. If any Capital Unit holder chooses to tender just Capital Units, then he or she will take the risk that their redemption proceeds will be reduced by an uncertain amount. Anyone planning to surrender Capital Units alone is encouraged to read the Trust Indenture and the Amended and Restated Declaration of Trust that are available at www.SEDAR.com and to consult with their financial adviser.

Notwithstanding any other provision in the Declaration of Trust, redemption of Trust Units and Combined Securities may be suspended or payment of redemption proceeds postponed, even if units have been tendered for redemption, if, after giving effect to the redemptions, the 1.4 times coverage ratio cannot be maintained. The Trust will continue to closely monitor its NAV and will make a further announcement in the event that such a suspension or postponement is required.

Cash distributions cannot be paid on the Capital Units of the Trust if, immediately after giving effect to the proposed distribution, the Combined Value determined as of the declaration date will be less than 1.4 times the Repayment Price determined as of the declaration date. The Trust will continue to monitor its net asset value to determine when it will be able to make future distributions on its Capital Units and will issue a news release if such distributions are declared.

Brookfield Soundvest Funds give investors access to tax-advantaged distributions while focusing on capital preservation and long-term total return. The manager and investment advisor and portfolio manager for the Funds is Brookfield Soundvest Capital Management Ltd. (the “Manager”), an established investment advisor, providing investment management services to trusts, foundations, corporations and high net worth individuals.

The manager’s incompetence is such that this press release, dated 2011-1-5, is not yet available on the fund’s press release page.

It will be noted that the press release’s first paragraph contains what is basically a lie. According to the prospectus (emphasis added):

The Trust may suspend the redemption of Capital Units and the repayment of Preferred Securities or postpone repayment of redemption proceeds: (i) during any period when the Investment Advisor advises the Manager that normal trading is suspended on a market where more than 50% of the securities in the Portfolio (in terms of dollar value) trade and, if those securities are not traded on any other exchange that represents a reasonably practical alternative for the Trust; (ii) with the permission of the securities regulatory authorities (if required), for any period not exceeding 120 days during which the Manager determines that conditions exist which render impractical the sale of assets of the Trust or which impair the ability of the Trustee to determine the value of the assets of the Trust, (iii) if, after giving effect to redemptions, the Combined Value would be less than 1.4 times the Repayment Price, or (iv) if the Trust would be insolvent or otherwise unable to pay its liabilities as they become due after giving effect to such redemptions (and repayment, if applicable). The suspension shall apply to all requests for redemption or repayment received prior to the suspension date but for which payment has not been made, as well as to all requests received while the suspension is in effect. All Unitholders or Securityholders making such requests will be advised by the Manager of the suspension and that the redemption or repayment will be effected at a price determined following the resumption of redemptions and repayments. All such Unitholders and Securityholders will have, and will be advised that they have, the right to withdraw their requests for redemption or repayment if such requests were submitted prior to a suspension and payment has not been made, or if such requests were submitted during a period of suspension. Redemptions and repayments will resume in any event on the first day on which the condition giving rise to the suspension has ceased to exist, provided that no other circumstances under which a suspension is authorized then exists. To the extent it is not inconsistent with rules and regulations promulgated by any government body having jurisdiction over the Trust, any declaration of suspension made by the Manager will be conclusive.

See that word? “May”? The Manager has discretion.

The combined unit NAV as of December 31 is $14.41. Asset coverage has indeed recovered to within shouting distance of my usual comfort zone and the 6% coupon (as interest) is indeed nice and fat …. but I have lost confidence in this manager and my comfort zone for Asset Coverage is now more than usual. Suspending the retraction right was abusive to shareholders, and underperformance against the benchmark since inception has been egregious.

Therefore, I recommend retraction.

BSD.PR.A was last mentioned on PrefBlog when it was upgraded to Pfd-4(low) by DBRS. BSD.PR.A is tracked by HIMIPref™ but is relegated to the Scraps index on credit concerns.

Thanks to Assiduous Reader cal for bringing this to my attention.

Update, 2011-1-11: The Material Change Report filed on SEDAR dated 2011-1-5 is a little more honest in its wording (emphasis added):

The Amended and Restated Declaration of Trust dated April 30, 2010 (the “Declaration of Trust”) for Brascan Soundvest Split Trust permits the temporary suspension of the redemption of Capital Units and Combined Securities (being one Capital Unit and a $10.00 principal amount of Preferred Securities) if, after giving effect to the redemptions, the Combined Value would be less than 1.4 times the Repayment Price….As a result, the Declaration of Trust permits the suspension of redemptions when the net asset value per Capital Unit is less than approximately $4.00

January 5, 2011

Thursday, January 6th, 2011

Manulife has announced that:

Between October 1, 2010 and December 31, 2010, the Company:

  • Shorted approximately $5 billion of equity futures contracts as part of the Company’s macro hedging program.
  • Modestly increased its dynamic variable annuity hedging program by adding $800 million of in-force variable annuity guaranteed value to the program.
  • Sold $200 million of on-balance sheet public equities backing insurance liabilities

The WSJ has a story today titled Bondholders Are Rattled by Prepayment Covenants, republished by the Globe, but not on-line. It seems there are a lot of calls for redemption in the junk bond world, surprising many managers … I tell you, it’s a good thing so few of my competitors read prospectuses; that would make outperformance more difficult.

Assiduous Reader DW brings to my attention a working paper by Zhiwu Chen, Roger G. Ibbotson and Wendy Hu titled Liquidity as an Investment Style:

We first show that liquidity, as measured by stock turnover or trading volume, is an economically significant investment style that is distinct from traditional investment styles such as size, value/growth, and momentum. We then introduce and examine the performance of several portfolio strategies, including a Volume Weighted Strategy, an Earnings Weighted Strategy, an Earnings-Based Liquidity Strategy, and a Market Cap-Based Liquidity Strategy. Our backtest research shows that the Earnings-Based Liquidity Strategy offers the highest return and the best risk-return tradeoff, while the Volume Weighted Strategy does the worst. The superior performance of the liquidity strategies are due to equilibrium, macro, and micro reasons. In equilibrium, liquid stocks sell at a liquidity premium and illiquid stocks sell at a liquidity discount. Investing in less liquid stocks thus pays. Second, at the macro level, the growing level of financialization of assets in the world makes today’s less liquid securities increasingly more liquid over time. Finally, at the micro level, the strategy avoids, or invests less, in popular, heavily traded glamour stocks and favors out-of-favor stocks, both of which tend to revert to more normal trading volume over time.

The negative relation between liquidity and stock returns is not always straight forward. Lee and Swaminathan (1998) show that the return spread between past winners and past losers (i.e., the momentum premium) is much higher among high-volume stocks. Trading volume serves as an indicator of demand for a stock. When a stock falls into disfavor, the number of sellers dominates buyers, leading to low prices and low volume. When a stock becomes popular or glamorous, buyers dominate sellers, resulting in higher prices and higher volume. Thus, relatively low turnover is indicative of a stock near the bottom of its expectation cycle, while a relatively high turnover is indicative of a firm close to the top of its expectation cycle.

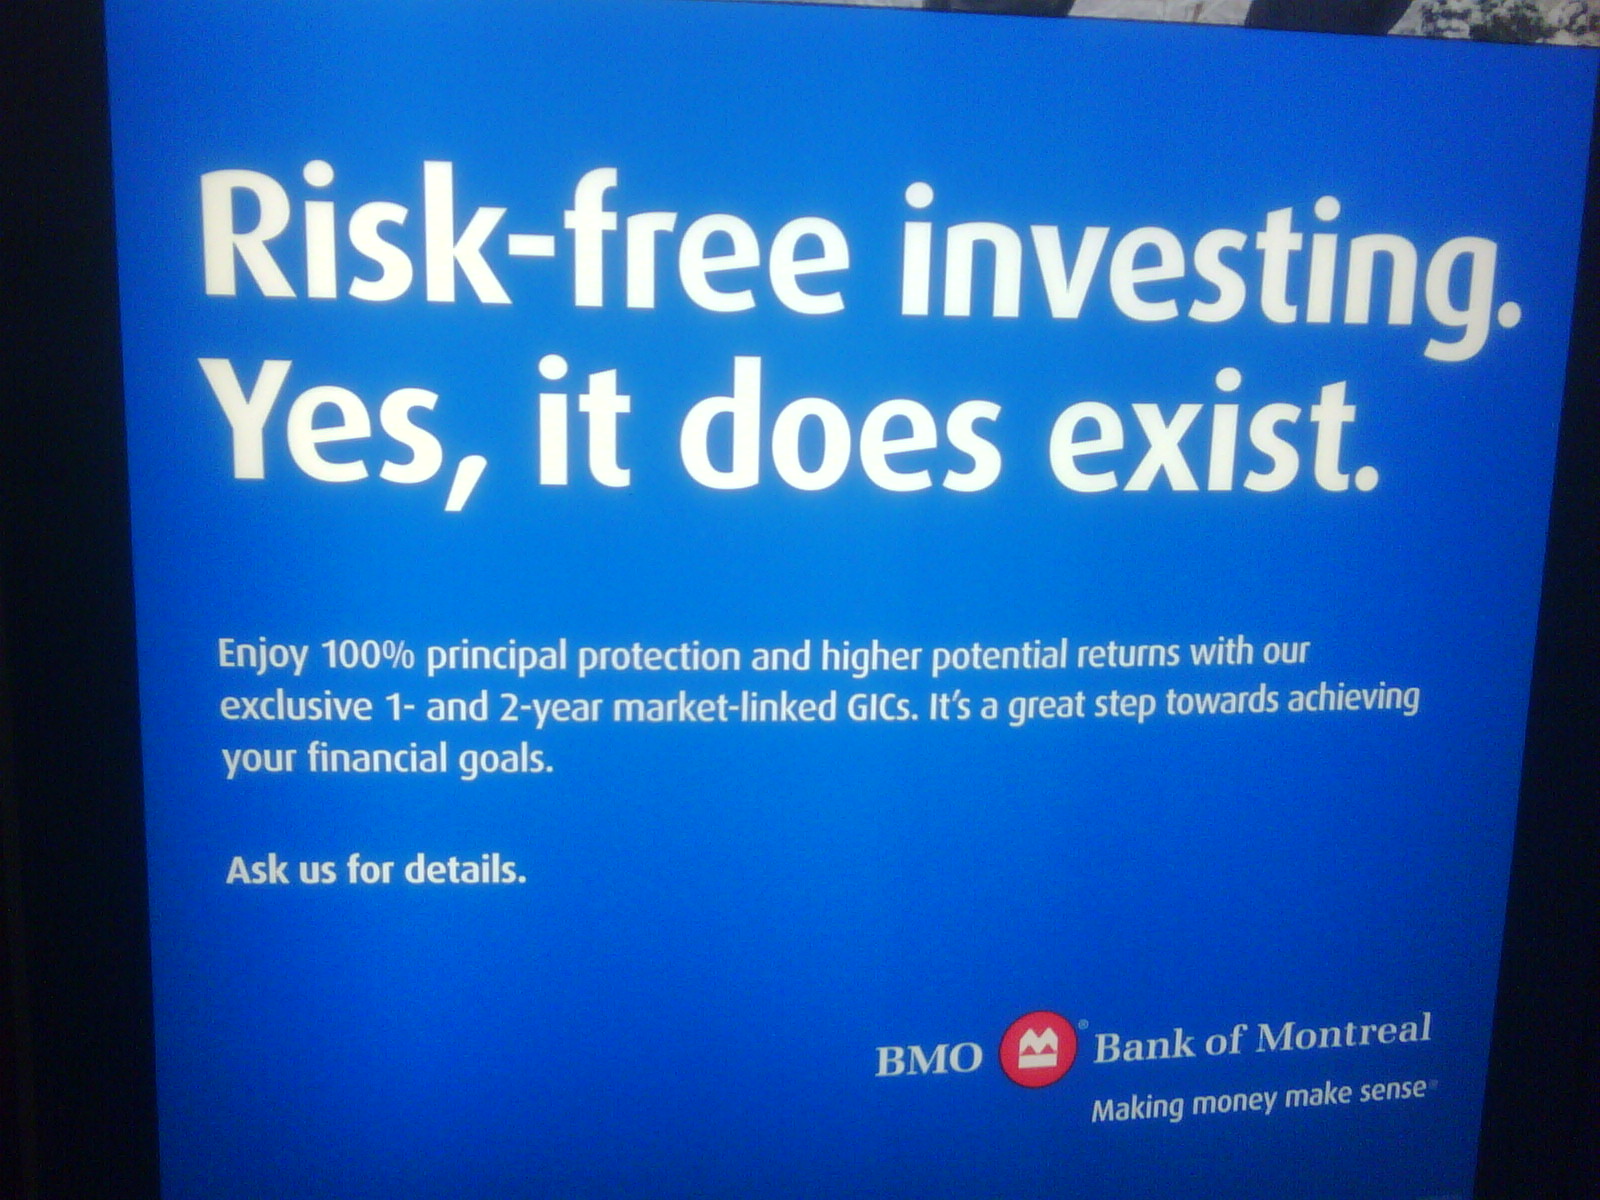
Today’s installment in the “Incredible Bullshit Banks are Allowed To Get Away With” series features the Bank of Montreal:


Click for Big

Risk Free! Lehman should have thought of that line, they would have been able to sell a great many more of their PPNs.

A mixed day on the Canadian preferred share market, with PerpetualDiscounts gaining 10bp and FixedResets losing 16bp. Volume was on the high side of average.

PerpetualDiscounts now yield 5.43%, equivalent to 7.60% interest at the standard equivalency factor of 1.4x. Long corporates now yield about 5.5%, so the pre-tax interest-equivalent spread (also known, around here, as the Seniority Spread) is now about 210bp, a dramatic tightening from the 225bp reported on December 31.

HIMIPref™ Preferred Indices
These values reflect the December 2008 revision of the HIMIPref™ Indices

Values are provisional and are finalized monthly
Index Mean
Current
Yield
(at bid)
Median
YTW
Median
Average
Trading
Value
Median
Mod Dur
(YTW)
Issues Day’s Perf. Index Value
Ratchet 0.00 % 0.00 % 0 0.00 0 0.2099 % 2,311.5
FixedFloater 4.81 % 3.54 % 29,719 18.92 1 0.0000 % 3,495.6
Floater 2.59 % 2.38 % 47,327 21.27 4 0.2099 % 2,495.8
OpRet 4.78 % 3.27 % 65,364 2.33 8 -0.1290 % 2,400.5
SplitShare 5.34 % 1.30 % 692,021 0.92 4 0.3945 % 2,446.8
Interest-Bearing 0.00 % 0.00 % 0 0.00 0 -0.1290 % 2,195.0
Perpetual-Premium 5.64 % 5.31 % 124,903 5.31 20 0.1120 % 2,021.2
Perpetual-Discount 5.43 % 5.49 % 233,261 14.71 57 0.1049 % 2,034.5
FixedReset 5.23 % 3.46 % 304,306 3.08 52 -0.1590 % 2,267.3
Performance Highlights
Issue Index Change Notes
BAM.PR.O OpRet -1.33 % YTW SCENARIO
Maturity Type : Option Certainty
Maturity Date : 2013-06-30
Maturity Price : 25.00
Evaluated at bid price : 26.05
Bid-YTW : 3.27 %
BNS.PR.Y FixedReset -1.03 % YTW SCENARIO
Maturity Type : Limit Maturity
Maturity Date : 2041-01-05
Maturity Price : 24.85
Evaluated at bid price : 24.90
Bid-YTW : 3.46 %
NA.PR.O FixedReset -1.01 % YTW SCENARIO
Maturity Type : Call
Maturity Date : 2014-03-17
Maturity Price : 25.00
Evaluated at bid price : 27.57
Bid-YTW : 3.53 %
BNA.PR.C SplitShare 1.10 % YTW SCENARIO
Maturity Type : Hard Maturity
Maturity Date : 2019-01-10
Maturity Price : 25.00
Evaluated at bid price : 22.10
Bid-YTW : 6.31 %
GWO.PR.F Perpetual-Premium 1.30 % YTW SCENARIO
Maturity Type : Call
Maturity Date : 2011-02-04
Maturity Price : 25.50
Evaluated at bid price : 25.75
Bid-YTW : -5.08 %
HSB.PR.C Perpetual-Discount 1.34 % YTW SCENARIO
Maturity Type : Limit Maturity
Maturity Date : 2041-01-05
Maturity Price : 23.21
Evaluated at bid price : 23.45
Bid-YTW : 5.47 %
IAG.PR.A Perpetual-Discount 1.94 % YTW SCENARIO
Maturity Type : Limit Maturity
Maturity Date : 2041-01-05
Maturity Price : 21.01
Evaluated at bid price : 21.01
Bid-YTW : 5.52 %
Volume Highlights
Issue Index Shares
Traded
Notes
TD.PR.I FixedReset 95,421 TD crossed four blocks; 20,000 shares, 41,900 shares, 12,600 and 12,400, all at 27.75.
YTW SCENARIO
Maturity Type : Call
Maturity Date : 2014-08-30
Maturity Price : 25.00
Evaluated at bid price : 27.56
Bid-YTW : 3.61 %
GWO.PR.H Perpetual-Discount 76,071 Desjardins crossed three blocks, one of 11,400 and two of 25,000 each, all at 23.50.
YTW SCENARIO
Maturity Type : Limit Maturity
Maturity Date : 2041-01-05
Maturity Price : 23.07
Evaluated at bid price : 23.30
Bid-YTW : 5.23 %
PWF.PR.M FixedReset 71,772 Nesbitt crossed 50,000 at 27.00; RBC crossed 20,700 at the same price.
YTW SCENARIO
Maturity Type : Call
Maturity Date : 2014-03-02
Maturity Price : 25.00
Evaluated at bid price : 27.00
Bid-YTW : 3.64 %
TRP.PR.A FixedReset 61,113 RBC crossed 38,000 at 25.96.
YTW SCENARIO
Maturity Type : Call
Maturity Date : 2015-01-30
Maturity Price : 25.00
Evaluated at bid price : 25.94
Bid-YTW : 3.61 %
TRP.PR.C FixedReset 46,815 RBC crossed 40,000 at 25.43.
YTW SCENARIO
Maturity Type : Limit Maturity
Maturity Date : 2041-01-05
Maturity Price : 25.30
Evaluated at bid price : 25.35
Bid-YTW : 3.95 %
BNS.PR.Q FixedReset 38,522 YTW SCENARIO
Maturity Type : Call
Maturity Date : 2013-11-24
Maturity Price : 25.00
Evaluated at bid price : 26.03
Bid-YTW : 3.32 %
There were 33 other index-included issues trading in excess of 10,000 shares.

New Issue: FN FixedReset 4.65%+207

Wednesday, January 5th, 2011

First National Financial Corporation has announced:

a Canadian public offering of Cumulative 5-Year Rate Reset Class A Preference Shares, Series 1 (“Series 1 Preferred Shares”). First National will issue 4 million Series 1 Preferred Shares priced at $25 per share to raise gross proceeds of C$100 million. The offering will be underwritten by a syndicate of investment dealers led by RBC Capital Markets and Scotia Capital Inc.

The offering is being made in all the provinces of Canada by means of a prospectus and the expected closing date is on or about January 25, 2011. The net proceeds of the offering will be used to repay current indebtedness as well as for general corporate purposes.

Holders of the Series 1 Preferred Shares will be entitled to receive a cumulative quarterly fixed dividend yielding 4.65% annually for the initial period ending March 31, 2016. Thereafter, the dividend rate will be reset every five years at a rate equal to the 5-year Government of Canada yield plus 2.07%.

Holders of Series 1 Preferred Shares will have the right, at their option, to convert their shares into Cumulative, Floating Rate Class A Preference Shares, Series 2 (“Series 2 Preferred Shares”), subject to certain conditions, on March 31, 2016 and on March 31 every five years thereafter. Holders of the Series 2 Preferred Shares will be entitled to receive cumulative quarterly floating dividends at a rate equal to the 3-month Government of Canada Treasury Bill yield plus 2.07%.

This is interesting because First National is a shadow-bank:

First National is Canada’s largest non-bank lender, offering both commercial and residential mortgage solutions.

Through a combination of our innovative mortgage solutions, Merlin our industry leading mortgage approval and tracking system, and the experts we have on our team, First National has earned trust with Mortgage Brokers, Commercial Clients as well as Residential Customers.

These strong relationships are thanks to an unwavering commitment to delivering excellent service. A Commitment shared by Senior Management and every member of the First National team

Since it’s not regulated as a bank, FN doesn’t have to worry about formal definitions of Tier 1 Capital, so it can make its preferred shares cumulative. Theoretically, this should result in less “equity credit” for the shares and hence detract from the credit quality of issues senior to it. Theoretically.

Update, 2011-1-19: DBRS rates Pfd-3

January 4, 2010

Tuesday, January 4th, 2011

European bank regulation may become far more intrusive:

National regulators of cross-border banks may be able to require “changes to legal or operational structures” if the lender would need “extraordinary public financial support” during a crisis, according to draft proposals obtained by Bloomberg News.

The plan also envisages measures “requiring the credit institution to limit its maximum individual and aggregate exposures” or forcing banks to “limit or cease” some activities, according to the document, dated December 2010.

Regulators should assess lenders and “satisfy themselves that critical functions could be legally and economically separated from other functions” during a crisis, according to the draft proposals.

I can’t think of a better way to reinforce structural groupthink.

Japan has interesting bond sales methods:

Japan will sell a record 144.9 trillion yen ($1.8 trillion) of debt in the fiscal year starting April 1, it said in a budget plan on Dec. 24 that also detailed the changes in its retail bonds. The Ministry of Finance tried to find new buyers for the debt last year with magazine advertisements saying, “Men who hold JGBs are popular with women!”

An investor who decided to buy floating-rate retail notes after reading the ads would have seen yields shrink to a range of 0.25 percent to 0.53 percent at the twice-yearly coupon payouts for the 10-year securities.

I mentioned the Greg Walsh kerfuffle briefly on December 30 – he’s the Peterborough hockey coach who had hysterics when one of his players was called a nasty name. The blog dahn batchelor’s opinions also posted on the topic in a post titled A foul-mouthed brat caused this problem; I left a comment on the moderated blog, but it hasn’t appeared yet, possibly due to a technical problem. So I’ll publish it here:

I am surprised that someone with such a lengthy profile would publish such a shoddy analysis.

You acknowledge that the players were in an on-ice confrontation and that they heckled each other in the penalty box. You profess dismay at the idea that the heckling included the word “nigger” and substitute “brat” as your own politically correct childish insult of choice – both in the headline and the text.

These kids are 16-17 years old – more balls than brains if my own recollections of adolescence can be trusted. Sometimes they say stupid things. Surprise! Not everybody invariably chooses their words as carefully as a retired lawyer tapping away at his keyboard in his surroundings of choice.

What should the punishment be for such a breach of public dignity in the context of a schoolyard yelling match? A three game suspension sounds harsh to me, but it’s not so harsh that I care much one way or the other.

What should the punishment be? Walsh seems to think it should involve a public apology – at best a lesson in hypocrisy, at worst a public humiliation of the kind civilized nations have eliminated from the criminal code.

Your own rather incoherent response seems to include coaches – the ones who should support their players – imposing extra-judicial punishment, benching them for the rest of the game. Unable to find any other support in today’s world for your thesis, you are forced to dredge up a case from thirty-seven years ago, and the recollections of a 54-year old man speculating on what he thinks he would have done differently.

The PMHA seems to think that penalties should include a criminal record.

In a year or two, these kids will be eligible to go to Afghanistan, where the Taliban may well call them nasty names and even – gasp! – hit them with sticks. It really is too bad that Greg Walsh, Dahn Batchelor and others are attempting to prepare them for the rigors and conflicts of adulthood by telling them that the way to deal with adversity is to run home crying to mommy.

Jackie Robinson would never even have been able to watch major league baseball with that attitude.

I hadn’t known that the PMHA had gone to the police about this. My lord, don’t they realize that when there are horrific penalties for minor transgressions, you simply get selective reporting? Or don’t they care? Or do they, in their heart of hearts, believe that this shouting match is worthy of police time and a possible criminal record? But then, we live in a world with some very strange priorities – or, at least, one in which very strange rationales are given credence by the press.

The Canadian preferred share market had a good day as volume returned to more normal levels. PerpetualDiscounts gained 15bp and FixedResets lost 3bp.

HIMIPref™ Preferred Indices
These values reflect the December 2008 revision of the HIMIPref™ Indices

Values are provisional and are finalized monthly
Index Mean
Current
Yield
(at bid)
Median
YTW
Median
Average
Trading
Value
Median
Mod Dur
(YTW)
Issues Day’s Perf. Index Value
Ratchet 0.00 % 0.00 % 0 0.00 0 0.0247 % 2,306.7
FixedFloater 4.81 % 3.54 % 29,863 18.93 1 0.3107 % 3,495.6
Floater 2.59 % 2.39 % 47,834 21.24 4 0.0247 % 2,490.6
OpRet 4.77 % 3.14 % 60,796 2.34 8 0.2442 % 2,403.6
SplitShare 5.36 % 1.29 % 719,531 0.92 4 -0.3930 % 2,437.2
Interest-Bearing 0.00 % 0.00 % 0 0.00 0 0.2442 % 2,197.9
Perpetual-Premium 5.64 % 5.29 % 126,768 5.30 20 -0.0255 % 2,018.9
Perpetual-Discount 5.43 % 5.49 % 235,000 14.69 57 0.1544 % 2,032.4
FixedReset 5.22 % 3.42 % 310,251 3.08 52 -0.0302 % 2,270.9
Performance Highlights
Issue Index Change Notes
BNS.PR.X FixedReset -1.23 % YTW SCENARIO
Maturity Type : Call
Maturity Date : 2014-05-25
Maturity Price : 25.00
Evaluated at bid price : 27.32
Bid-YTW : 3.27 %
BNA.PR.E SplitShare -1.22 % YTW SCENARIO
Maturity Type : Hard Maturity
Maturity Date : 2017-12-10
Maturity Price : 25.00
Evaluated at bid price : 24.35
Bid-YTW : 5.38 %
CM.PR.L FixedReset -1.19 % YTW SCENARIO
Maturity Type : Call
Maturity Date : 2014-05-30
Maturity Price : 25.00
Evaluated at bid price : 27.37
Bid-YTW : 3.43 %
FTS.PR.G FixedReset -1.17 % YTW SCENARIO
Maturity Type : Call
Maturity Date : 2013-10-01
Maturity Price : 25.00
Evaluated at bid price : 26.26
Bid-YTW : 3.45 %
NA.PR.N FixedReset 1.16 % YTW SCENARIO
Maturity Type : Call
Maturity Date : 2013-09-14
Maturity Price : 25.00
Evaluated at bid price : 27.01
Bid-YTW : 2.48 %
SLF.PR.G FixedReset 1.18 % YTW SCENARIO
Maturity Type : Limit Maturity
Maturity Date : 2041-01-04
Maturity Price : 23.42
Evaluated at bid price : 25.75
Bid-YTW : 3.62 %
GWO.PR.M Perpetual-Discount 1.20 % YTW SCENARIO
Maturity Type : Call
Maturity Date : 2019-04-30
Maturity Price : 25.00
Evaluated at bid price : 25.20
Bid-YTW : 5.73 %
TD.PR.N OpRet 1.36 % YTW SCENARIO
Maturity Type : Call
Maturity Date : 2011-02-03
Maturity Price : 25.75
Evaluated at bid price : 26.15
Bid-YTW : -4.90 %
SLF.PR.A Perpetual-Discount 1.63 % YTW SCENARIO
Maturity Type : Limit Maturity
Maturity Date : 2041-01-04
Maturity Price : 21.85
Evaluated at bid price : 21.85
Bid-YTW : 5.48 %
BAM.PR.T FixedReset 1.76 % YTW SCENARIO
Maturity Type : Limit Maturity
Maturity Date : 2041-01-04
Maturity Price : 23.04
Evaluated at bid price : 24.84
Bid-YTW : 4.55 %
SLF.PR.E Perpetual-Discount 3.16 % YTW SCENARIO
Maturity Type : Limit Maturity
Maturity Date : 2041-01-04
Maturity Price : 20.54
Evaluated at bid price : 20.54
Bid-YTW : 5.52 %
Volume Highlights
Issue Index Shares
Traded
Notes
PWF.PR.M FixedReset 93,800 National bought blocks of 15,000 and 10,000 from Nesbitt, both at 27.00; then crossed 45,000 at the same price.
YTW SCENARIO
Maturity Type : Call
Maturity Date : 2014-03-02
Maturity Price : 25.00
Evaluated at bid price : 27.00
Bid-YTW : 3.64 %
RY.PR.E Perpetual-Discount 63,526 RBC crossed 39,500 at 22.07.
YTW SCENARIO
Maturity Type : Limit Maturity
Maturity Date : 2041-01-04
Maturity Price : 21.92
Evaluated at bid price : 22.04
Bid-YTW : 5.17 %
RY.PR.A Perpetual-Discount 54,930 RBC crossed 25,500 at 22.00, then crossed 15,000 at 22.04.
YTW SCENARIO
Maturity Type : Limit Maturity
Maturity Date : 2041-01-04
Maturity Price : 21.97
Evaluated at bid price : 22.10
Bid-YTW : 5.09 %
TD.PR.M OpRet 34,000 RBC crossed 25,000 at 25.85.
YTW SCENARIO
Maturity Type : Call
Maturity Date : 2011-05-30
Maturity Price : 25.50
Evaluated at bid price : 25.86
Bid-YTW : 3.14 %
SLF.PR.A Perpetual-Discount 31,230 Desjardins crossed 16,000 at 21.85.
YTW SCENARIO
Maturity Type : Limit Maturity
Maturity Date : 2041-01-04
Maturity Price : 21.85
Evaluated at bid price : 21.85
Bid-YTW : 5.48 %
BNS.PR.T FixedReset 29,924 rBC crossed 25,000 at 27.40.
YTW SCENARIO
Maturity Type : Call
Maturity Date : 2014-05-25
Maturity Price : 25.00
Evaluated at bid price : 27.27
Bid-YTW : 3.31 %
There were 25 other index-included issues trading in excess of 10,000 shares.