Archive for May, 2012

MAPF Performance: April 2012

Saturday, May 5th, 2012

The fund underperformed in April, for reasons that remain unclear – see the discussion below.

The fund’s Net Asset Value per Unit as of the close April 30, 2012, was 10.4438.

Returns to April, 2012
Period MAPF BMO-CM “50” Index TXPR
Total Return
CPD
according to
Blackrock
One Month +0.48% +0.96% +0.73% +0.69%
Three Months -1.18% +0.57% +0.20% +0.18%
One Year +3.96% +6.58% +5.28% +4.79%
Two Years (annualized) +13.41% +11.08% +9.49% N/A
Three Years (annualized) +18.17% +12.87% +10.23% +9.51%
Four Years (annualized) +18.40% +7.11% +5.41% N/A
Five Years (annualized) +14.56% +4.43%   +2.19
Six Years (annualized) +13.20% +4.39%    
Seven Years (annualized) +12.20% +4.26%    
Eight Years (annualized) +11.89% +4.44%    
Nine Years (annualized) +13.31% +4.65%    
Ten Years (annualized) +12.11% +4.78%    
Eleven Years (annualized) +12.47% +4.42%    
MAPF returns assume reinvestment of distributions, and are shown after expenses but before fees.
CPD Returns are for the NAV and are after all fees and expenses.
* CPD does not directly report its two- or four-year returns.
Figures for Omega Preferred Equity (which are after all fees and expenses) for 1-, 3- and 12-months are +0.75%, +0.44% and +5.48%, respectively, according to Morningstar after all fees & expenses. Three year performance is +11.06%.
Figures for Jov Leon Frazer Preferred Equity Fund Class I Units (which are after all fees and expenses) for 1-, 3- and 12-months are +0.47%, -0.34% and +3.35% respectively, according to Morningstar. Three Year performnce is +7.71%
Figures for Manulife Preferred Income Fund (formerly AIC Preferred Income Fund) (which are after all fees and expenses) for 1-, 3- and 12-months are +0.47%, +0.14% & +5.26%, respectively. Three Year performnce is +6.61%
Figures for Horizons AlphaPro Preferred Share ETF (which are after all fees and expenses) for 1-, 3- and 12-months are -0.29%, +1.97% & +5.64%, respectively.

MAPF returns assume reinvestment of dividends, and are shown after expenses but before fees. Past performance is not a guarantee of future performance. You can lose money investing in Malachite Aggressive Preferred Fund or any other fund. For more information, see the fund’s main page. The fund is available either directly from Hymas Investment Management or through a brokerage account at Odlum Brown Limited.

The underperformance of MAPF during the month is difficult to understand given the relative index total returns in April:

HIMIPref™ Index Returns
April, 2012
Index Total Return
RatchtRate N/A
FixedFloater +3.03%
Floater +5.08
OpRet +0.65%
InterestBearing N/A
PerpetualPremium +0.81%
PerpetualDiscount +2.04%
FixedReset +0.80%
DeemedRetractible +0.96%

The biggest component of the fund – by far – is DeemedRetractibles, while the biggest component ofthe index – also by far – is FixedResets. Even allowing for the index to have outperformed due to its higher weighting in the Floating Rate Sector and PerpetualDiscounts, the gap seems too large to be explicable in this manner – and it also seems that the fund return of +0.48% is lower than it should have been.

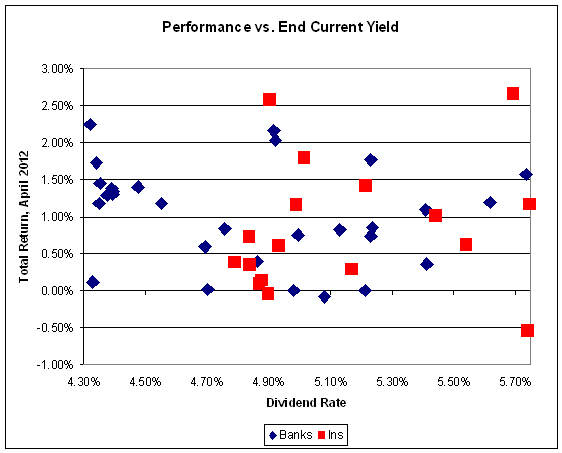
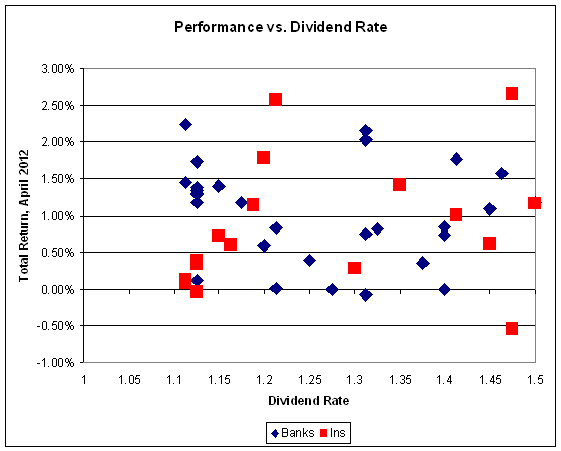
In cases such as this it is often possible to explain deviations through a change in the Implied Volatility of the embedded call option in StraightPerpetuals – as was the case in June 2008. Accordingly, the first step is to compare the month’s performance of individual DeemedRetractible issues with their Dividend Rate:


Click for Big

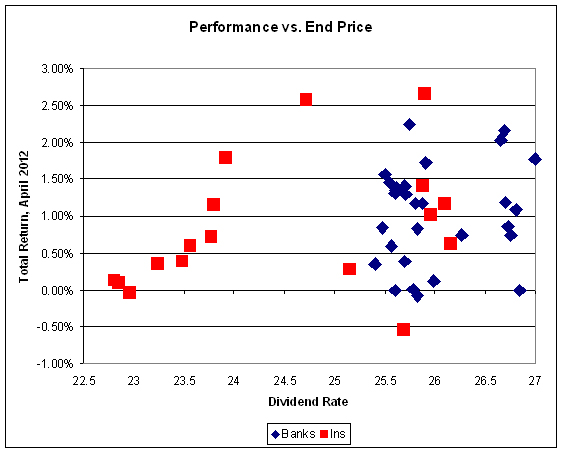
Well, that didn’t work at all – perhaps there will be a correlation with end-price (the closing bid on April 30)?


Click for Big

Nope. Current Yield?


Click for Big

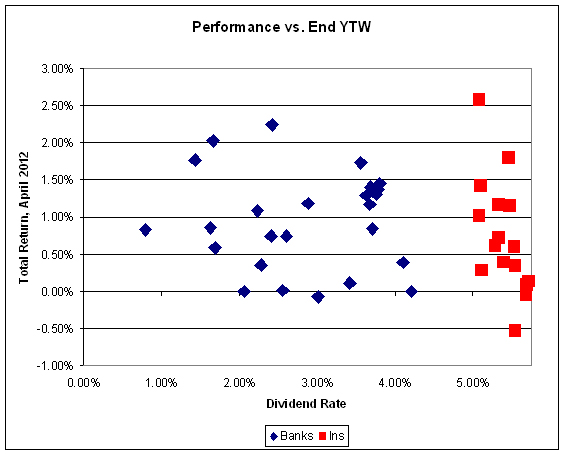
Nope. This is getting serious – we need to try some weirder stuff. How about “Ending YTW”?


Click for Big

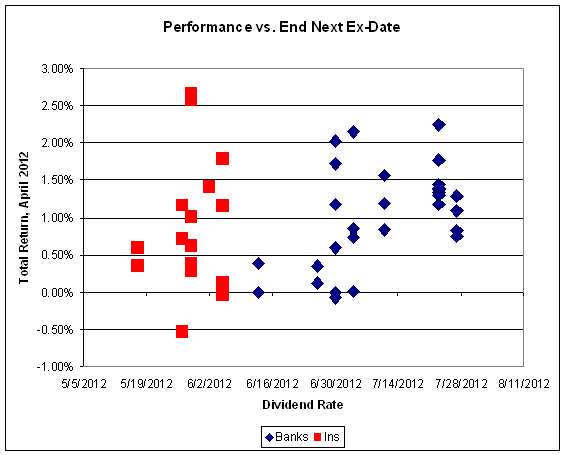
Nope. Next ex-Date?


Click for Big

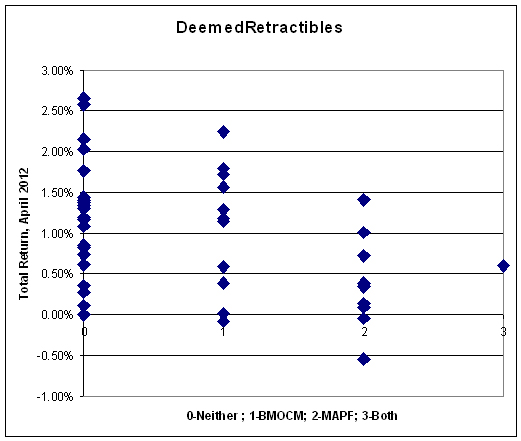
Try as I might, I am unable to to come up with a simple relationship between instrument attributes. To illustrate the effect of the performance distribution on the fund’s relative performance, I prepared the following chart which divides DeemedRetractibles into four groups, depending on their incorporation into the index and the fund’s portfolio:


Click for Big

Clearly, the fund’s securities did worse than the index’s securities. But I can figure out why! This is particularly bizarre in the case of the SLF preferreds:

SLF DeemedRetractibles
Ticker April 2012
Total Return
Current
Yield
4/30
YTW
4/30
SLF.PR.A +1.15% 4.99% 5.47%
SLF.PR.B +1.79% 5.02% 5.46%
SLF.PR.C +0.13% 4.88% 5.71%
SLF.PR.D +0.09% 4.87% 5.69%
SLF.PR.E -0.04% 4.90% 5.68%

SLF.PR.A and SLF.PR.B are incorporated in the index; SLF.PR.C, SLF.PR.D and SLF.PR.E are in the fund.
SLF

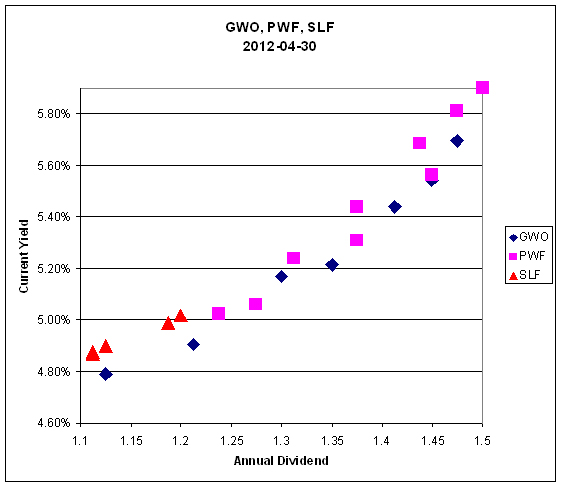
SLF DeemedRetractibles may be compared with PWF and GWO:


Click for Big

It is quite apparent that that the market continues to treat regulated issues (SLF, GWO) no differently from unregulated issues (PWF). It will also be noted that the slope of the regression line did not change significantly over the month: 0.0243 in March vs. 0.0247 in April.

Those of you who have been paying attention will remember that in a “normal” market (which we have not seen in over a year) the slope of this line is related to the implied volatility of yields in Black-Scholes theory, as discussed in the January, 2010, edition of PrefLetter. The relationship is still far too large to be explained by Implied Volatility – the numbers still indicate an overwhelming degree of directionality in the market’s price expectations.

In short, the underperformance of the fund in April appears to be due to random factors. When these random factors work in the fund’s favour, trades are generated as issues that are held become expensive relative to issues not held. This month, unfortunately, things worked the other way. However, I am pleased to observe that a large chunk of the underperformance of SLF.PR.C/D/E relative to SLF.PR.A/B has been recovered in the first four days of May.

Sometimes everything works … sometimes it’s 50-50 … sometimes nothing works. The fund seeks to earn incremental return by selling liquidity (that is, taking the other side of trades that other market participants are strongly motivated to execute), which can also be referred to as ‘trading noise’. There were a lot of strongly motivated market participants during the Panic of 2007, generating a lot of noise! Unfortunately, the conditions of the Panic may never be repeated in my lifetime … but the fund will simply attempt to make trades when swaps seem profitable, without worrying about the level of monthly turnover.

There’s plenty of room for new money left in the fund. I have shown in recent issues of PrefLetter that market pricing for FixedResets is demonstrably stupid and I have lots of confidence – backed up by my bond portfolio management experience in the markets for Canadas and Treasuries, and equity trading on the NYSE & TSX – that there is enough demand for liquidity in any market to make the effort of providing it worthwhile (although the definition of “worthwhile” in terms of basis points of outperformance changes considerably from market to market!) I will continue to exert utmost efforts to outperform but it should be borne in mind that there will almost inevitably be periods of underperformance in the future.

The yields available on high quality preferred shares remain elevated, which is reflected in the current estimate of sustainable income.

Calculation of MAPF Sustainable Income Per Unit
Month NAVPU Portfolio
Average
YTW
Leverage
Divisor
Securities
Average
YTW
Capital
Gains
Multiplier
Sustainable
Income
per
current
Unit
June, 2007 9.3114 5.16% 1.03 5.01% 1.3240 0.3524
September 9.1489 5.35% 0.98 5.46% 1.3240 0.3773
December, 2007 9.0070 5.53% 0.942 5.87% 1.3240 0.3993
March, 2008 8.8512 6.17% 1.047 5.89% 1.3240 0.3938
June 8.3419 6.034% 0.952 6.338% 1.3240 $0.3993
September 8.1886 7.108% 0.969 7.335% 1.3240 $0.4537
December, 2008 8.0464 9.24% 1.008 9.166% 1.3240 $0.5571
March 2009 $8.8317 8.60% 0.995 8.802% 1.3240 $0.5872
June 10.9846 7.05% 0.999 7.057% 1.3240 $0.5855
September 12.3462 6.03% 0.998 6.042% 1.3240 $0.5634
December 2009 10.5662 5.74% 0.981 5.851% 1.1141 $0.5549
March 2010 10.2497 6.03% 0.992 6.079% 1.1141 $0.5593
June 10.5770 5.96% 0.996 5.984% 1.1141 $0.5681
September 11.3901 5.43% 0.980 5.540% 1.1141 $0.5664
December 2010 10.7659 5.37% 0.993 5.408% 1.0298 $0.5654
March, 2011 11.0560 6.00% 0.994 5.964% 1.0298 $0.6403
June 11.1194 5.87% 1.018 5.976% 1.0298 $0.6453
September 10.2709 6.10%
Note
1.001 6.106% 1.0298 $0.6090
December, 2011 10.0793 5.63%
Note
1.031 5.805% 1.0000 $0.5851
March 10.3944 5.13%
Note
0.996 5.109% 1.0000 $0.5310
April, 2012 10.4438 5.10%
Note
1.001 5.105% 1.0000 $0.5332
NAVPU is shown after quarterly distributions of dividend income and annual distribution of capital gains.
Portfolio YTW includes cash (or margin borrowing), with an assumed interest rate of 0.00%
The Leverage Divisor indicates the level of cash in the account: if the portfolio is 1% in cash, the Leverage Divisor will be 0.99
Securities YTW divides “Portfolio YTW” by the “Leverage Divisor” to show the average YTW on the securities held; this assumes that the cash is invested in (or raised from) all securities held, in proportion to their holdings.
The Capital Gains Multiplier adjusts for the effects of Capital Gains Dividends. On 2009-12-31, there was a capital gains distribution of $1.989262 which is assumed for this purpose to have been reinvested at the final price of $10.5662. Thus, a holder of one unit pre-distribution would have held 1.1883 units post-distribution; the CG Multiplier reflects this to make the time-series comparable. Note that Dividend Distributions are not assumed to be reinvested.
Sustainable Income is the resultant estimate of the fund’s dividend income per current unit, before fees and expenses. Note that a “current unit” includes reinvestment of prior capital gains; a unitholder would have had the calculated sustainable income with only, say, 0.9 units in the past which, with reinvestment of capital gains, would become 1.0 current units.
DeemedRetractibles are comprised of all Straight Perpetuals (both PerpetualDiscount and PerpetualPremium) issued by BMO, BNS, CM, ELF, GWO, HSB, IAG, MFC, NA, RY, SLF and TD, which are not exchangable into common at the option of the company (definition refined in May). These issues are analyzed as if their prospectuses included a requirement to redeem at par on or prior to 2022-1-31, in addition to the call schedule explicitly defined. See OSFI Does Not Grandfather Extant Tier 1 Capital, CM.PR.D, CM.PR.E, CM.PR.G: Seeking NVCC Status and the January, February, March and June, 2011, editions of PrefLetter for the rationale behind this analysis.
Yields for September, 2011, to January, 2012, were calculated by imposing a cap of 10% on the yields of YLO issues held, in order to avoid their extremely high calculated yields distorting the calculation and to reflect the uncertainty in the marketplace that these yields will be realized. Commencing February, 2012, yields on these issues have been set to zero.

Significant positions were held in DeemedRetractible and FixedReset issues on March 30; all of these currently have their yields calculated with the presumption that they will be called by the issuers at par prior to 2022-1-31. This presents another complication in the calculation of sustainable yield. The fund also holds a position in SplitShare issues (BNA.PR.C) which also have their yields calculated with the expectation of a maturity at par.

I will no longer show calculations that assume the conversion of the entire portfolio into PerpetualDiscounts, as there are currently only eight such issues of investment grade, from only four issuer groups. Additionally, the fund has only negligible holdings of these issues.

Different assumptions lead to different results from the calculation, but the overall positive trend is apparent. I’m very pleased with the long-term results! It will be noted that if there was no trading in the portfolio, one would expect the sustainable yield to be constant (before fees and expenses). The success of the fund’s trading is showing up in

  • the very good performance against the index
  • the long term increases in sustainable income per unit

As has been noted, the fund has maintained a credit quality equal to or better than the index; outperformance is due to constant exploitation of trading anomalies.

Again, there are no predictions for the future! The fund will continue to trade between issues in an attempt to exploit market gaps in liquidity, in an effort to outperform the index and keep the sustainable income per unit – however calculated! – growing.
MAPF Portfolio Composition: April 2012

Saturday, May 5th, 2012

Turnover declined sharply in April, to about 5%.

Sectoral distribution of the MAPF portfolio on April 30 was as follows:

MAPF Sectoral Analysis 2012-4-30
HIMI Indices Sector Weighting YTW ModDur
Ratchet 0% N/A N/A
FixFloat 0% N/A N/A
Floater 0% N/A N/A
OpRet 0% N/A N/A
SplitShare 9.6% (-0.2) 5.96% 5.67
Interest Rearing 0% N/A N/A
PerpetualPremium 0.0% (0) N/A N/A
PerpetualDiscount 0.3% (-0.5) 5.08% 15.31
Fixed-Reset 18.8% (-1.6) 2.89% 1.99
Deemed-Retractible 61.6% (+2.1) 5.44% 7.33
Scraps (Various) 9.6% (-0.4) 6.42% (see note) 11.86 (see note)
Cash +0.1% (+0.5) 0.00% 0.00
Total 100% 5.10% 6.62
Yields for the YLO preferreds have been set at 0% for calculation purposes, and their durations at 0.00, to the the company’s decision to suspend preferred dividends.
Totals and changes will not add precisely due to rounding. Bracketted figures represent change from March month-end. Cash is included in totals with duration and yield both equal to zero.
DeemedRetractibles are comprised of all Straight Perpetuals (both PerpetualDiscount and PerpetualPremium) issued by BMO, BNS, CM, ELF, GWO, HSB, IAG, MFC, NA, RY, SLF and TD, which are not exchangable into common at the option of the company. These issues are analyzed as if their prospectuses included a requirement to redeem at par on or prior to 2022-1-31, in addition to the call schedule explicitly defined. See OSFI Does Not Grandfather Extant Tier 1 Capital, CM.PR.D, CM.PR.E, CM.PR.G: NVCC Status Confirmed and the January, February, March and June, 2011, editions of PrefLetter for the rationale behind this analysis.

The “total” reflects the un-leveraged total portfolio (i.e., cash is included in the portfolio calculations and is deemed to have a duration and yield of 0.00.). MAPF will often have relatively large cash balances, both credit and debit, to facilitate trading. Figures presented in the table have been rounded to the indicated precision.

Credit distribution is:

MAPF Credit Analysis 2012-4-30
DBRS Rating Weighting
Pfd-1 0 (0)
Pfd-1(low) 51.9% (-1.3)
Pfd-2(high) 28.4% (+1.7)
Pfd-2 0 (0)
Pfd-2(low) 10.0% (-0.6)
Pfd-3(high) 1.0% (-0.1)
Pfd-3 2.4% (-3.5)
Pfd-4(high) 3.5% (+3.5)
Pfd-4 2.3% (-0.2)
Pfd-5(low) 0.3% (-0.1)
Cash -0.4% (-0.3)
Totals will not add precisely due to rounding. Bracketted figures represent change from March month-end.
A position held in CSE preferreds has been assigned to Pfd-4(high)

Liquidity Distribution is:

MAPF Liquidity Analysis 2012-4-30
Average Daily Trading Weighting
<$50,000 10.5% (+10.4)
$50,000 – $100,000 19.2% (-9.2)
$100,000 – $200,000 27.2% (+1.2)
$200,000 – $300,000 27.1% (+7.8)
>$300,000 15.9% (-10.6)
Cash +0.1% (+0.5)
Totals will not add precisely due to rounding. Bracketted figures represent change from March month-end.

The increase in holdings of issue with Average Daily Trading Values(ADTVs) of 50,000-100,000 is due mostly to migration, rather than trading: IAG.PR.A, for instance, had an ADTV of about 54,000 last month and only 44,000 this month.

Similarly, the increase in the 200,000-300,000 bracket is due to migration: MFC.PR.B, for example, had an ADTV of 318,000 last month, which has now declined to 240,000.

MAPF is, of course, Malachite Aggressive Preferred Fund, a “unit trust” managed by Hymas Investment Management Inc. Further information and links to performance, audited financials and subscription information are available the fund’s web page. The fund may be purchased either directly from Hymas Investment Management or through a brokerage account at Odlum Brown Limited. A “unit trust” is like a regular mutual fund, but is sold by offering memorandum rather than prospectus. This is cheaper, but means subscription is restricted to “accredited investors” (as defined by the Ontario Securities Commission) or those who subscribe for $150,000+. Fund past performances are not a guarantee of future performance. You can lose money investing in MAPF or any other fund.

A similar portfolio composition analysis has been performed on the Claymore Preferred Share ETF (symbol CPD) as of August 31, 2011, and published in the October, 2011, PrefLetter. While direct comparisons are difficult due to the introduction of the DeemedRetractible class of preferred share (see above) it is fair to say:

  • MAPF credit quality is better
  • MAPF liquidity is a lower
  • MAPF Yield is higher
  • Weightings in
    • MAPF is much more exposed to DeemedRetractibles
    • MAPF is much less exposed to Operating Retractibles
    • MAPF is much more exposed to SplitShares
    • MAPF is less exposed to FixFloat / Floater / Ratchet
    • MAPF weighting in FixedResets is much lower

May 4, 2012

Friday, May 4th, 2012

There are tentative advances in exchange trading for corporate bonds:

Goldman Sachs Group Inc. (GS) will start an electronic trading system for corporate bonds this month as the fifth-biggest U.S. bank adapts to regulatory changes and competition, according to a person familiar with the plans.

The platform, called GSessions, has been under development for a year, said the person, who declined to be identified because the New York-based firm isn’t making details public yet. The Wall Street Journal reported the initiative late yesterday on its website.

The move comes three weeks after BlackRock Inc. (BLK), the world’s largest money manager, said it was planning its own bond-trading platform called Aladdin Trading Network that would allow clients to bypass Wall Street firms such as Goldman Sachs.

The profitability of Wall Street firms is being challenged by regulations requiring that they hold more capital as a buffer against potential losses from assets such as corporate debt. A U.S. law that seeks to prohibit federally insured banks from making bets with their own money may also hinder lenders’ ability to commit money to buy securities from clients, according to analysts including Brad Hintz at Sanford C. Bernstein & Co.

GSessions will start by offering two five-minute trading sessions a day, one in an investment-grade bond and another in a high-yield, high-risk security, the person said. Speculative- grade, or junk, bonds are rated below Baa3 by Moody’s Investors Service and lower than BBB- at Standard & Poor’s.

At the start of each session, Goldman Sachs will post a bid and offer price and notify clients of the maximum amount of liquidity the firm is willing to provide to fill orders, according to the person.

Rather than matching trades between clients, Goldman Sachs will act as the counterparty to all trades and collect the spread, or difference, between the bid and offer prices, the person said. That gap will be lower than what Goldman Sachs earns on non-computerized trades, the person said.

As I have said many, many times on this blog, exchange trading for corporate bonds will lead to tighter, more brittle markets and be bad for capital formation – to the extent that instruments are listed. In the States, especially, the action has moved into the private-placement and CDS markets, to avoid regulatory bullshit and get on with the job. However, the regulator who cares about the actual purpose of capital markets has not yet been born.

I have often criticized the entire concept of a B.Comm. degree (a guy with a B.Comm. is a guy who wanted to learn about business, so he went to school. Strike one.). Seems that others share my disdain:

Yahoo! Inc. (YHOO) is under pressure from Third Point LLC, one of its largest investors, to dismiss Chief Executive Officer Scott Thompson after his academic computer science credentials were misrepresented.

Martin McGovern, a spokesman for Stonehill in Easton, Massachusetts, said that Thompson received a bachelor’s of science in business administration, with a major in accounting on May 20, 1979. He declined to comment further.

Loeb said that Patti Hart, a Yahoo board member who chairs the search committee, inflated her degree too. Hart, who also serves as CEO of International Game Technology (IGT), is listed in filings as holding a “bachelor’s degree in marketing and economics” from Illinois State University, Loeb said. “However, we understand that Ms. Hart’s degree is in business administration. She received a degree in neither marketing nor economics.”

Today’s PrefBlog Precious Little Do-Gooder Zinger is about donating eye-glasses:

In a paper published in March in the journal Optometry and Vision Science, four researchers compare the full costs of delivering used glasses to the costs of instead delivering ready-made glasses in standard powers (like my drugstore readers, but for myopia as well). The authors find that recycled glasses cost nearly twice as much per usable pair.

Rob Carrick has a piece up titled Preferred shares: How to navigate rising rates, but I’m not quoted.

There was a slight pullback in the Canadian preferred share market today, with PerpetualDiscounts off 1bp, FixedResets down 7bp and DeemedRetractibles losing 8bp. Volatility was minimal. Volume was extremely low.

HIMIPref™ Preferred Indices
These values reflect the December 2008 revision of the HIMIPref™ Indices

Values are provisional and are finalized monthly
Index Mean
Current
Yield
(at bid)
Median
YTW
Median
Average
Trading
Value
Median
Mod Dur
(YTW)
Issues Day’s Perf. Index Value
Ratchet 0.00 % 0.00 % 0 0.00 0 -1.4780 % 2,505.6
FixedFloater 4.36 % 3.72 % 29,490 17.89 1 -0.2288 % 3,617.6
Floater 2.88 % 2.88 % 56,038 20.02 3 -1.4780 % 2,705.4
OpRet 4.75 % 2.36 % 52,294 1.12 5 0.0765 % 2,511.1
SplitShare 5.23 % 4.04 % 64,168 0.62 4 -0.2119 % 2,700.2
Interest-Bearing 0.00 % 0.00 % 0 0.00 0 0.0765 % 2,296.2
Perpetual-Premium 5.43 % -1.15 % 78,783 0.09 25 -0.0078 % 2,233.7
Perpetual-Discount 5.06 % 5.06 % 89,733 15.20 8 0.0359 % 2,446.7
FixedReset 5.03 % 3.04 % 189,110 2.16 68 -0.0715 % 2,402.2
Deemed-Retractible 4.95 % 3.61 % 181,430 1.43 45 -0.0825 % 2,329.6
Performance Highlights
Issue Index Change Notes
BAM.PR.C Floater -2.72 % YTW SCENARIO
Maturity Type : Limit Maturity
Maturity Date : 2042-05-04
Maturity Price : 17.90
Evaluated at bid price : 17.90
Bid-YTW : 2.95 %
IAG.PR.E Deemed-Retractible -1.21 % YTW SCENARIO
Maturity Type : Call
Maturity Date : 2018-12-31
Maturity Price : 25.00
Evaluated at bid price : 26.06
Bid-YTW : 5.37 %
Volume Highlights
Issue Index Shares
Traded
Notes
MFC.PR.G FixedReset 97,745 TD crossed 12,300 at 25.60. Nesbitt corssed 74,800 at 25.55.
YTW SCENARIO
Maturity Type : Call
Maturity Date : 2016-12-19
Maturity Price : 25.00
Evaluated at bid price : 25.45
Bid-YTW : 4.12 %
BNS.PR.Z FixedReset 71,310 Desjardins crossed 50,000 at 25.14 and sold 16,500 to GMP at the same price.
YTW SCENARIO
Maturity Type : Hard Maturity
Maturity Date : 2022-01-31
Maturity Price : 25.00
Evaluated at bid price : 25.12
Bid-YTW : 3.21 %
BAM.PF.A FixedReset 52,005 RBC crossed 50,000 at 25.40.
YTW SCENARIO
Maturity Type : Call
Maturity Date : 2018-09-30
Maturity Price : 25.00
Evaluated at bid price : 25.45
Bid-YTW : 4.32 %
MFC.PR.H FixedReset 51,100 RBC crossed 50,000 at 25.85.
YTW SCENARIO
Maturity Type : Call
Maturity Date : 2017-03-19
Maturity Price : 25.00
Evaluated at bid price : 25.85
Bid-YTW : 4.05 %
ENB.PR.H FixedReset 22,495 YTW SCENARIO
Maturity Type : Limit Maturity
Maturity Date : 2042-05-04
Maturity Price : 23.27
Evaluated at bid price : 25.56
Bid-YTW : 3.58 %
BAM.PR.B Floater 20,677 YTW SCENARIO
Maturity Type : Limit Maturity
Maturity Date : 2042-05-04
Maturity Price : 18.36
Evaluated at bid price : 18.36
Bid-YTW : 2.88 %
There were 14 other index-included issues trading in excess of 10,000 shares.
Wide Spread Highlights
Issue Index Quote Data and Yield Notes
BAM.PR.C Floater Quote: 17.90 – 18.49
Spot Rate : 0.5900
Average : 0.3627

YTW SCENARIO
Maturity Type : Limit Maturity
Maturity Date : 2042-05-04
Maturity Price : 17.90
Evaluated at bid price : 17.90
Bid-YTW : 2.95 %

BNS.PR.K Deemed-Retractible Quote: 25.66 – 26.06
Spot Rate : 0.4000
Average : 0.3044

YTW SCENARIO
Maturity Type : Call
Maturity Date : 2012-06-03
Maturity Price : 25.50
Evaluated at bid price : 25.66
Bid-YTW : -1.97 %

BAM.PR.X FixedReset Quote: 25.01 – 25.25
Spot Rate : 0.2400
Average : 0.1563

YTW SCENARIO
Maturity Type : Limit Maturity
Maturity Date : 2042-05-04
Maturity Price : 23.15
Evaluated at bid price : 25.01
Bid-YTW : 3.58 %

IAG.PR.E Deemed-Retractible Quote: 26.06 – 26.39
Spot Rate : 0.3300
Average : 0.2516

YTW SCENARIO
Maturity Type : Call
Maturity Date : 2018-12-31
Maturity Price : 25.00
Evaluated at bid price : 26.06
Bid-YTW : 5.37 %

TCA.PR.X Perpetual-Premium Quote: 52.25 – 52.49
Spot Rate : 0.2400
Average : 0.1718

YTW SCENARIO
Maturity Type : Call
Maturity Date : 2013-10-15
Maturity Price : 50.00
Evaluated at bid price : 52.25
Bid-YTW : 2.48 %

HSE.PR.A FixedReset Quote: 26.09 – 26.30
Spot Rate : 0.2100
Average : 0.1420

YTW SCENARIO
Maturity Type : Limit Maturity
Maturity Date : 2042-05-04
Maturity Price : 23.58
Evaluated at bid price : 26.09
Bid-YTW : 3.21 %

May 3, 2012

Thursday, May 3rd, 2012

What a great solution for the TMX / Maple deal! More rules!

The Ontario Securities Commission will impose share ownership restrictions and require an independent board of directors as conditions of its approval of the takeover of the Toronto Stock Exchange.

Among its proposed conditions for approving the bid, the OSC rules would prohibit any person or company from owning more than 10 per cent of the voting shares of Maple Group without OSC prior approval.

The original shareholders of Maple Group are also required to certify annually to the OSC that they are not acting “jointly or in concert with any other investor” in respect to Maple’s voting shares.

The rules also require Maple’s board to have at least 50 per cent of its directors unrelated to the original Maple shareholders and unrelated to management of the company. One director must represent an independent, non-bank owned investment dealer, and the chairman of the board must be both independent and unrelated to the original Maple shareholders.

Maple’s shareholders are a group of 13 major Canadian financial institutions and pension funds.

Why would the banks bother to act in concert? Their interests are identical anyway. There is some oohing and ahhing over the cost recovery model:

Even if Maple succeeds in buying TMX and CDS, it will still be forced to continue paying rebates. What’s more, Maple will have to share some of the synergies it expects to get from the transaction with market users, according to the pricing model, which is now being made public for the first time by the OSC.

Starting on Nov. 1, a Maple-owned CDS will split any annual revenue gains on the current suite of CDS clearing services 50-50 with users. That continues indefinitely.

On top of that, the so-called “integration rebate” to market users starts at $2.75-million and rises to $4-million by 2016. The fee will be capped at that level after 2016, but it will continue in future years.

It’s supposed to reflect the cost-savings Maple extracts. But interestingly, it’s not conditional on Maple actually saving money. So CDS users get paid no matter whether Maple manages to find synergies or not.

All of this means Maple will have to really deliver on its original promise — to make money from CDS not by raising fees for existing services but by creating new services that it can charge for. Those new services won’t be subject to the revenue sharing. However, even there, regulators are not making it easy on Maple.

Buddy, what it probably means is that fees will be charged so that fixed costs for participants are higher and marginal costs are lower. This will enlarge the moat that protects the oligopoly.

I often feel like Cassandra when worrying about the risks of the Canadian financial system, so it’s nice to know that somebody shares my views:

Canada’s biggest banks likely are “too big to fail,” and therefore pose a risk to the country’s financial system, says Malcolm Knight, a former No. 2 at the Bank of Canada.

Canada’s five biggest banks hold combined assets worth $2.8-trillion, twice the size of the country’s gross domestic product.

That outsized economic weight makes them a threat to financial stability because the collapse of any of them would take a toll on hundreds of thousands of customers, on competition in financial services, and on the country’s reputation as a safe place to invest, Mr. Knight says.

Canada’s strict regulatory system makes the banks “less likely to fail,” but failure isn’t impossible, no matter how well the country weathered the financial crisis.

“Canada’s strict regulatory system”. We’re always hearing about that. The main thing is that OSFI simply sticks a little extra onto regulatory capital requirements – there’s nothing clever about that. What would be clever is is there was ever any accounting made for the costs of this – and I don’t mean picayune things like the service fees that help pay for all that capital. There’s things like mortgage spreads, the preponderance of short term mortgages, subsidies of tail risk by the CMHC, the stultifying effect of the oligopoly … there are many costs, none of which are ever examined.

I sent an eMail recently:

Sirs,

The Toronto Star recently published an article titled “Pediatricians in Canada discharging unvaccinated children” (April 25, on-line at http://www.thestar.com/living/article/1167428–pediatricians-in-canada-discharging-unvaccinated-children)

In this article it is alleged that the behaviour highlighted by the headline is indulged in by Dr. Fatima Kamalia and condoned by Dr. Hirotaka Yamashiro, who holds a position with the Ontario Medical Association. The CPSO is stated to take the position that “Doctors have the right to end a relationship with a patient when there is a ‘breakdown of trust and respect'”.

The arrogance shown by these medical personnel shows that they have confused the award of a medical diploma with ascension to divinity. Their interpretation of CPSO policies in a manner that equates the right to refuse medical treatment with a ‘breakdown of trust and respect’ is breathtaking; it makes a mockery of CPSO Policy #4-05 “Consent to Medical Treatment”.

Additionally, the attitude of these so-called professionals that they are infallible on pediatric care may well be misplaced, although the consensus is currently in their favour. As one who was born in England in June, 1961, I am keenly aware that consensus can be incorrect even with respect to something so straightforward as morning sickness; I remain grateful that my mother ignored doctor’s advice regarding remediation for the condition. I am pleased to pursue an occupation and lifestyle that, astonishingly, does not increase my risk of contracting peptic ulcer disease.

The desire of Drs. Kamalia & Yamashiro to restrict their practice to include only those individuals who show proper reverence for their pronouncements ex cathedra is understandable; if they wish to pick and choose their clientele, I suggest they make a living in a competitive environment – not in Ontario, where rationing effectively provides them with a very nice job for life on the taxpayers’ nickel.

I strongly urge the CPSO to initiate an investigation of the abuse of privilege endorsed or indulged in by these doctors, to condemn in the strongest possible manner the bizarre interpretation of the ‘breakdown in trust and respect’ guideline and to uphold the right to refuse treatment.

Sincerely,

I also see that there is an unsigned opinion piece in The Star:

While the College of Physicians and Surgeons of Ontario has no specific policy on the immunization issue, it does have one on severing ties. “In general, a physician should not end the physician-patient relationship because the patient chooses not to follow the physician’s advice,” it says. That’s the patient’s right.

The American Academy of Pediatrics and its bioethics committee have developed guidelines on dealing with these vexing cases.

“In general, pediatricians should avoid discharging patients from their practices solely because a parent refuses to immunize his or her child,” the guideline states.

“Families with doubts about immunization should still have access to good medical care, and maintaining the relationship in the face of disagreement conveys respect and at the same time allows the child access to medical care. Furthermore, a continuing relationship allows additional opportunity to discuss the issue of immunization over time.”

Veresen, proud issuer of VSN.PR.A, was confirmed at Pfd-3(high) / Stable by DBRS:

DBRS has today confirmed the Senior Unsecured Notes and the Preferred Shares of Veresen Inc. (Veresen or the Company) at BBB (high) and Pfd-3 (high), respectively, both with Stable trends. The confirmation reflects (1) relatively stable cash flow from the Company’s regulated pipeline businesses, which accounted for approximately 56% of Veresen’s 2011 cash distributions received from its subsidiaries; (2) diversification benefits from its midstream (35% of cash distributions) and power generation businesses (9% of cash distributions), supported by long-term contracts with mostly investment-grade counterparts; and (3) solid non-consolidated cash flow ratios – albeit high non-consolidated leverage – at the parent level following the closing of the $920 million acquisition of the Hythe/Steeprock complex (the Acquisition) from Encana Corporation (Encana) in February 2012, which DBRS viewed as a credit neutral event for Veresen.

It was a mixed day for the Canadian preferred share market, with PerpetualPremiums gaining 6bp, FixedResets down 6bp and DeemedRetractibles up 2bp. Volatility was non-existent. Volume was quite low.

HIMIPref™ Preferred Indices
These values reflect the December 2008 revision of the HIMIPref™ Indices

Values are provisional and are finalized monthly
Index Mean
Current
Yield
(at bid)
Median
YTW
Median
Average
Trading
Value
Median
Mod Dur
(YTW)
Issues Day’s Perf. Index Value
Ratchet 0.00 % 0.00 % 0 0.00 0 0.0722 % 2,543.2
FixedFloater 4.35 % 3.71 % 29,759 17.91 1 0.2294 % 3,625.9
Floater 2.84 % 2.85 % 51,857 20.10 3 0.0722 % 2,746.0
OpRet 4.75 % 2.58 % 52,983 1.12 5 -0.0612 % 2,509.2
SplitShare 5.22 % 1.47 % 64,595 0.62 4 0.4107 % 2,705.9
Interest-Bearing 0.00 % 0.00 % 0 0.00 0 -0.0612 % 2,294.4
Perpetual-Premium 5.43 % -2.47 % 81,437 0.09 25 0.0561 % 2,233.9
Perpetual-Discount 5.06 % 5.03 % 90,848 15.30 8 0.3194 % 2,445.8
FixedReset 5.03 % 2.98 % 191,583 2.12 68 -0.0580 % 2,403.9
Deemed-Retractible 4.94 % 3.34 % 180,703 1.03 45 0.0217 % 2,331.5
Performance Highlights
Issue Index Change Notes
No individual gains or losses exceeding 1%!
Volume Highlights
Issue Index Shares
Traded
Notes
GWO.PR.J FixedReset 158,102 RBC crossed blocks of 100,000 and 51,500, both at 26.30.
YTW SCENARIO
Maturity Type : Call
Maturity Date : 2013-12-31
Maturity Price : 25.00
Evaluated at bid price : 26.30
Bid-YTW : 3.11 %
MFC.PR.A OpRet 140,905 TD crossed 34,600 at 25.80; Nesbitt crossed 99,000 at 25.80.
YTW SCENARIO
Maturity Type : Soft Maturity
Maturity Date : 2015-12-18
Maturity Price : 25.00
Evaluated at bid price : 25.79
Bid-YTW : 3.33 %
BMO.PR.P FixedReset 102,571 RBC crossed 49,000 at 26.50; TD crossed 48,200 at the same price.
YTW SCENARIO
Maturity Type : Call
Maturity Date : 2015-02-25
Maturity Price : 25.00
Evaluated at bid price : 26.53
Bid-YTW : 3.01 %
TD.PR.E FixedReset 86,767 National crossed 79,200 at 26.80.
YTW SCENARIO
Maturity Type : Call
Maturity Date : 2014-04-30
Maturity Price : 25.00
Evaluated at bid price : 26.61
Bid-YTW : 2.94 %
BNS.PR.Z FixedReset 65,086 Desjardins crossed two blocks of 25,000 each, both at 25.10.
YTW SCENARIO
Maturity Type : Hard Maturity
Maturity Date : 2022-01-31
Maturity Price : 25.00
Evaluated at bid price : 25.06
Bid-YTW : 3.24 %
SLF.PR.G FixedReset 55,841 Scotia crossed 25,000 at 25.00.
YTW SCENARIO
Maturity Type : Hard Maturity
Maturity Date : 2022-01-31
Maturity Price : 25.00
Evaluated at bid price : 24.95
Bid-YTW : 3.54 %
There were 19 other index-included issues trading in excess of 10,000 shares.
Wide Spread Highlights
Issue Index Quote Data and Yield Notes
FTS.PR.H FixedReset Quote: 25.85 – 26.24
Spot Rate : 0.3900
Average : 0.2590

YTW SCENARIO
Maturity Type : Limit Maturity
Maturity Date : 2042-05-03
Maturity Price : 23.63
Evaluated at bid price : 25.85
Bid-YTW : 2.96 %

POW.PR.A Perpetual-Premium Quote: 25.42 – 25.75
Spot Rate : 0.3300
Average : 0.2159

YTW SCENARIO
Maturity Type : Call
Maturity Date : 2012-06-02
Maturity Price : 25.00
Evaluated at bid price : 25.42
Bid-YTW : -11.04 %

NA.PR.P FixedReset Quote: 26.80 – 27.10
Spot Rate : 0.3000
Average : 0.2013

YTW SCENARIO
Maturity Type : Call
Maturity Date : 2014-02-15
Maturity Price : 25.00
Evaluated at bid price : 26.80
Bid-YTW : 2.35 %

TRP.PR.C FixedReset Quote: 25.71 – 25.95
Spot Rate : 0.2400
Average : 0.1568

YTW SCENARIO
Maturity Type : Limit Maturity
Maturity Date : 2042-05-03
Maturity Price : 23.50
Evaluated at bid price : 25.71
Bid-YTW : 3.08 %

BMO.PR.K Deemed-Retractible Quote: 26.30 – 26.48
Spot Rate : 0.1800
Average : 0.1094

YTW SCENARIO
Maturity Type : Call
Maturity Date : 2012-11-25
Maturity Price : 26.00
Evaluated at bid price : 26.30
Bid-YTW : 2.43 %

BNS.PR.K Deemed-Retractible Quote: 25.72 – 25.99
Spot Rate : 0.2700
Average : 0.1995

YTW SCENARIO
Maturity Type : Call
Maturity Date : 2012-06-02
Maturity Price : 25.50
Evaluated at bid price : 25.72
Bid-YTW : -4.92 %

BCE.PR.F Secondary Offering

Thursday, May 3rd, 2012

I am advised by multiple authoritative sources that there is a secondary offering under way (or is it “under weigh”? You can find much furious discussion of this on the web) for 2-million shares of BCE.PR.F, offered at 23.75.

The issue closed today at 23.95-98, 12×177. This is a wonderful issue for analysis, because there are so many ways of looking at comparators, but the easiest is its Strong Pair BCE.PR.E, a RatchetRate preferred. The two issues are interconvertible on 2015-2-15 and every five years thereafter. Until then BCE.PR.F pays a fixed 4.541% of par. while BCE.PR.E pays 100% of Canadian Prime, although this may be reduced if the price goes above 25.00.

BCE.PR.E closed today at 22.40-50 on less than a board lot traded; we can use this price for comparison purposes since it is close to the other BCE RatchetRates. The Pairs Equivalency Calculator (quick method) tells us that given a price of 22.40 on BCE.PR.E and 23.75 on BCE.PR.F, Canada Prime should average 2.32% until the February, 2015, Exchange Date for the total return on the two issues to be equal.

Seeing as Canada Prime is now 3.00% and is forecast to rise, if anything, over the next three years, BCE.PR.F looks grossly expensive at 23.75. I suspect that it is trading on the basis of its Current Yield of 4.78% and that the market is, as usual, ignoring conversion and dividend reset probabilities.

BCE.PR.F was last mentioned on PrefBlog when there was a secondary offering three-odd months ago. BCE.PR.F is tracked by HIMIPref™ but is relegated to the Scraps index on credit concerns.

May 2, 2012

Wednesday, May 2nd, 2012

Nothing happened today.

There were solid gains in the Canadian preferred share market today, with both PerpetualPremiums and FixedResets up 10bp and DeemedRetractibles winning 21bp. Volatility, as reported by the Performance Highlights table, was virtually non-existent. Volume was comfortably above average.

HIMIPref™ Preferred Indices
These values reflect the December 2008 revision of the HIMIPref™ Indices

Values are provisional and are finalized monthly
Index Mean
Current
Yield
(at bid)
Median
YTW
Median
Average
Trading
Value
Median
Mod Dur
(YTW)
Issues Day’s Perf. Index Value
Ratchet 0.00 % 0.00 % 0 0.00 0 0.2532 % 2,541.4
FixedFloater 4.36 % 3.72 % 30,948 17.90 1 0.0000 % 3,617.6
Floater 2.84 % 2.85 % 48,299 20.08 3 0.2532 % 2,744.0
OpRet 4.75 % 2.60 % 53,218 1.12 5 0.0000 % 2,510.8
SplitShare 5.24 % 3.10 % 67,233 0.62 4 0.0495 % 2,694.8
Interest-Bearing 0.00 % 0.00 % 0 0.00 0 0.0000 % 2,295.8
Perpetual-Premium 5.43 % -0.08 % 84,786 0.09 25 0.0967 % 2,232.6
Perpetual-Discount 5.08 % 5.04 % 91,702 15.26 8 0.0825 % 2,438.1
FixedReset 5.03 % 2.95 % 181,401 2.12 68 0.0969 % 2,405.3
Deemed-Retractible 4.94 % 3.51 % 184,546 1.44 45 0.2089 % 2,331.0
Performance Highlights
Issue Index Change Notes
CU.PR.B Perpetual-Premium 1.16 % YTW SCENARIO
Maturity Type : Call
Maturity Date : 2012-06-01
Maturity Price : 25.00
Evaluated at bid price : 26.10
Bid-YTW : -31.40 %
Volume Highlights
Issue Index Shares
Traded
Notes
CM.PR.K FixedReset 263,581 Desjardins crossed blocks of 48,700 shares, 101,700 and 100,000, all at 26.35.
YTW SCENARIO
Maturity Type : Call
Maturity Date : 2014-07-31
Maturity Price : 25.00
Evaluated at bid price : 26.36
Bid-YTW : 2.87 %
ENB.PR.H FixedReset 104,594 Nesbitt crossed 50,000 at 25.50; RBC crossed 25,000 at the same price.
YTW SCENARIO
Maturity Type : Limit Maturity
Maturity Date : 2042-05-02
Maturity Price : 23.26
Evaluated at bid price : 25.51
Bid-YTW : 3.58 %
MFC.PR.A OpRet 103,322 Desjardins crossed 48,000 at 25.80; TD crossed 50,000 at the same price.
YTW SCENARIO
Maturity Type : Soft Maturity
Maturity Date : 2015-12-18
Maturity Price : 25.00
Evaluated at bid price : 25.81
Bid-YTW : 3.30 %
BNS.PR.Z FixedReset 78,223 RBC crossed 63,900 at 25.10.
YTW SCENARIO
Maturity Type : Hard Maturity
Maturity Date : 2022-01-31
Maturity Price : 25.00
Evaluated at bid price : 25.07
Bid-YTW : 3.23 %
RY.PR.R FixedReset 72,251 Desjardins crossed blocks of 24,300 and 25,000, both at 26.40; TD crossed 20,000 at the same price.
YTW SCENARIO
Maturity Type : Call
Maturity Date : 2014-02-24
Maturity Price : 25.00
Evaluated at bid price : 26.38
Bid-YTW : 2.90 %
BAM.PR.R FixedReset 62,230 Scotia crossed blocks of 18,900 and 30,000, both at 26.00.
YTW SCENARIO
Maturity Type : Limit Maturity
Maturity Date : 2042-05-02
Maturity Price : 23.53
Evaluated at bid price : 26.00
Bid-YTW : 3.91 %
There were 37 other index-included issues trading in excess of 10,000 shares.
Wide Spread Highlights
Issue Index Quote Data and Yield Notes
BAM.PR.M Perpetual-Discount Quote: 23.41 – 23.88
Spot Rate : 0.4700
Average : 0.3098

YTW SCENARIO
Maturity Type : Limit Maturity
Maturity Date : 2042-05-02
Maturity Price : 23.16
Evaluated at bid price : 23.41
Bid-YTW : 5.12 %

BMO.PR.Q FixedReset Quote: 25.62 – 25.87
Spot Rate : 0.2500
Average : 0.1533

YTW SCENARIO
Maturity Type : Hard Maturity
Maturity Date : 2022-01-31
Maturity Price : 25.00
Evaluated at bid price : 25.62
Bid-YTW : 2.97 %

RY.PR.A Deemed-Retractible Quote: 25.65 – 25.90
Spot Rate : 0.2500
Average : 0.1664

YTW SCENARIO
Maturity Type : Call
Maturity Date : 2014-05-24
Maturity Price : 25.25
Evaluated at bid price : 25.65
Bid-YTW : 3.48 %

BAM.PR.T FixedReset Quote: 25.40 – 25.60
Spot Rate : 0.2000
Average : 0.1277

YTW SCENARIO
Maturity Type : Limit Maturity
Maturity Date : 2042-05-02
Maturity Price : 23.30
Evaluated at bid price : 25.40
Bid-YTW : 3.87 %

CU.PR.A Perpetual-Premium Quote: 25.76 – 26.00
Spot Rate : 0.2400
Average : 0.1784

YTW SCENARIO
Maturity Type : Call
Maturity Date : 2012-06-01
Maturity Price : 25.00
Evaluated at bid price : 25.76
Bid-YTW : -17.95 %

W.PR.J Perpetual-Premium Quote: 25.28 – 25.45
Spot Rate : 0.1700
Average : 0.1090

YTW SCENARIO
Maturity Type : Call
Maturity Date : 2012-06-01
Maturity Price : 25.00
Evaluated at bid price : 25.28
Bid-YTW : -4.76 %

May 1, 2012

Wednesday, May 2nd, 2012

There’s some sabre rattling from the Fed:

Federal Reserve Bank of Richmond President Jeffrey Lacker said the central bank needs to be ready to raise interest rates even if joblessness exceeds 7 percent.

Speaking in an interview today at the Bloomberg Washington Summit hosted by Bloomberg Link, he said the Fed will probably have to raise rates in mid-2013. Adding more monetary stimulus now would raise inflation risks without doing much to boost growth, he said.

Unemployment “could well be above 7 percent, and I think we have to prepare for that,” Lacker said. “I think it’s a misconception to think we have to get unemployment all the way down to five or some number like that before we raise rates.”

Lacker has cast the only dissenting vote at each of the Federal Open Market Committee’s policy meetings this year. He has opposed the Fed’s statement that economic conditions will probably warrant “exceptionally low” levels of the federal funds rate at least through late-2014.

It was a strong day for the Canadian preferred share market, with PerpetualPremiums up 23bp, FixedResets gaining 8bp and DeemedRetractibles winning 39bp. The Performance Highlights table is comprised entirely of winners, with a preponderance of insurance DeemedRetractibles. Volume was high.

HIMIPref™ Preferred Indices
These values reflect the December 2008 revision of the HIMIPref™ Indices

Values are provisional and are finalized monthly
Index Mean
Current
Yield
(at bid)
Median
YTW
Median
Average
Trading
Value
Median
Mod Dur
(YTW)
Issues Day’s Perf. Index Value
Ratchet 0.00 % 0.00 % 0 0.00 0 0.5455 % 2,535.0
FixedFloater 4.36 % 3.72 % 32,185 17.90 1 1.8692 % 3,617.6
Floater 2.85 % 2.86 % 48,708 20.07 3 0.5455 % 2,737.1
OpRet 4.75 % 2.71 % 53,502 1.13 5 -0.0917 % 2,510.8
SplitShare 5.25 % 4.28 % 68,049 0.62 4 0.0495 % 2,693.5
Interest-Bearing 0.00 % 0.00 % 0 0.00 0 -0.0917 % 2,295.8
Perpetual-Premium 5.44 % 0.69 % 85,182 0.09 25 0.2268 % 2,230.5
Perpetual-Discount 5.08 % 5.06 % 90,690 15.31 8 0.2325 % 2,436.1
FixedReset 5.03 % 2.99 % 186,717 2.17 68 0.0778 % 2,403.0
Deemed-Retractible 4.95 % 3.59 % 187,353 1.58 45 0.3931 % 2,326.2
Performance Highlights
Issue Index Change Notes
SLF.PR.E Deemed-Retractible 1.00 % YTW SCENARIO
Maturity Type : Hard Maturity
Maturity Date : 2022-01-31
Maturity Price : 25.00
Evaluated at bid price : 23.19
Bid-YTW : 5.55 %
CM.PR.D Perpetual-Premium 1.01 % YTW SCENARIO
Maturity Type : Call
Maturity Date : 2012-05-31
Maturity Price : 25.00
Evaluated at bid price : 26.13
Bid-YTW : -42.60 %
NA.PR.M Deemed-Retractible 1.01 % YTW SCENARIO
Maturity Type : Call
Maturity Date : 2013-05-15
Maturity Price : 26.00
Evaluated at bid price : 26.97
Bid-YTW : 1.89 %
PWF.PR.K Perpetual-Discount 1.02 % YTW SCENARIO
Maturity Type : Limit Maturity
Maturity Date : 2042-05-01
Maturity Price : 24.55
Evaluated at bid price : 24.87
Bid-YTW : 4.99 %
BAM.PR.K Floater 1.10 % YTW SCENARIO
Maturity Type : Limit Maturity
Maturity Date : 2042-05-01
Maturity Price : 18.45
Evaluated at bid price : 18.45
Bid-YTW : 2.86 %
IAG.PR.E Deemed-Retractible 1.15 % YTW SCENARIO
Maturity Type : Hard Maturity
Maturity Date : 2022-01-31
Maturity Price : 25.00
Evaluated at bid price : 26.40
Bid-YTW : 5.36 %
MFC.PR.C Deemed-Retractible 1.16 % YTW SCENARIO
Maturity Type : Hard Maturity
Maturity Date : 2022-01-31
Maturity Price : 25.00
Evaluated at bid price : 23.51
Bid-YTW : 5.39 %
BMO.PR.J Deemed-Retractible 1.28 % YTW SCENARIO
Maturity Type : Call
Maturity Date : 2012-05-31
Maturity Price : 26.00
Evaluated at bid price : 26.04
Bid-YTW : -1.00 %
SLF.PR.D Deemed-Retractible 1.31 % YTW SCENARIO
Maturity Type : Hard Maturity
Maturity Date : 2022-01-31
Maturity Price : 25.00
Evaluated at bid price : 23.15
Bid-YTW : 5.52 %
SLF.PR.C Deemed-Retractible 1.32 % YTW SCENARIO
Maturity Type : Hard Maturity
Maturity Date : 2022-01-31
Maturity Price : 25.00
Evaluated at bid price : 23.11
Bid-YTW : 5.54 %
GWO.PR.I Deemed-Retractible 1.41 % YTW SCENARIO
Maturity Type : Hard Maturity
Maturity Date : 2022-01-31
Maturity Price : 25.00
Evaluated at bid price : 23.81
Bid-YTW : 5.21 %
IAG.PR.F Deemed-Retractible 1.83 % YTW SCENARIO
Maturity Type : Hard Maturity
Maturity Date : 2022-01-31
Maturity Price : 25.00
Evaluated at bid price : 26.16
Bid-YTW : 5.39 %
BAM.PR.G FixedFloater 1.87 % YTW SCENARIO
Maturity Type : Limit Maturity
Maturity Date : 2042-05-01
Maturity Price : 22.51
Evaluated at bid price : 21.80
Bid-YTW : 3.72 %
Volume Highlights
Issue Index Shares
Traded
Notes
BAM.PF.A FixedReset 101,450 RBC crossed blocks of 68,300 and 25,000, both at 25.44.
YTW SCENARIO
Maturity Type : Limit Maturity
Maturity Date : 2042-05-01
Maturity Price : 23.22
Evaluated at bid price : 25.40
Bid-YTW : 4.33 %
NA.PR.L Deemed-Retractible 95,584 RBC sold 10,000 to anonymous, 10,000 to TD and 10,500 to Desjardins, all at 25.50. TD crossed 25,000 at 25.49; Desjardins crossed 15,000 at the same price.
YTW SCENARIO
Maturity Type : Call
Maturity Date : 2012-06-14
Maturity Price : 25.50
Evaluated at bid price : 25.49
Bid-YTW : 3.59 %
BMO.PR.J Deemed-Retractible 90,041 Desjardins crossed 10,000 at 26.06; RBC crossed blocks of 40,900 and 25,000, both at 26.08.
YTW SCENARIO
Maturity Type : Call
Maturity Date : 2012-05-31
Maturity Price : 26.00
Evaluated at bid price : 26.04
Bid-YTW : -1.00 %
GWO.PR.M Deemed-Retractible 79,680 RBC bought 25,000 from CIBC at 26.20, then crossed 40,700 at 26.21.
YTW SCENARIO
Maturity Type : Hard Maturity
Maturity Date : 2022-01-31
Maturity Price : 25.00
Evaluated at bid price : 26.20
Bid-YTW : 5.26 %
SLF.PR.E Deemed-Retractible 75,432 RBC crossed 65,000 at 23.18.
YTW SCENARIO
Maturity Type : Hard Maturity
Maturity Date : 2022-01-31
Maturity Price : 25.00
Evaluated at bid price : 23.19
Bid-YTW : 5.55 %
TD.PR.G FixedReset 57,500 Nesbitt crossed 50,000 at 26.80.
YTW SCENARIO
Maturity Type : Call
Maturity Date : 2014-04-30
Maturity Price : 25.00
Evaluated at bid price : 26.82
Bid-YTW : 2.51 %
There were 42 other index-included issues trading in excess of 10,000 shares.
Wide Spread Highlights
Issue Index Quote Data and Yield Notes
BAM.PR.K Floater Quote: 18.45 – 18.99
Spot Rate : 0.5400
Average : 0.3883

YTW SCENARIO
Maturity Type : Limit Maturity
Maturity Date : 2042-05-01
Maturity Price : 18.45
Evaluated at bid price : 18.45
Bid-YTW : 2.86 %

CIU.PR.B FixedReset Quote: 27.25 – 27.71
Spot Rate : 0.4600
Average : 0.3186

YTW SCENARIO
Maturity Type : Call
Maturity Date : 2014-06-01
Maturity Price : 25.00
Evaluated at bid price : 27.25
Bid-YTW : 2.81 %

FTS.PR.E OpRet Quote: 26.52 – 26.91
Spot Rate : 0.3900
Average : 0.2592

YTW SCENARIO
Maturity Type : Call
Maturity Date : 2013-06-01
Maturity Price : 25.75
Evaluated at bid price : 26.52
Bid-YTW : 2.71 %

FTS.PR.F Perpetual-Premium Quote: 25.22 – 25.49
Spot Rate : 0.2700
Average : 0.1687

YTW SCENARIO
Maturity Type : Limit Maturity
Maturity Date : 2042-05-01
Maturity Price : 24.91
Evaluated at bid price : 25.22
Bid-YTW : 4.92 %

ELF.PR.F Perpetual-Discount Quote: 24.50 – 24.88
Spot Rate : 0.3800
Average : 0.2914

YTW SCENARIO
Maturity Type : Limit Maturity
Maturity Date : 2042-05-01
Maturity Price : 24.20
Evaluated at bid price : 24.50
Bid-YTW : 5.44 %

BMO.PR.L Deemed-Retractible Quote: 26.83 – 27.04
Spot Rate : 0.2100
Average : 0.1360

YTW SCENARIO
Maturity Type : Call
Maturity Date : 2013-05-25
Maturity Price : 26.00
Evaluated at bid price : 26.83
Bid-YTW : 2.17 %