Archive for August, 2013

DFN.PR.A Semi-Annual Report 13H1

Sunday, August 11th, 2013

Dividend 15 Split Corp. has released its Semi-Annual Report to May 31, 2013.

Figures of interest are:

MER: 1.29% of the whole unit value, excluding one time initial offering expenses.

Average Net Assets: We need this to calculate portfolio yield. The Total Assets of the fund at year end was $307.8-million, compared to $320.1-million on May 31, so call it an average of $314-million. Total Preferred Share Distribution for the six months was $4.363-million, at $0.525/share p.a. implies an average of 16.62-million units, at an average NAV of ((19.22 + 18.45) / 2 = 18.84, so call it $313.1-million. Pretty close! Call the average net assets $314-million

Underlying Portfolio Yield: Dividends received of $5.779-million divided by average net assets of $314-million, multiplied by two because it’s semiannual is 3.68%.

Income Coverage: Dividends of 5.779-million less expenses before issuance fees of 2.055-million is 3.72-million, to cover preferred dividends of 4.36-million is 85%.

August 9, 2013

Friday, August 9th, 2013

Nothing happened today.

It was another terrible day for the Canadian preferred share market, with PerpetualDiscounts losing 67bp, FixedResets off 32bp and DeemedRetractibles down 63bp. The Performance Highlights table is suitably enormous, with bank issues making a relatively rare ascent into prominence amongst the losers. Volume was above average.

HIMIPref™ Preferred Indices
These values reflect the December 2008 revision of the HIMIPref™ Indices

Values are provisional and are finalized monthly
Index Mean
Current
Yield
(at bid)
Median
YTW
Median
Average
Trading
Value
Median
Mod Dur
(YTW)
Issues Day’s Perf. Index Value
Ratchet 0.00 % 0.00 % 0 0.00 0 -0.2913 % 2,630.5
FixedFloater 4.30 % 3.59 % 32,552 18.19 1 -0.9409 % 3,864.7
Floater 2.56 % 2.85 % 74,054 20.09 5 -0.2913 % 2,840.2
OpRet 4.63 % 3.44 % 75,615 2.23 3 -0.1924 % 2,607.3
SplitShare 4.69 % 4.78 % 55,612 4.14 6 -0.2023 % 2,954.7
Interest-Bearing 0.00 % 0.00 % 0 0.00 0 -0.1924 % 2,384.1
Perpetual-Premium 5.70 % 5.57 % 91,718 14.08 12 0.0482 % 2,270.4
Perpetual-Discount 5.56 % 5.66 % 154,087 14.38 25 -0.6689 % 2,319.7
FixedReset 5.02 % 3.97 % 234,403 7.21 85 -0.3163 % 2,429.8
Deemed-Retractible 5.22 % 5.26 % 185,365 6.97 43 -0.6348 % 2,319.3
Performance Highlights
Issue Index Change Notes
GWO.PR.I Deemed-Retractible -3.18 % YTW SCENARIO
Maturity Type : Hard Maturity
Maturity Date : 2025-01-31
Maturity Price : 25.00
Evaluated at bid price : 21.32
Bid-YTW : 6.43 %
MFC.PR.F FixedReset -3.16 % YTW SCENARIO
Maturity Type : Hard Maturity
Maturity Date : 2025-01-31
Maturity Price : 25.00
Evaluated at bid price : 22.98
Bid-YTW : 4.46 %
CU.PR.D Perpetual-Discount -2.47 % YTW SCENARIO
Maturity Type : Limit Maturity
Maturity Date : 2043-08-09
Maturity Price : 22.53
Evaluated at bid price : 22.89
Bid-YTW : 5.34 %
RY.PR.B Deemed-Retractible -2.16 % YTW SCENARIO
Maturity Type : Hard Maturity
Maturity Date : 2022-01-31
Maturity Price : 25.00
Evaluated at bid price : 23.98
Bid-YTW : 5.31 %
CU.PR.E Perpetual-Discount -2.15 % YTW SCENARIO
Maturity Type : Limit Maturity
Maturity Date : 2043-08-09
Maturity Price : 22.41
Evaluated at bid price : 22.75
Bid-YTW : 5.38 %
CU.PR.F Perpetual-Discount -2.07 % YTW SCENARIO
Maturity Type : Limit Maturity
Maturity Date : 2043-08-09
Maturity Price : 20.77
Evaluated at bid price : 20.77
Bid-YTW : 5.43 %
RY.PR.G Deemed-Retractible -2.02 % YTW SCENARIO
Maturity Type : Hard Maturity
Maturity Date : 2022-01-31
Maturity Price : 25.00
Evaluated at bid price : 23.76
Bid-YTW : 5.23 %
ENB.PR.F FixedReset -1.94 % YTW SCENARIO
Maturity Type : Limit Maturity
Maturity Date : 2043-08-09
Maturity Price : 22.68
Evaluated at bid price : 23.75
Bid-YTW : 4.43 %
BNS.PR.M Deemed-Retractible -1.83 % YTW SCENARIO
Maturity Type : Hard Maturity
Maturity Date : 2022-01-31
Maturity Price : 25.00
Evaluated at bid price : 24.10
Bid-YTW : 5.07 %
RY.PR.A Deemed-Retractible -1.82 % YTW SCENARIO
Maturity Type : Hard Maturity
Maturity Date : 2022-01-31
Maturity Price : 25.00
Evaluated at bid price : 23.72
Bid-YTW : 5.21 %
MFC.PR.C Deemed-Retractible -1.77 % YTW SCENARIO
Maturity Type : Hard Maturity
Maturity Date : 2025-01-31
Maturity Price : 25.00
Evaluated at bid price : 21.04
Bid-YTW : 6.60 %
BMO.PR.K Deemed-Retractible -1.73 % YTW SCENARIO
Maturity Type : Hard Maturity
Maturity Date : 2022-01-31
Maturity Price : 25.00
Evaluated at bid price : 25.01
Bid-YTW : 5.24 %
TD.PR.O Deemed-Retractible -1.65 % YTW SCENARIO
Maturity Type : Hard Maturity
Maturity Date : 2022-01-31
Maturity Price : 25.00
Evaluated at bid price : 24.45
Bid-YTW : 5.22 %
FTS.PR.H FixedReset -1.60 % YTW SCENARIO
Maturity Type : Limit Maturity
Maturity Date : 2043-08-09
Maturity Price : 21.66
Evaluated at bid price : 22.09
Bid-YTW : 3.78 %
RY.PR.D Deemed-Retractible -1.57 % YTW SCENARIO
Maturity Type : Hard Maturity
Maturity Date : 2022-01-31
Maturity Price : 25.00
Evaluated at bid price : 23.79
Bid-YTW : 5.21 %
FTS.PR.J Perpetual-Discount -1.51 % YTW SCENARIO
Maturity Type : Limit Maturity
Maturity Date : 2043-08-09
Maturity Price : 22.51
Evaluated at bid price : 22.85
Bid-YTW : 5.27 %
W.PR.J Perpetual-Discount -1.49 % YTW SCENARIO
Maturity Type : Limit Maturity
Maturity Date : 2043-08-09
Maturity Price : 24.13
Evaluated at bid price : 24.38
Bid-YTW : 5.80 %
BNS.PR.N Deemed-Retractible -1.47 % YTW SCENARIO
Maturity Type : Hard Maturity
Maturity Date : 2022-01-31
Maturity Price : 25.00
Evaluated at bid price : 24.74
Bid-YTW : 5.46 %
PWF.PR.L Perpetual-Discount -1.42 % YTW SCENARIO
Maturity Type : Limit Maturity
Maturity Date : 2043-08-09
Maturity Price : 22.01
Evaluated at bid price : 22.25
Bid-YTW : 5.77 %
TRP.PR.B FixedReset -1.34 % YTW SCENARIO
Maturity Type : Limit Maturity
Maturity Date : 2043-08-09
Maturity Price : 21.32
Evaluated at bid price : 21.32
Bid-YTW : 3.72 %
BNS.PR.L Deemed-Retractible -1.31 % YTW SCENARIO
Maturity Type : Hard Maturity
Maturity Date : 2022-01-31
Maturity Price : 25.00
Evaluated at bid price : 24.18
Bid-YTW : 5.02 %
RY.PR.I FixedReset -1.27 % YTW SCENARIO
Maturity Type : Hard Maturity
Maturity Date : 2022-01-31
Maturity Price : 25.00
Evaluated at bid price : 24.78
Bid-YTW : 3.89 %
BAM.PR.X FixedReset -1.27 % YTW SCENARIO
Maturity Type : Limit Maturity
Maturity Date : 2043-08-09
Maturity Price : 22.05
Evaluated at bid price : 22.51
Bid-YTW : 4.21 %
RY.PR.F Deemed-Retractible -1.24 % YTW SCENARIO
Maturity Type : Hard Maturity
Maturity Date : 2022-01-31
Maturity Price : 25.00
Evaluated at bid price : 23.94
Bid-YTW : 5.07 %
BMO.PR.Q FixedReset -1.23 % YTW SCENARIO
Maturity Type : Hard Maturity
Maturity Date : 2022-01-31
Maturity Price : 25.00
Evaluated at bid price : 24.00
Bid-YTW : 3.85 %
ENB.PR.D FixedReset -1.22 % YTW SCENARIO
Maturity Type : Limit Maturity
Maturity Date : 2043-08-09
Maturity Price : 22.60
Evaluated at bid price : 23.56
Bid-YTW : 4.36 %
HSE.PR.A FixedReset -1.18 % YTW SCENARIO
Maturity Type : Limit Maturity
Maturity Date : 2043-08-09
Maturity Price : 22.27
Evaluated at bid price : 22.67
Bid-YTW : 4.03 %
ENB.PR.T FixedReset -1.17 % YTW SCENARIO
Maturity Type : Limit Maturity
Maturity Date : 2043-08-09
Maturity Price : 22.62
Evaluated at bid price : 23.75
Bid-YTW : 4.40 %
NA.PR.M Deemed-Retractible -1.16 % YTW SCENARIO
Maturity Type : Call
Maturity Date : 2017-05-15
Maturity Price : 25.00
Evaluated at bid price : 25.50
Bid-YTW : 5.41 %
RY.PR.E Deemed-Retractible -1.16 % YTW SCENARIO
Maturity Type : Hard Maturity
Maturity Date : 2022-01-31
Maturity Price : 25.00
Evaluated at bid price : 23.90
Bid-YTW : 5.15 %
TRP.PR.C FixedReset -1.11 % YTW SCENARIO
Maturity Type : Limit Maturity
Maturity Date : 2043-08-09
Maturity Price : 21.99
Evaluated at bid price : 22.25
Bid-YTW : 3.87 %
RY.PR.W Perpetual-Discount -1.05 % YTW SCENARIO
Maturity Type : Limit Maturity
Maturity Date : 2043-08-09
Maturity Price : 24.23
Evaluated at bid price : 24.50
Bid-YTW : 5.00 %
ENB.PR.N FixedReset -1.03 % YTW SCENARIO
Maturity Type : Limit Maturity
Maturity Date : 2043-08-09
Maturity Price : 22.80
Evaluated at bid price : 24.10
Bid-YTW : 4.45 %
MFC.PR.I FixedReset 1.16 % YTW SCENARIO
Maturity Type : Call
Maturity Date : 2017-09-19
Maturity Price : 25.00
Evaluated at bid price : 25.30
Bid-YTW : 4.27 %
Volume Highlights
Issue Index Shares
Traded
Notes
RY.PR.B Deemed-Retractible 100,756 Nesbitt crossed blocks of 44,700 and 24,100, both at 24.44.
YTW SCENARIO
Maturity Type : Hard Maturity
Maturity Date : 2022-01-31
Maturity Price : 25.00
Evaluated at bid price : 23.98
Bid-YTW : 5.31 %
ENB.PR.B FixedReset 85,739 TD crossed 55,000 at 24.15.
YTW SCENARIO
Maturity Type : Limit Maturity
Maturity Date : 2043-08-09
Maturity Price : 22.90
Evaluated at bid price : 24.06
Bid-YTW : 4.29 %
TD.PR.C FixedReset 84,840 Nesbitt crossed blocks of 23,800 and 20,000, both at 25.28. Scotia crossed 40,000 at the same price.
YTW SCENARIO
Maturity Type : Call
Maturity Date : 2014-01-31
Maturity Price : 25.00
Evaluated at bid price : 25.26
Bid-YTW : 3.69 %
GWO.PR.G Deemed-Retractible 77,196 Desjardins crossed 71,700 at 23.80.
YTW SCENARIO
Maturity Type : Hard Maturity
Maturity Date : 2025-01-31
Maturity Price : 25.00
Evaluated at bid price : 23.92
Bid-YTW : 5.83 %
BNS.PR.O Deemed-Retractible 58,300 Nesbitt crossed 50,500 at 25.64.
YTW SCENARIO
Maturity Type : Call
Maturity Date : 2017-04-26
Maturity Price : 25.00
Evaluated at bid price : 25.60
Bid-YTW : 4.95 %
CM.PR.D Perpetual-Premium 52,430 Nesbitt crossed 31,700 at 25.00.
YTW SCENARIO
Maturity Type : Limit Maturity
Maturity Date : 2043-08-09
Maturity Price : 24.65
Evaluated at bid price : 24.91
Bid-YTW : 5.81 %
There were 40 other index-included issues trading in excess of 10,000 shares.
Wide Spread Highlights
Issue Index Quote Data and Yield Notes
HSE.PR.A FixedReset Quote: 22.67 – 23.94
Spot Rate : 1.2700
Average : 0.7299

YTW SCENARIO
Maturity Type : Limit Maturity
Maturity Date : 2043-08-09
Maturity Price : 22.27
Evaluated at bid price : 22.67
Bid-YTW : 4.03 %

GWO.PR.I Deemed-Retractible Quote: 21.32 – 21.95
Spot Rate : 0.6300
Average : 0.4041

YTW SCENARIO
Maturity Type : Hard Maturity
Maturity Date : 2025-01-31
Maturity Price : 25.00
Evaluated at bid price : 21.32
Bid-YTW : 6.43 %

PWF.PR.P FixedReset Quote: 23.39 – 23.96
Spot Rate : 0.5700
Average : 0.3640

YTW SCENARIO
Maturity Type : Limit Maturity
Maturity Date : 2043-08-09
Maturity Price : 22.74
Evaluated at bid price : 23.39
Bid-YTW : 3.70 %

TD.PR.O Deemed-Retractible Quote: 24.45 – 24.92
Spot Rate : 0.4700
Average : 0.2825

YTW SCENARIO
Maturity Type : Hard Maturity
Maturity Date : 2022-01-31
Maturity Price : 25.00
Evaluated at bid price : 24.45
Bid-YTW : 5.22 %

BNS.PR.K Deemed-Retractible Quote: 24.30 – 24.91
Spot Rate : 0.6100
Average : 0.4708

YTW SCENARIO
Maturity Type : Hard Maturity
Maturity Date : 2022-01-31
Maturity Price : 25.00
Evaluated at bid price : 24.30
Bid-YTW : 5.26 %

BMO.PR.K Deemed-Retractible Quote: 25.01 – 25.35
Spot Rate : 0.3400
Average : 0.2074

YTW SCENARIO
Maturity Type : Hard Maturity
Maturity Date : 2022-01-31
Maturity Price : 25.00
Evaluated at bid price : 25.01
Bid-YTW : 5.24 %

August 8, 2013

Thursday, August 8th, 2013

I’ve just had a look at A Review of the Oncology Under-Dosing Incident by Jake J. Thiessen, Ph.D. … the report on the chemotherapy scandal in which neither hospitals nor purchasing agents made the slightest effort to determine just what it was they were buying or had bought.

What a whitewash.

The early days of the incident began with the discovery of a questionable MHS GEMCITABINE product on March 20, 2013 at the Peterborough Regional Health Centre.

This, of course, is bullshit. The early days of the incident began with the tendering of the contract to supply the drug. The contract was incompetently drafted and handling of the delivered materials was also incompetent. He didn’t address (or even acknowledge) the kickback negotiated as part of the contract.

As a former chemist, the part I like best is:

The clear difference factor in bulk reconstitution preparation lies in the overfill within the normal saline bags used in hospitals and by MHS. That is, although a bag may be nominally labeled to contain 100, 250, 500 or 1000 mL of 0.9% sodium chloride, the actual volume may be somewhat larger. Such overfill is widely known and is not limited to diluents. For example, Baxter had declared its overfill (shown in Appendix 4). Both the GPO and MHS were apparently aware of such overfills. The degree of overfill is not standardized; it becomes part of a manufacturer’s finished product specifications. The reason for this overfill is that the fluid bags are to some extent permeable to water. That is, water can move through the membrane and then evaporate from the outside surface. On storage, the contents of the bags can thereby decrease. The product’s shelf life is defined by the length of time it would normally take before the contents are reduced to the aforementioned nominal contents (e.g., 100 mL) on the label. Obviously, the rate of loss is determined by the permeability of the bag, fluid volume to surface ratio, and the storage conditions. This influences both the overfill variability used by a manufacturer and the contents determined at any point in time

So it is known that the concentration of active material in the bags will increase over time, but the clowndorks in charge of preparing medication for administration use the bags as a source of stock solution at the concentration shown on the label.

Don’t get sick in Ontari-ari-ari-o.

As a nod to the ostensible subject of this blog (Canadian preferred shares. Remember?) I’ll highlight Assiduous Reader adrian2‘s trip down memory lane to May, 2008, when we were all trying to figure out just what these funny new Fixed-Reset thingamajigs were all about.

It was another day of sickness in the Canadian preferred share market, with PerpetualDiscounts off 1bp, FixedResets down 16bp and DeemedRetractibles losing 19bp. The Performance Highlights table is again very lengthy, but with no obvious patterns. Volume was high.

HIMIPref™ Preferred Indices
These values reflect the December 2008 revision of the HIMIPref™ Indices

Values are provisional and are finalized monthly
Index Mean
Current
Yield
(at bid)
Median
YTW
Median
Average
Trading
Value
Median
Mod Dur
(YTW)
Issues Day’s Perf. Index Value
Ratchet 0.00 % 0.00 % 0 0.00 0 0.1167 % 2,638.1
FixedFloater 4.26 % 3.55 % 32,548 18.27 1 -2.7451 % 3,901.4
Floater 2.55 % 2.83 % 74,235 20.14 5 0.1167 % 2,848.5
OpRet 4.62 % 3.35 % 76,748 0.63 3 -0.3069 % 2,612.4
SplitShare 4.68 % 4.73 % 55,902 4.14 6 -0.2023 % 2,960.7
Interest-Bearing 0.00 % 0.00 % 0 0.00 0 -0.3069 % 2,388.7
Perpetual-Premium 5.70 % 5.61 % 91,805 14.13 12 -0.3100 % 2,269.3
Perpetual-Discount 5.52 % 5.64 % 155,036 14.43 25 -0.0096 % 2,335.3
FixedReset 5.01 % 3.90 % 234,720 4.16 85 -0.1571 % 2,437.5
Deemed-Retractible 5.18 % 5.12 % 181,244 6.99 43 -0.1913 % 2,334.1
Performance Highlights
Issue Index Change Notes
BAM.PR.G FixedFloater -2.75 % YTW SCENARIO
Maturity Type : Limit Maturity
Maturity Date : 2043-08-08
Maturity Price : 22.67
Evaluated at bid price : 22.32
Bid-YTW : 3.55 %
PWF.PR.O Perpetual-Premium -2.65 % YTW SCENARIO
Maturity Type : Limit Maturity
Maturity Date : 2043-08-08
Maturity Price : 24.54
Evaluated at bid price : 25.01
Bid-YTW : 5.82 %
BMO.PR.M FixedReset -1.81 % YTW SCENARIO
Maturity Type : Hard Maturity
Maturity Date : 2022-01-31
Maturity Price : 25.00
Evaluated at bid price : 24.40
Bid-YTW : 3.80 %
GWO.PR.Q Deemed-Retractible -1.80 % YTW SCENARIO
Maturity Type : Hard Maturity
Maturity Date : 2025-01-31
Maturity Price : 25.00
Evaluated at bid price : 23.96
Bid-YTW : 5.75 %
TRP.PR.B FixedReset -1.55 % YTW SCENARIO
Maturity Type : Limit Maturity
Maturity Date : 2043-08-08
Maturity Price : 21.31
Evaluated at bid price : 21.61
Bid-YTW : 3.67 %
SLF.PR.G FixedReset -1.47 % YTW SCENARIO
Maturity Type : Hard Maturity
Maturity Date : 2025-01-31
Maturity Price : 25.00
Evaluated at bid price : 23.50
Bid-YTW : 4.14 %
W.PR.H Perpetual-Discount -1.42 % YTW SCENARIO
Maturity Type : Limit Maturity
Maturity Date : 2043-08-08
Maturity Price : 23.33
Evaluated at bid price : 23.61
Bid-YTW : 5.88 %
RY.PR.C Deemed-Retractible -1.39 % YTW SCENARIO
Maturity Type : Hard Maturity
Maturity Date : 2022-01-31
Maturity Price : 25.00
Evaluated at bid price : 24.11
Bid-YTW : 5.12 %
MFC.PR.F FixedReset -1.25 % YTW SCENARIO
Maturity Type : Hard Maturity
Maturity Date : 2025-01-31
Maturity Price : 25.00
Evaluated at bid price : 23.73
Bid-YTW : 4.12 %
PWF.PR.L Perpetual-Discount -1.18 % YTW SCENARIO
Maturity Type : Limit Maturity
Maturity Date : 2043-08-08
Maturity Price : 22.25
Evaluated at bid price : 22.57
Bid-YTW : 5.68 %
BAM.PR.N Perpetual-Discount -1.15 % YTW SCENARIO
Maturity Type : Limit Maturity
Maturity Date : 2043-08-08
Maturity Price : 20.59
Evaluated at bid price : 20.59
Bid-YTW : 5.85 %
BAM.PF.D Perpetual-Discount -1.15 % YTW SCENARIO
Maturity Type : Limit Maturity
Maturity Date : 2043-08-08
Maturity Price : 21.51
Evaluated at bid price : 21.51
Bid-YTW : 5.80 %
BAM.PR.Z FixedReset -1.06 % YTW SCENARIO
Maturity Type : Limit Maturity
Maturity Date : 2043-08-08
Maturity Price : 23.29
Evaluated at bid price : 25.25
Bid-YTW : 4.65 %
BNS.PR.K Deemed-Retractible -1.01 % YTW SCENARIO
Maturity Type : Hard Maturity
Maturity Date : 2022-01-31
Maturity Price : 25.00
Evaluated at bid price : 24.40
Bid-YTW : 5.20 %
BNS.PR.Z FixedReset 1.03 % YTW SCENARIO
Maturity Type : Hard Maturity
Maturity Date : 2022-01-31
Maturity Price : 25.00
Evaluated at bid price : 23.47
Bid-YTW : 4.21 %
POW.PR.B Perpetual-Discount 1.15 % YTW SCENARIO
Maturity Type : Limit Maturity
Maturity Date : 2043-08-08
Maturity Price : 23.43
Evaluated at bid price : 23.72
Bid-YTW : 5.69 %
PWF.PR.M FixedReset 1.23 % YTW SCENARIO
Maturity Type : Call
Maturity Date : 2014-01-31
Maturity Price : 25.00
Evaluated at bid price : 25.56
Bid-YTW : 1.58 %
FTS.PR.F Perpetual-Discount 1.30 % YTW SCENARIO
Maturity Type : Limit Maturity
Maturity Date : 2043-08-08
Maturity Price : 22.94
Evaluated at bid price : 23.32
Bid-YTW : 5.33 %
PWF.PR.S Perpetual-Discount 1.38 % YTW SCENARIO
Maturity Type : Limit Maturity
Maturity Date : 2043-08-08
Maturity Price : 21.71
Evaluated at bid price : 22.00
Bid-YTW : 5.48 %
MFC.PR.C Deemed-Retractible 1.61 % YTW SCENARIO
Maturity Type : Hard Maturity
Maturity Date : 2025-01-31
Maturity Price : 25.00
Evaluated at bid price : 21.42
Bid-YTW : 6.39 %
BAM.PF.A FixedReset 1.98 % YTW SCENARIO
Maturity Type : Limit Maturity
Maturity Date : 2043-08-08
Maturity Price : 23.08
Evaluated at bid price : 24.78
Bid-YTW : 4.63 %
Volume Highlights
Issue Index Shares
Traded
Notes
TD.PR.T FixedReset 57,170 Recently converted FloatingReset.
YTW SCENARIO
Maturity Type : Call
Maturity Date : 2018-07-31
Maturity Price : 25.00
Evaluated at bid price : 25.15
Bid-YTW : 2.37 %
GWO.PR.M Deemed-Retractible 54,524 TD crossed 50,000 at 25.75.
YTW SCENARIO
Maturity Type : Call
Maturity Date : 2019-03-31
Maturity Price : 25.00
Evaluated at bid price : 25.58
Bid-YTW : 5.49 %
RY.PR.T FixedReset 53,639 Scotia crossed 50,000 at 25.87.
YTW SCENARIO
Maturity Type : Call
Maturity Date : 2014-08-24
Maturity Price : 25.00
Evaluated at bid price : 25.75
Bid-YTW : 3.08 %
PWF.PR.S Perpetual-Discount 41,602 TD crossed 10,000 at 22.00.
YTW SCENARIO
Maturity Type : Limit Maturity
Maturity Date : 2043-08-08
Maturity Price : 21.71
Evaluated at bid price : 22.00
Bid-YTW : 5.48 %
BAM.PF.C Perpetual-Discount 38,618 RBC crossed 24,300 at 20.90.
YTW SCENARIO
Maturity Type : Limit Maturity
Maturity Date : 2043-08-08
Maturity Price : 20.88
Evaluated at bid price : 20.88
Bid-YTW : 5.89 %
BNS.PR.A FixedReset 37,772 RBC crossed 22,000 at 26.08.
YTW SCENARIO
Maturity Type : Call
Maturity Date : 2013-09-07
Maturity Price : 25.50
Evaluated at bid price : 26.03
Bid-YTW : -23.54 %
There were 46 other index-included issues trading in excess of 10,000 shares.
Wide Spread Highlights
Issue Index Quote Data and Yield Notes
PWF.PR.O Perpetual-Premium Quote: 25.01 – 25.87
Spot Rate : 0.8600
Average : 0.5094

YTW SCENARIO
Maturity Type : Limit Maturity
Maturity Date : 2043-08-08
Maturity Price : 24.54
Evaluated at bid price : 25.01
Bid-YTW : 5.82 %

PWF.PR.A Floater Quote: 24.10 – 24.95
Spot Rate : 0.8500
Average : 0.6043

YTW SCENARIO
Maturity Type : Limit Maturity
Maturity Date : 2043-08-08
Maturity Price : 23.85
Evaluated at bid price : 24.10
Bid-YTW : 2.15 %

TRP.PR.B FixedReset Quote: 21.61 – 22.00
Spot Rate : 0.3900
Average : 0.2445

YTW SCENARIO
Maturity Type : Limit Maturity
Maturity Date : 2043-08-08
Maturity Price : 21.31
Evaluated at bid price : 21.61
Bid-YTW : 3.67 %

TCA.PR.Y Perpetual-Premium Quote: 49.85 – 50.40
Spot Rate : 0.5500
Average : 0.4133

YTW SCENARIO
Maturity Type : Limit Maturity
Maturity Date : 2043-08-08
Maturity Price : 49.38
Evaluated at bid price : 49.85
Bid-YTW : 5.65 %

CU.PR.C FixedReset Quote: 24.66 – 25.10
Spot Rate : 0.4400
Average : 0.3041

YTW SCENARIO
Maturity Type : Limit Maturity
Maturity Date : 2043-08-08
Maturity Price : 23.15
Evaluated at bid price : 24.66
Bid-YTW : 4.11 %

BMO.PR.Q FixedReset Quote: 24.30 – 24.63
Spot Rate : 0.3300
Average : 0.2065

YTW SCENARIO
Maturity Type : Hard Maturity
Maturity Date : 2022-01-31
Maturity Price : 25.00
Evaluated at bid price : 24.30
Bid-YTW : 3.68 %

FTS.PR.G To Reset To 3.883%

Thursday, August 8th, 2013

Fortis Inc. has announced:

the applicable annual fixed dividend rate for its Cumulative Redeemable Five-Year Fixed-Rate Reset First Preference Shares, Series G (the “Series G Shares”).

Holders of the Series G Shares will be entitled to receive quarterly fixed cumulative preferential cash dividends, if, as and when declared by the Board of Directors of Fortis. The annual fixed dividend rate for the five-year period from and including September 1, 2013 to but excluding September 1, 2018 will be 3.883%, being equal to the Five-Year Government of Canada bond yield determined as at August 2, 2013 plus 2.13%, as determined in accordance with the terms of the Series G Shares.

Fortis has designated the preference share dividends as eligible dividends for federal and provincial dividend tax credit purposes.

Fortis is the largest investor-owned distribution utility in Canada, with total assets exceeding $17 billion and fiscal 2012 revenue totalling approximately $3.7 billion. Its regulated utilities account for 90% of total assets and serve approximately 2.4 million gas and electricity customers across Canada and in New York State and the Caribbean. Fortis owns non-regulated hydroelectric generation assets in Canada, Belize and Upstate New York. The Corporation’s non-utility investments are comprised of hotels and commercial real estate in Canada and petroleum supply operations in the mid-Atlantic region of the United States.

The Common Shares; First Preference Shares, Series E; First Preference Shares, Series F; First Preference Shares, Series G; First Preference Shares, Series H; First Preference Shares, Series J; and First Preference Shares, Series K are listed on the Toronto Stock Exchange and trade under the ticker symbols FTS, FTS.PR.E, FTS.PR.F, FTS.PR.G, FTS.PR.H, FTS.PR.J and FTS.PR.K, respectively.

Fortis information can be accessed on the Corporation’s website at www.fortisinc.com and on SEDAR at www.sedar.com.

Note that this issue does not have an option to convert into FloatingResets – the structure was very new at the time of issue and provisions had not yet standardized although, of course, there is nothing stopping a new issuer from coming out with an equivalent issue.

The prospectus for this issue is available on SEDAR, dated May 15, 2008. I am, of course, unable to link directly to this prospectus because the bank-owned CDS has been granted a monopoly by the regulators and abuses this monopoly by prohibiting links and access to its API. The regulators, many of whom will be employed by banks in the future, think this is just a dandy way to run a public service.

The new rate of 3.883% is quite a come-down from the issue rate of 5.25% or, to put it another way, from $1.3125 p.a. to $0.97075.

August 7, 2013

Wednesday, August 7th, 2013

Nothing happened today.

Another crushing day for the Canadian preferred share market, with PerpetualDiscounts losing 77bp, FixedResets off 8bp and DeemedRetractibles down 23bp. There is a suitably lengthy Performance Highlights table, suitably featuring PerpetualDiscount losers, but with an impressive number of FixedReset losers and a few winners to provide some variety. Volume was quite high.

PerpetualDiscounts now yield 5.64%, equivalent to 7.33% interest at the standard equivalency factor of 1.3x. Long corporates now yield about 4.7%, so the pre-tax interest-equivalent spread is now about 265bp, an extremely sharp widening from the 240bp reported July 31.

HIMIPref™ Preferred Indices
These values reflect the December 2008 revision of the HIMIPref™ Indices

Values are provisional and are finalized monthly
Index Mean
Current
Yield
(at bid)
Median
YTW
Median
Average
Trading
Value
Median
Mod Dur
(YTW)
Issues Day’s Perf. Index Value
Ratchet 0.00 % 0.00 % 0 0.00 0 0.2143 % 2,635.1
FixedFloater 4.14 % 3.43 % 32,324 18.49 1 0.0000 % 4,011.5
Floater 2.55 % 2.84 % 75,208 20.11 5 0.2143 % 2,845.2
OpRet 4.60 % 2.97 % 77,587 0.63 3 -0.3568 % 2,620.4
SplitShare 4.67 % 4.67 % 57,911 4.14 6 0.4295 % 2,966.7
Interest-Bearing 0.00 % 0.00 % 0 0.00 0 -0.3568 % 2,396.1
Perpetual-Premium 5.69 % 5.43 % 90,282 3.86 12 -0.1738 % 2,276.4
Perpetual-Discount 5.51 % 5.64 % 154,772 14.43 25 -0.7676 % 2,335.6
FixedReset 5.00 % 3.90 % 234,219 4.66 85 -0.0834 % 2,441.3
Deemed-Retractible 5.17 % 5.05 % 183,953 6.99 43 -0.2312 % 2,338.6
Performance Highlights
Issue Index Change Notes
PWF.PR.K Perpetual-Discount -3.46 % Pretty real. 100 shares changed hands at 22.03 fifteen minutes before the close and the “last” quote was 22.03-26, 10×1. However, the VWAP (volume weighted average price) was 22.39 on 14,493 shares, so we’ll find out tomorrow if it was real or just a little last minute weariness.
YTW SCENARIO
Maturity Type : Limit Maturity
Maturity Date : 2043-08-07
Maturity Price : 21.68
Evaluated at bid price : 22.03
Bid-YTW : 5.64 %
PWF.PR.S Perpetual-Discount -3.38 % Real! All board lots after 2:30pm were under 22.00.
YTW SCENARIO
Maturity Type : Limit Maturity
Maturity Date : 2043-08-07
Maturity Price : 21.38
Evaluated at bid price : 21.70
Bid-YTW : 5.56 %
CU.PR.C FixedReset -2.55 % Real! Lots of action below par, and the low for the day was 24.22.
YTW SCENARIO
Maturity Type : Limit Maturity
Maturity Date : 2043-08-07
Maturity Price : 23.22
Evaluated at bid price : 24.85
Bid-YTW : 4.13 %
SLF.PR.G FixedReset -2.05 % YTW SCENARIO
Maturity Type : Hard Maturity
Maturity Date : 2025-01-31
Maturity Price : 25.00
Evaluated at bid price : 23.85
Bid-YTW : 3.97 %
BAM.PR.M Perpetual-Discount -1.87 % YTW SCENARIO
Maturity Type : Limit Maturity
Maturity Date : 2043-08-07
Maturity Price : 21.03
Evaluated at bid price : 21.03
Bid-YTW : 5.73 %
BAM.PF.D Perpetual-Discount -1.76 % YTW SCENARIO
Maturity Type : Limit Maturity
Maturity Date : 2043-08-07
Maturity Price : 21.48
Evaluated at bid price : 21.76
Bid-YTW : 5.71 %
ENB.PR.N FixedReset -1.74 % YTW SCENARIO
Maturity Type : Limit Maturity
Maturity Date : 2043-08-07
Maturity Price : 22.89
Evaluated at bid price : 24.32
Bid-YTW : 4.41 %
TRP.PR.C FixedReset -1.53 % YTW SCENARIO
Maturity Type : Limit Maturity
Maturity Date : 2043-08-07
Maturity Price : 22.18
Evaluated at bid price : 22.51
Bid-YTW : 3.84 %
CU.PR.G Perpetual-Discount -1.46 % YTW SCENARIO
Maturity Type : Limit Maturity
Maturity Date : 2043-08-07
Maturity Price : 21.30
Evaluated at bid price : 21.58
Bid-YTW : 5.31 %
FTS.PR.G FixedReset -1.32 % YTW SCENARIO
Maturity Type : Limit Maturity
Maturity Date : 2043-08-07
Maturity Price : 22.36
Evaluated at bid price : 23.15
Bid-YTW : 4.25 %
FTS.PR.F Perpetual-Discount -1.29 % YTW SCENARIO
Maturity Type : Limit Maturity
Maturity Date : 2043-08-07
Maturity Price : 22.77
Evaluated at bid price : 23.02
Bid-YTW : 5.41 %
BAM.PR.N Perpetual-Discount -1.28 % YTW SCENARIO
Maturity Type : Limit Maturity
Maturity Date : 2043-08-07
Maturity Price : 20.83
Evaluated at bid price : 20.83
Bid-YTW : 5.78 %
POW.PR.B Perpetual-Discount -1.26 % YTW SCENARIO
Maturity Type : Limit Maturity
Maturity Date : 2043-08-07
Maturity Price : 23.15
Evaluated at bid price : 23.45
Bid-YTW : 5.75 %
GWO.PR.R Deemed-Retractible -1.18 % YTW SCENARIO
Maturity Type : Hard Maturity
Maturity Date : 2025-01-31
Maturity Price : 25.00
Evaluated at bid price : 23.40
Bid-YTW : 5.66 %
ELF.PR.H Perpetual-Discount -1.07 % YTW SCENARIO
Maturity Type : Limit Maturity
Maturity Date : 2043-08-07
Maturity Price : 23.72
Evaluated at bid price : 24.09
Bid-YTW : 5.75 %
GWO.PR.H Deemed-Retractible -1.04 % YTW SCENARIO
Maturity Type : Hard Maturity
Maturity Date : 2025-01-31
Maturity Price : 25.00
Evaluated at bid price : 22.76
Bid-YTW : 6.04 %
BNS.PR.N Deemed-Retractible -1.03 % YTW SCENARIO
Maturity Type : Call
Maturity Date : 2017-01-27
Maturity Price : 25.00
Evaluated at bid price : 25.10
Bid-YTW : 5.18 %
MFC.PR.I FixedReset -1.02 % YTW SCENARIO
Maturity Type : Call
Maturity Date : 2017-09-19
Maturity Price : 25.00
Evaluated at bid price : 25.25
Bid-YTW : 4.31 %
SLF.PR.H FixedReset -1.00 % YTW SCENARIO
Maturity Type : Hard Maturity
Maturity Date : 2025-01-31
Maturity Price : 25.00
Evaluated at bid price : 24.65
Bid-YTW : 4.16 %
GCS.PR.A SplitShare 1.06 % YTW SCENARIO
Maturity Type : Hard Maturity
Maturity Date : 2019-07-31
Maturity Price : 25.00
Evaluated at bid price : 24.87
Bid-YTW : 4.17 %
TRP.PR.A FixedReset 1.08 % YTW SCENARIO
Maturity Type : Limit Maturity
Maturity Date : 2043-08-07
Maturity Price : 22.90
Evaluated at bid price : 23.35
Bid-YTW : 4.06 %
RY.PR.B Deemed-Retractible 1.11 % YTW SCENARIO
Maturity Type : Hard Maturity
Maturity Date : 2022-01-31
Maturity Price : 25.00
Evaluated at bid price : 24.69
Bid-YTW : 4.88 %
BNA.PR.E SplitShare 1.15 % YTW SCENARIO
Maturity Type : Hard Maturity
Maturity Date : 2017-12-10
Maturity Price : 25.00
Evaluated at bid price : 25.40
Bid-YTW : 4.67 %
BAM.PF.B FixedReset 11.87 % YTW SCENARIO
Maturity Type : Limit Maturity
Maturity Date : 2043-08-07
Maturity Price : 22.67
Evaluated at bid price : 23.84
Bid-YTW : 4.54 %
Volume Highlights
Issue Index Shares
Traded
Notes
GWO.PR.G Deemed-Retractible 110,820 Desjardins crossed 100,000 at 24.00.
YTW SCENARIO
Maturity Type : Hard Maturity
Maturity Date : 2025-01-31
Maturity Price : 25.00
Evaluated at bid price : 23.95
Bid-YTW : 5.81 %
ENB.PR.Y FixedReset 94,382 Scotia crossed blocks of 10,000 and 30,000, both at 24.00.
YTW SCENARIO
Maturity Type : Limit Maturity
Maturity Date : 2043-08-07
Maturity Price : 22.71
Evaluated at bid price : 23.97
Bid-YTW : 4.27 %
RY.PR.D Deemed-Retractible 90,974 RBC crossed 78,800 at 24.35.
YTW SCENARIO
Maturity Type : Hard Maturity
Maturity Date : 2022-01-31
Maturity Price : 25.00
Evaluated at bid price : 24.26
Bid-YTW : 4.93 %
RY.PR.Y FixedReset 59,390 Nesbitt crossed 50,000 at 26.01.
YTW SCENARIO
Maturity Type : Call
Maturity Date : 2014-11-24
Maturity Price : 25.00
Evaluated at bid price : 25.99
Bid-YTW : 2.77 %
RY.PR.X FixedReset 57,363 Nesbitt crossed 50,000 at 25.87.
YTW SCENARIO
Maturity Type : Call
Maturity Date : 2014-08-24
Maturity Price : 25.00
Evaluated at bid price : 25.87
Bid-YTW : 2.61 %
CM.PR.M FixedReset 53,505 Scotia crossed 40,000 at 25.95.
YTW SCENARIO
Maturity Type : Call
Maturity Date : 2014-07-31
Maturity Price : 25.00
Evaluated at bid price : 25.80
Bid-YTW : 3.33 %
There were 56 other index-included issues trading in excess of 10,000 shares.
Wide Spread Highlights
Issue Index Quote Data and Yield Notes
BNS.PR.Y FixedReset Quote: 23.30 – 23.86
Spot Rate : 0.5600
Average : 0.3400

YTW SCENARIO
Maturity Type : Hard Maturity
Maturity Date : 2022-01-31
Maturity Price : 25.00
Evaluated at bid price : 23.30
Bid-YTW : 4.01 %

PWF.PR.S Perpetual-Discount Quote: 21.70 – 22.14
Spot Rate : 0.4400
Average : 0.2869

YTW SCENARIO
Maturity Type : Limit Maturity
Maturity Date : 2043-08-07
Maturity Price : 21.38
Evaluated at bid price : 21.70
Bid-YTW : 5.56 %

TCA.PR.X Perpetual-Discount Quote: 50.00 – 50.39
Spot Rate : 0.3900
Average : 0.2478

YTW SCENARIO
Maturity Type : Limit Maturity
Maturity Date : 2043-08-07
Maturity Price : 49.56
Evaluated at bid price : 50.00
Bid-YTW : 5.64 %

RY.PR.C Deemed-Retractible Quote: 24.45 – 24.92
Spot Rate : 0.4700
Average : 0.3386

YTW SCENARIO
Maturity Type : Hard Maturity
Maturity Date : 2022-01-31
Maturity Price : 25.00
Evaluated at bid price : 24.45
Bid-YTW : 4.92 %

POW.PR.B Perpetual-Discount Quote: 23.45 – 23.83
Spot Rate : 0.3800
Average : 0.2558

YTW SCENARIO
Maturity Type : Limit Maturity
Maturity Date : 2043-08-07
Maturity Price : 23.15
Evaluated at bid price : 23.45
Bid-YTW : 5.75 %

HSE.PR.A FixedReset Quote: 23.14 – 23.48
Spot Rate : 0.3400
Average : 0.2227

YTW SCENARIO
Maturity Type : Limit Maturity
Maturity Date : 2043-08-07
Maturity Price : 22.57
Evaluated at bid price : 23.14
Bid-YTW : 3.95 %

BBD Placed on Review-Negative by DBRS

Tuesday, August 6th, 2013

DBRS has announced that it:

has today placed the Issuer Rating, Preferred Shares and Senior Unsecured Debentures of Bombardier Inc. (BBD or the Company) Under Review with Negative Implications. The rating action mainly reflects the recent deterioration in the financial profile, caused by rising debt levels. This is largely due to the elevated capital outlays associated with the C-series aircraft program, resulting in large negative free cash flows, further borrowing and higher leverage as evident during the most recent earnings release. The C-series program is being pushed further out, as delays in the overall systems integration of the flight test vehicle have caused the Company to postpone first test flight and entry-into-service dates.

DBRS will likely remove the rating from Under Review with Negative Implications and downgrade Bombardier if the financial profile metrics do not show improvement from current levels or if they deteriorate further by the end of the third quarter of this fiscal year. Additionally, DBRS would downgrade the rating should the Company announce further program delays, or continue to have similar levels of capital outlays, negative free cash flows and leverage during the same time frame.

Bombardier has three series of preferreds outstanding: BBD.PR.B (Ratchet Rate); BBD.PR.C (PerpetualDiscount) and BBD.PR.D (FixedFloater). All are tracked by HIMIPref™; all are assigned to the Scraps index on Credit concerns.

August 6, 2013

Tuesday, August 6th, 2013

The Fabulous Fab verdict is having its intended effect: funding prospects for the SEC have brightened:

The win adds weight to pledges by SEC Chairman Mary Jo White to reinvigorate the regulator, seeking more onerous settlements in some cases and, if necessary, taking them to trial. It also could bolster support for a 27 percent budget increase for the agency that Congress is considering.

“The SEC needed at least one scalp from the financial crisis, or they were going to face a lot of heat from Congress,” said Adam Pritchard, a University of Michigan law professor who previously worked as a lawyer for the regulator.

The only thing that might actually have a chance of working is going after incompetent idiots, such as Laura Schwartz and Alan Roseman of ACA Management LLC, which funded the deal due to analysis critically based on an investment technique called “Follow the Leader”. Fortunately for them and many, many of their peers, though, gross incompetence is not a legitimate target for a regulator, so we’ll have to leave that one up to the clients, ha-ha. I suppose it’s nice to see that Laura Schwartz has her own problems.

Canadian pension plans are about to get hit by the pointy end of longevity risk:

The bottom line in the Towers Watson report is this: Just as things are looking up for pension plans, the fact that we’re living longer may soon officially change assumptions, undoing the recent gains from stronger stock markets and rising interest rates.

Towers Watson based its report on new, draft mortality tables unveiled last week by the Canadian Institute of Actuaries. These are used to measure how much pension plans require to meet their obligations to retirees going forward.

“Although the effect will vary from plan to plan, adoption of the proposed mortality tables and acceptance of the study’s prediction of future mortality improvements could also immediately increase pension accounting liabilities by 5 per cent to 10 per cent for many plans, potentially impacting corporate income statements and balance sheets,” Towers Watson said.

The proposed new tables increase the life expectancy of a 60-year-old man by 2.9 years, and for a woman by 2.7 years.

Mind you, pensions have had a good year:

U.S. state and local-government pension investments gained the most in two years in fiscal 2013, overshadowed by intensifying scrutiny of underfunded municipal-retirement plans following Detroit’s record bankruptcy.
Public pensions booked a median gain of 12.4 percent for the 12 months through June, powered by a surge in U.S. stock prices to a record, Wilshire Associates said today in a report. The funds chalked up an annualized three-year median return of 11.4 percent while their assets surpassed a pre-recession peak to reach $2.9 trillion, according to U.S. Census Bureau figures.

Spend-Every-Penny is beginning to address the Canadian mortgage problem – in his own socialistic way:

The Crown corporation has notified banks, credit unions and other mortgage lenders that they will each be restricted to a maximum of $350-million of new guarantees this month under its National Housing Act Mortgage-Backed Securities (NHA MBS) program. The decision comes in the wake of “unexpected demand” for the guarantees, a spokeswoman for CMHC said in an e-mailed statement.

Hurray! When demand outstrips supply … ration the commodity! Isn’t that the Canadian way?

Bloomberg has an interesting story showing how Wal-Mart haters can be efficiently exploited:

In the city of Selma, a Central Valley town south of Fresno, Wal-Mart accused Save Mart of being behind an anti-Wal-Mart group, Save Our Selma Coalition, in a 2005 filing requesting a subpoena. Bentonville, Arkansas-based Wal-Mart built its store anyway. In Tracy, California, WinCo accused Save Mart in 2007 of directing a lawsuit filed by neighborhood group Tracy First against the city for approving a new WinCo store, according to a state court document. WinCo also built its store.

[Consultant Burt] Flickinger said Save Mart’s territory still only has one Wal-Mart supercenter for every 150,000 people, compared with one for every 45,000 in Alabama.

“It’s not for lack of trying either,” Flickinger said.

The only thing that can possibly make wind power economical is storage. In Ontario we’ve blown the budget on not-ready-for-prime-time technology, but market leaders are doing research:

On a windy island 500 miles north of Tokyo, Japan is about to experiment with a battery designed to transform the way electricity is supplied and at the same time boost Prime Minister Shinzo Abe’s economic rescue plan.

The Ministry of Economy, Trade and Industry is investing 20 billion yen ($203 million) on a Sumitomo Electric Industries Ltd. (5802) device to be used by Hokkaido island’s utility to store excess solar and wind power, stabilizing flows to consumers.

The battery, which uses the metal vanadium to store electrical energy in electrolyte tanks, has been researched from Australia to China and promises to handle the sort of large power surpluses that can develop on a transmission grid.

Speedy subways or slow LRTs for Toronto? Well, here’s the London experience:

Crossrail, Europe’s largest construction project, costing an estimated 15 billion pounds ($23 billion), will cut commuting times by as much as half, enticing tenants to rent offices in once-overlooked corners of the City. Plans for buildings from Farringdon through Smithfield to the Thameslink overland rail station to the south represent the City’s biggest development pipeline since 2011, when a cluster of towers went up near the Lloyds of London insurance building, said Peter Rees, the City’s planning officer.

CRUNCH! The Canadian preferred share market took a shellacking today, with PerpetualDiscounts losing 102bp, FixedResets down 88bp and DeemedRetractibles off 72bp. The Performance Highlights table is suitably enormous and comprised entirely of losers. Volume was high, but nothing extraordinary.

I suspect that the problem is a massive batch of sell orders placed through Citigroup Global markets (Broker #123). Now, I am hesitant to criticize traders for their trading, because I have no way of knowing who their client is or what their instructions were …. but I will go so far as to say their selection of trading algorithm is a red flag. In many cases they used what I call a “drip algorithm” (the cool guys probably call it something else) whereby you sell 100 shares at market every X seconds. It is the easiest thing in the world to spot and a marvellous thing to exploit. Just sit on the bid and get N different fills over the next NX seconds. It has the advantage from the seller’s perspective of getting done, guaranteed: since when will a market order not get filled? It has the advantage from the buyers’ perspective of being the way most likely to take the market price down to ridiculous levels. To sum up: somebody is probably a moron, but there’s no way of knowing who: the seller or the trader. And the seller might have been doing something better to compensate on the other side of his trade.

“Drip Algorithms” might work OK in a deep, liquid market, but in the thin little world of Canadian preferreds … sorry, Charlie.

HIMIPref™ Preferred Indices
These values reflect the December 2008 revision of the HIMIPref™ Indices

Values are provisional and are finalized monthly
Index Mean
Current
Yield
(at bid)
Median
YTW
Median
Average
Trading
Value
Median
Mod Dur
(YTW)
Issues Day’s Perf. Index Value
Ratchet 0.00 % 0.00 % 0 0.00 0 0.2833 % 2,629.4
FixedFloater 4.14 % 3.43 % 31,624 18.49 1 -0.8639 % 4,011.5
Floater 2.56 % 2.85 % 76,041 20.10 5 0.2833 % 2,839.1
OpRet 4.59 % 1.85 % 78,681 0.08 3 0.3453 % 2,629.8
SplitShare 4.69 % 4.94 % 56,736 4.14 6 -0.0105 % 2,954.0
Interest-Bearing 0.00 % 0.00 % 0 0.00 0 0.3453 % 2,404.7
Perpetual-Premium 5.68 % 5.41 % 90,416 0.56 12 -0.0595 % 2,280.4
Perpetual-Discount 5.47 % 5.61 % 151,184 14.47 25 -1.0222 % 2,353.6
FixedReset 4.99 % 3.83 % 234,620 3.94 85 -0.8765 % 2,443.3
Deemed-Retractible 5.16 % 5.03 % 182,309 7.00 43 -0.7246 % 2,344.0
Performance Highlights
Issue Index Change Notes
BAM.PF.B FixedReset -13.37 % It it real or not? You be the judge! The official low for the day was 24.00, but that’s based on board lots. The two final trades of the day were odd lots at (brace yourselves) 16.76 and 16.77. So basically, we can ding the market maker for having a spread of what looks like over seven dollars shortly before the close; whether we can ding him for having a nonsensical spread AT the close is something that would cost me money to find out. But yeah, either the market-maker or the Exchange are idiots on this one.

YTW SCENARIO
Maturity Type : Limit Maturity
Maturity Date : 2043-08-06
Maturity Price : 21.31
Evaluated at bid price : 21.31
Bid-YTW : 5.17 %

PWF.PR.S Perpetual-Discount -4.43 % This is real! The “last” quote was 22.46-55, 3×5, with quite a few small trades going through at under 22.50 in the last fifteen minutes.
YTW SCENARIO
Maturity Type : Limit Maturity
Maturity Date : 2043-08-06
Maturity Price : 22.12
Evaluated at bid price : 22.46
Bid-YTW : 5.36 %
TRP.PR.A FixedReset -3.91 % Really! Lots of small trades going through below 23.40 just before the close, with a “last” quote of 23.10-66, 6×1, a wide spread but not enough to make me homicidal.
YTW SCENARIO
Maturity Type : Limit Maturity
Maturity Date : 2043-08-06
Maturity Price : 22.66
Evaluated at bid price : 23.10
Bid-YTW : 4.11 %
BAM.PF.A FixedReset -3.60 % YTW SCENARIO
Maturity Type : Limit Maturity
Maturity Date : 2043-08-06
Maturity Price : 22.82
Evaluated at bid price : 24.11
Bid-YTW : 4.79 %
BAM.PR.X FixedReset -3.44 % YTW SCENARIO
Maturity Type : Limit Maturity
Maturity Date : 2043-08-06
Maturity Price : 22.36
Evaluated at bid price : 23.02
Bid-YTW : 4.12 %
BNS.PR.Z FixedReset -3.39 % YTW SCENARIO
Maturity Type : Hard Maturity
Maturity Date : 2022-01-31
Maturity Price : 25.00
Evaluated at bid price : 23.08
Bid-YTW : 4.44 %
TRP.PR.B FixedReset -3.31 % YTW SCENARIO
Maturity Type : Limit Maturity
Maturity Date : 2043-08-06
Maturity Price : 21.53
Evaluated at bid price : 21.90
Bid-YTW : 3.61 %
ENB.PR.F FixedReset -2.93 % YTW SCENARIO
Maturity Type : Limit Maturity
Maturity Date : 2043-08-06
Maturity Price : 22.86
Evaluated at bid price : 24.17
Bid-YTW : 4.35 %
TRP.PR.D FixedReset -2.93 % YTW SCENARIO
Maturity Type : Limit Maturity
Maturity Date : 2043-08-06
Maturity Price : 22.83
Evaluated at bid price : 24.22
Bid-YTW : 4.18 %
ENB.PR.B FixedReset -2.53 % YTW SCENARIO
Maturity Type : Limit Maturity
Maturity Date : 2043-08-06
Maturity Price : 23.01
Evaluated at bid price : 24.32
Bid-YTW : 4.24 %
CU.PR.D Perpetual-Discount -2.46 % YTW SCENARIO
Maturity Type : Limit Maturity
Maturity Date : 2043-08-06
Maturity Price : 23.11
Evaluated at bid price : 23.41
Bid-YTW : 5.31 %
ENB.PR.P FixedReset -2.38 % YTW SCENARIO
Maturity Type : Limit Maturity
Maturity Date : 2043-08-06
Maturity Price : 22.83
Evaluated at bid price : 24.20
Bid-YTW : 4.32 %
PWF.PR.R Perpetual-Discount -2.33 % YTW SCENARIO
Maturity Type : Limit Maturity
Maturity Date : 2043-08-06
Maturity Price : 23.92
Evaluated at bid price : 24.30
Bid-YTW : 5.68 %
RY.PR.B Deemed-Retractible -2.32 % YTW SCENARIO
Maturity Type : Hard Maturity
Maturity Date : 2022-01-31
Maturity Price : 25.00
Evaluated at bid price : 24.42
Bid-YTW : 5.03 %
SLF.PR.D Deemed-Retractible -2.19 % YTW SCENARIO
Maturity Type : Hard Maturity
Maturity Date : 2025-01-31
Maturity Price : 25.00
Evaluated at bid price : 20.97
Bid-YTW : 6.56 %
MFC.PR.J FixedReset -2.05 % YTW SCENARIO
Maturity Type : Hard Maturity
Maturity Date : 2025-01-31
Maturity Price : 25.00
Evaluated at bid price : 24.39
Bid-YTW : 4.58 %
ENB.PR.T FixedReset -2.02 % YTW SCENARIO
Maturity Type : Limit Maturity
Maturity Date : 2043-08-06
Maturity Price : 22.84
Evaluated at bid price : 24.25
Bid-YTW : 4.30 %
HSE.PR.A FixedReset -1.98 % YTW SCENARIO
Maturity Type : Limit Maturity
Maturity Date : 2043-08-06
Maturity Price : 22.66
Evaluated at bid price : 23.30
Bid-YTW : 3.92 %
SLF.PR.C Deemed-Retractible -1.96 % YTW SCENARIO
Maturity Type : Hard Maturity
Maturity Date : 2025-01-31
Maturity Price : 25.00
Evaluated at bid price : 21.01
Bid-YTW : 6.54 %
MFC.PR.C Deemed-Retractible -1.95 % YTW SCENARIO
Maturity Type : Hard Maturity
Maturity Date : 2025-01-31
Maturity Price : 25.00
Evaluated at bid price : 21.08
Bid-YTW : 6.58 %
BNS.PR.Y FixedReset -1.85 % YTW SCENARIO
Maturity Type : Hard Maturity
Maturity Date : 2022-01-31
Maturity Price : 25.00
Evaluated at bid price : 23.35
Bid-YTW : 3.97 %
BAM.PF.D Perpetual-Discount -1.77 % YTW SCENARIO
Maturity Type : Limit Maturity
Maturity Date : 2043-08-06
Maturity Price : 21.82
Evaluated at bid price : 22.15
Bid-YTW : 5.61 %
IAG.PR.G FixedReset -1.74 % YTW SCENARIO
Maturity Type : Call
Maturity Date : 2017-06-30
Maturity Price : 25.00
Evaluated at bid price : 25.36
Bid-YTW : 4.04 %
SLF.PR.E Deemed-Retractible -1.63 % YTW SCENARIO
Maturity Type : Hard Maturity
Maturity Date : 2025-01-31
Maturity Price : 25.00
Evaluated at bid price : 21.12
Bid-YTW : 6.53 %
PWF.PR.P FixedReset -1.63 % YTW SCENARIO
Maturity Type : Limit Maturity
Maturity Date : 2043-08-06
Maturity Price : 22.85
Evaluated at bid price : 23.60
Bid-YTW : 3.68 %
PWF.PR.L Perpetual-Discount -1.59 % YTW SCENARIO
Maturity Type : Limit Maturity
Maturity Date : 2043-08-06
Maturity Price : 22.62
Evaluated at bid price : 22.91
Bid-YTW : 5.59 %
GWO.PR.Q Deemed-Retractible -1.51 % YTW SCENARIO
Maturity Type : Hard Maturity
Maturity Date : 2025-01-31
Maturity Price : 25.00
Evaluated at bid price : 24.16
Bid-YTW : 5.65 %
SLF.PR.B Deemed-Retractible -1.48 % YTW SCENARIO
Maturity Type : Hard Maturity
Maturity Date : 2025-01-31
Maturity Price : 25.00
Evaluated at bid price : 22.03
Bid-YTW : 6.37 %
TRP.PR.C FixedReset -1.47 % YTW SCENARIO
Maturity Type : Limit Maturity
Maturity Date : 2043-08-06
Maturity Price : 22.41
Evaluated at bid price : 22.86
Bid-YTW : 3.77 %
GWO.PR.G Deemed-Retractible -1.44 % YTW SCENARIO
Maturity Type : Hard Maturity
Maturity Date : 2025-01-31
Maturity Price : 25.00
Evaluated at bid price : 24.00
Bid-YTW : 5.78 %
BMO.PR.P FixedReset -1.39 % YTW SCENARIO
Maturity Type : Call
Maturity Date : 2015-02-25
Maturity Price : 25.00
Evaluated at bid price : 25.55
Bid-YTW : 3.76 %
RY.PR.D Deemed-Retractible -1.38 % YTW SCENARIO
Maturity Type : Hard Maturity
Maturity Date : 2022-01-31
Maturity Price : 25.00
Evaluated at bid price : 24.38
Bid-YTW : 4.85 %
SLF.PR.A Deemed-Retractible -1.34 % YTW SCENARIO
Maturity Type : Hard Maturity
Maturity Date : 2025-01-31
Maturity Price : 25.00
Evaluated at bid price : 22.03
Bid-YTW : 6.32 %
RY.PR.C Deemed-Retractible -1.33 % YTW SCENARIO
Maturity Type : Hard Maturity
Maturity Date : 2022-01-31
Maturity Price : 25.00
Evaluated at bid price : 24.52
Bid-YTW : 4.87 %
PWF.PR.F Perpetual-Discount -1.30 % YTW SCENARIO
Maturity Type : Limit Maturity
Maturity Date : 2043-08-06
Maturity Price : 23.19
Evaluated at bid price : 23.49
Bid-YTW : 5.62 %
CU.PR.E Perpetual-Discount -1.30 % YTW SCENARIO
Maturity Type : Limit Maturity
Maturity Date : 2043-08-06
Maturity Price : 23.21
Evaluated at bid price : 23.52
Bid-YTW : 5.29 %
ENB.PR.Y FixedReset -1.26 % YTW SCENARIO
Maturity Type : Limit Maturity
Maturity Date : 2043-08-06
Maturity Price : 22.81
Evaluated at bid price : 24.20
Bid-YTW : 4.16 %
ENB.PR.D FixedReset -1.26 % YTW SCENARIO
Maturity Type : Limit Maturity
Maturity Date : 2043-08-06
Maturity Price : 22.93
Evaluated at bid price : 24.30
Bid-YTW : 4.21 %
GWO.PR.P Deemed-Retractible -1.24 % YTW SCENARIO
Maturity Type : Hard Maturity
Maturity Date : 2025-01-31
Maturity Price : 25.00
Evaluated at bid price : 24.70
Bid-YTW : 5.65 %
RY.PR.E Deemed-Retractible -1.17 % YTW SCENARIO
Maturity Type : Hard Maturity
Maturity Date : 2022-01-31
Maturity Price : 25.00
Evaluated at bid price : 24.41
Bid-YTW : 4.84 %
POW.PR.G Perpetual-Premium -1.16 % YTW SCENARIO
Maturity Type : Limit Maturity
Maturity Date : 2043-08-06
Maturity Price : 24.37
Evaluated at bid price : 24.78
Bid-YTW : 5.69 %
W.PR.H Perpetual-Discount -1.11 % YTW SCENARIO
Maturity Type : Limit Maturity
Maturity Date : 2043-08-06
Maturity Price : 23.70
Evaluated at bid price : 24.01
Bid-YTW : 5.78 %
ENB.PR.N FixedReset -1.08 % YTW SCENARIO
Maturity Type : Limit Maturity
Maturity Date : 2043-08-06
Maturity Price : 23.05
Evaluated at bid price : 24.75
Bid-YTW : 4.32 %
FTS.PR.G FixedReset -1.05 % YTW SCENARIO
Maturity Type : Limit Maturity
Maturity Date : 2043-08-06
Maturity Price : 22.52
Evaluated at bid price : 23.46
Bid-YTW : 4.18 %
RY.PR.G Deemed-Retractible -1.05 % YTW SCENARIO
Maturity Type : Hard Maturity
Maturity Date : 2022-01-31
Maturity Price : 25.00
Evaluated at bid price : 24.42
Bid-YTW : 4.83 %
BAM.PF.C Perpetual-Discount -1.03 % YTW SCENARIO
Maturity Type : Limit Maturity
Maturity Date : 2043-08-06
Maturity Price : 21.19
Evaluated at bid price : 21.19
Bid-YTW : 5.80 %
PWF.PR.E Perpetual-Discount -1.02 % YTW SCENARIO
Maturity Type : Limit Maturity
Maturity Date : 2043-08-06
Maturity Price : 23.92
Evaluated at bid price : 24.16
Bid-YTW : 5.72 %
MFC.PR.G FixedReset -1.02 % YTW SCENARIO
Maturity Type : Call
Maturity Date : 2016-12-19
Maturity Price : 25.00
Evaluated at bid price : 25.30
Bid-YTW : 4.22 %
MFC.PR.K FixedReset -1.01 % YTW SCENARIO
Maturity Type : Hard Maturity
Maturity Date : 2025-01-31
Maturity Price : 25.00
Evaluated at bid price : 24.55
Bid-YTW : 4.08 %
Volume Highlights
Issue Index Shares
Traded
Notes
BAM.PF.D Perpetual-Discount 59,645 RBC crossed 16,400 at 22.55.
YTW SCENARIO
Maturity Type : Limit Maturity
Maturity Date : 2043-08-06
Maturity Price : 21.82
Evaluated at bid price : 22.15
Bid-YTW : 5.61 %
BMO.PR.M FixedReset 47,357 YTW SCENARIO
Maturity Type : Hard Maturity
Maturity Date : 2022-01-31
Maturity Price : 25.00
Evaluated at bid price : 24.97
Bid-YTW : 3.48 %
FTS.PR.K FixedReset 30,565 YTW SCENARIO
Maturity Type : Limit Maturity
Maturity Date : 2043-08-06
Maturity Price : 23.12
Evaluated at bid price : 24.98
Bid-YTW : 3.75 %
TD.PR.E FixedReset 29,689 YTW SCENARIO
Maturity Type : Call
Maturity Date : 2014-04-30
Maturity Price : 25.00
Evaluated at bid price : 25.37
Bid-YTW : 4.29 %
BNS.PR.A FixedReset 29,637 YTW SCENARIO
Maturity Type : Call
Maturity Date : 2013-09-05
Maturity Price : 25.50
Evaluated at bid price : 26.06
Bid-YTW : -24.77 %
BNS.PR.Q FixedReset 26,427 YTW SCENARIO
Maturity Type : Hard Maturity
Maturity Date : 2022-01-31
Maturity Price : 25.00
Evaluated at bid price : 24.81
Bid-YTW : 3.66 %
There were 43 other index-included issues trading in excess of 10,000 shares.
Wide Spread Highlights
Issue Index Quote Data and Yield Notes
BAM.PF.B FixedReset Quote: 21.31 – 22.81
Spot Rate : 1.5000
Average : 0.8360

YTW SCENARIO
Maturity Type : Limit Maturity
Maturity Date : 2043-08-06
Maturity Price : 21.31
Evaluated at bid price : 21.31
Bid-YTW : 5.17 %

CU.PR.D Perpetual-Discount Quote: 23.41 – 24.28
Spot Rate : 0.8700
Average : 0.5567

YTW SCENARIO
Maturity Type : Limit Maturity
Maturity Date : 2043-08-06
Maturity Price : 23.11
Evaluated at bid price : 23.41
Bid-YTW : 5.31 %

BAM.PF.A FixedReset Quote: 24.11 – 24.84
Spot Rate : 0.7300
Average : 0.4747

YTW SCENARIO
Maturity Type : Limit Maturity
Maturity Date : 2043-08-06
Maturity Price : 22.82
Evaluated at bid price : 24.11
Bid-YTW : 4.79 %

RY.PR.B Deemed-Retractible Quote: 24.42 – 24.95
Spot Rate : 0.5300
Average : 0.2968

YTW SCENARIO
Maturity Type : Hard Maturity
Maturity Date : 2022-01-31
Maturity Price : 25.00
Evaluated at bid price : 24.42
Bid-YTW : 5.03 %

BAM.PF.D Perpetual-Discount Quote: 22.15 – 22.85
Spot Rate : 0.7000
Average : 0.4778

YTW SCENARIO
Maturity Type : Limit Maturity
Maturity Date : 2043-08-06
Maturity Price : 21.82
Evaluated at bid price : 22.15
Bid-YTW : 5.61 %

ENB.PR.B FixedReset Quote: 24.32 – 24.89
Spot Rate : 0.5700
Average : 0.3492

YTW SCENARIO
Maturity Type : Limit Maturity
Maturity Date : 2043-08-06
Maturity Price : 23.01
Evaluated at bid price : 24.32
Bid-YTW : 4.24 %

MAPF Performance: July 2013

Monday, August 5th, 2013

The fund underperformed in June, due largely to being over-weight in DeemedRetractible issues, more particularly insurance DeemedRetractibles which didn’t just underperform – these issues actually underperformed PerpetualDiscounts, something I cannot explain.

The Canadian preferred share market performed poorly in July, with a few new twists.

ZPR, is a relatively new ETF comprised of FixedResets and Floating Rate issues, with a very high proportion of junk issues, which returned -1.48% for the month, and -3.59% over the past three months (according to my calculations from the fund’s NAV data and distribution data; our regulators are hard at work protecting you from performance data since the fund has been extant for less than a year), versus returns for the TXPL index of -1.42% and -3.49%, respectively. The fund has been able to attract assets of about $830.8-million in the eight and a half months since inception, even adding $18.0-million in June despite the market downturn but – and this is important – losing 12.6-million in assets in July. The change in assets is roughly equal to the return of the fund, meaning that although ZPR has not yet experienced any redemptions over a full month, the flow of money into the fund has stopped – at least temporarily. I feel that the flows into and out of this fund are very important in determining the performance of its constituents.

TXPR had returns over one- and three-months of -0.98% and -3.40%, respectively

Returns for the HIMIPref™ investment grade sub-indices for May were as follows:

HIMIPref™ Indices
Performance to July 31, 2013
Sub-Index 1-Month 3-month
Ratchet N/A N/A
FixFloat +2.84% -1.24%
Floater +1.78% +0.35%
OpRet +0.85% +0.59%
SplitShare -0.10% +0.06%
Interest N/A N/A
PerpetualPremium +0.51% -3.98%
PerpetualDiscount +0.19% -11.15%
FixedReset -0.44% -1.64%
DeemedRetractible -0.63% -3.55%

Malachite Aggressive Preferred Fund’s Net Asset Value per Unit as of the close July 31, 2013, was 10.1673.

Returns to July 31, 2013
Period MAPF BMO-CM “50” Index TXPR
Total Return
CPD – according to Blackrock
One Month -1.54% -0.48% -0.98% -0.98%
Three Months -5.06% -2.13% -3.40% -3.48%
One Year +1.95% +1.76% +0.43% -0.08%
Two Years (annualized) +2.39% +3.11% +2.33% N/A
Three Years (annualized) +6.68% +6.34% +4.97% +4.34%
Four Years (annualized) +8.81% +7.21% +5.71% N/A
Five Years (annualized) +17.02% +7.07% +5.74% +5.07%
Six Years (annualized) +12.61% +4.48% +3.26%  
Seven Years (annualized) +11.58% +3.92%    
Eight Years (annualized) +10.68% +3.82%    
Nine Years (annualized) +10.30% +3.96%    
Ten Years (annualized) +11.16% +4.16%    
Eleven Years (annualized) +11.36% +4.35%    
Twelve Years (annualized) +11.36% +4.33%    
MAPF returns assume reinvestment of distributions, and are shown after expenses but before fees.
CPD Returns are for the NAV and are after all fees and expenses.
* CPD does not directly report its two- or four-year returns.
Figures for Omega Preferred Equity (which are after all fees and expenses) for 1-, 3- and 12-months are -0.19%, -2.47% and +1.36%, respectively, according to Morningstar after all fees & expenses. Three year performance is +5.19%; five year is +5.83%
Figures for Jov Leon Frazer Preferred Equity Fund Class I Units (which are after all fees and expenses) for 1-, 3- and 12-months are -0.46%, -2.50% and -0.05% respectively, according to Morningstar. Three Year performance is +2.56%
Figures for Manulife Preferred Income Fund (formerly AIC Preferred Income Fund) (which are after all fees and expenses) for 1-, 3- and 12-months are -0.88%, -5.14% & -1.12%, respectively. Three Year performance is +3.17%
Figures for Horizons AlphaPro Preferred Share ETF (which are after all fees and expenses) for 1-, 3- and 12-months are -0.42%, -2.43% & +1.54%, respectively.
Figures for Altamira Preferred Equity Fund are -1.12% and -3.68% for one- and three- months, respectively.
The figure for BMO S&P/TSX Laddered Preferred Share Index ETF is -1.48% and -3.59% for one- and three-months. [calculation by JH]

MAPF returns assume reinvestment of dividends, and are shown after expenses but before fees. Past performance is not a guarantee of future performance. You can lose money investing in Malachite Aggressive Preferred Fund or any other fund. For more information, see the fund’s main page. The fund is available either directly from Hymas Investment Management or through a brokerage account at Odlum Brown Limited.

A problem that has bedevilled the market over the past two years has been the OSFI decision not to grandfather Straight Perpetuals as Tier 1 bank capital, and their continued foot-dragging regarding a decision on insurer Straight Perpetuals has segmented the market to the point where trading has become much more difficult. The fund occasionally finds an attractive opportunity to trade between GWO issues, which have a good range of annual coupons (but in which trading is now hampered by the fact that the low-coupon issues are trading near par and are callable at par in the near term), but is “stuck” in the MFC and SLF issues, which have a much narrower range of coupon, while the IAG DeemedRetractibles are quite illiquid. Until the market became so grossly segmented, this was not so much of a problem – but now banks are not available to swap into (because they are so expensive) and non-regulated companies are likewise deprecated (because they are not DeemedRetractibles; they should not participate in the increase in value that will follow the OSFI decision I anticipate and, in addition, are analyzed as perpetuals). The fund’s portfolio is, in effect ‘locked in’ to the MFC & SLF issues due to projected gains from a future OSFI decision, to the detriment of trading gains particularly in May, 2013, when the three lowest-coupon SLF DeemedRetractibles (SLF.PR.C, SLF.PR.D and SLF.PR.E) were the worst performing DeemedRetractibles in the sub-index!

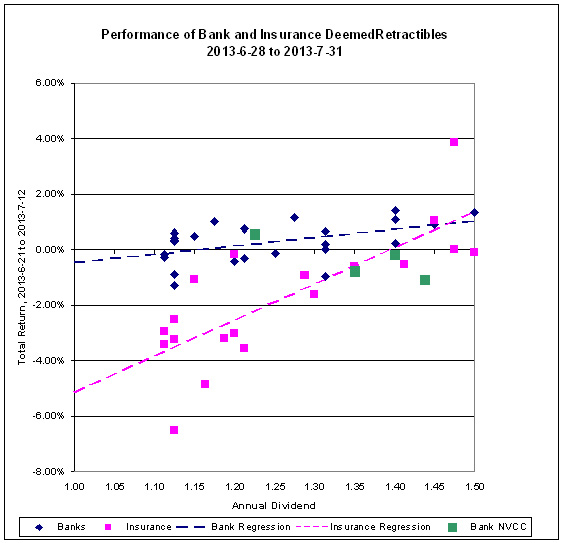
I have pointed out in the past that the market continues to treat regulated insurance issues (SLF, GWO) in much the same way unregulated issues (PWF); this was dramatically illustrated in June but the July results are even more dramatic.

Click for Big

Click for Big
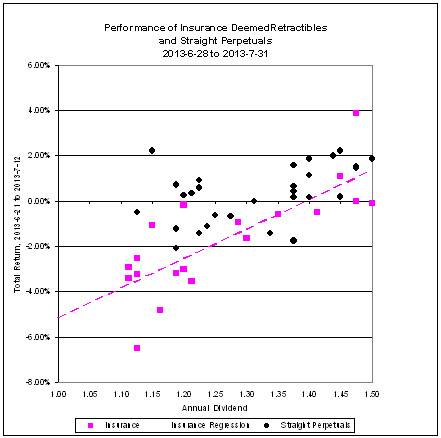
The first observation is that insurance issued DeemedRetractibles continued to behave much more like Straight Perpetuals than bank-issued DeemedRetractibles; the second is that the insurance issues actually underperformed Straights in July.

As the fund holds a high proportion of insurer-issued DeemedRetractibles, fund performance was hurt by this phenomenon.

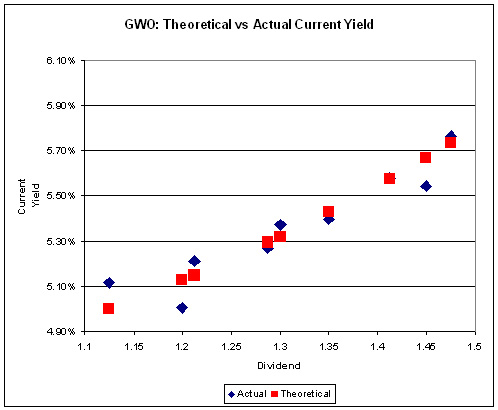
A side effect of the downdraft was the return of measurable Implied Volatility:

Click for Big

Click for Big
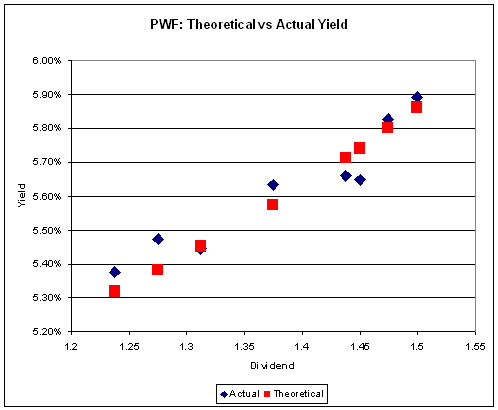
Implied Volatility of
Two Series of Issues
July 31, 2013
Issuer Pure Yield Implied Volatility
GWO 3.85% (+0.55) 25% (-3)
PWF 4.30% (+0.30) 24% (-1)
Bracketted figures are changes since June month-end

Those of you who have been paying attention will remember that in a “normal” market (which we have not seen in well over a year) the slope of this line is related to the implied volatility of yields in Black-Scholes theory, as discussed in the January, 2010, edition of PrefLetter. As has been previously noted, very high levels of Implied Volatility (in the 40% range) imply a very strong expectation of directionality in future prices – i.e, an expectation that all issues will be redeemed at par. The decline in Implied Volatility – which is still at very high levels – implies more uncertainty regarding this prediction.

Sometimes everything works … sometimes it’s 50-50 … sometimes nothing works. The fund seeks to earn incremental return by selling liquidity (that is, taking the other side of trades that other market participants are strongly motivated to execute), which can also be referred to as ‘trading noise’ – although for quite some time, noise trading has taken a distant second place to the sectoral play on insurance DeemedRetractibles. There were a lot of strongly motivated market participants during the Panic of 2007, generating a lot of noise! Unfortunately, the conditions of the Panic may never be repeated in my lifetime … but the fund will simply attempt to make trades when swaps seem profitable, without worrying about the level of monthly turnover.

There’s plenty of room for new money left in the fund. I have shown in recent issues of PrefLetter that market pricing for FixedResets is demonstrably stupid and I have lots of confidence – backed up by my bond portfolio management experience in the markets for Canadas and Treasuries, and equity trading on the NYSE & TSX – that there is enough demand for liquidity in any market to make the effort of providing it worthwhile (although the definition of “worthwhile” in terms of basis points of outperformance changes considerably from market to market!) I will continue to exert utmost efforts to outperform but it should be borne in mind that there will almost inevitably be periods of underperformance in the future.

The yields available on high quality preferred shares remain elevated, which is reflected in the current estimate of sustainable income.

Calculation of MAPF Sustainable Income Per Unit
Month NAVPU Portfolio
Average
YTW
Leverage
Divisor
Securities
Average
YTW
Capital
Gains
Multiplier
Sustainable
Income
per
current
Unit
June, 2007 9.3114 5.16% 1.03 5.01% 1.3240 0.3524
September 9.1489 5.35% 0.98 5.46% 1.3240 0.3773
December, 2007 9.0070 5.53% 0.942 5.87% 1.3240 0.3993
March, 2008 8.8512 6.17% 1.047 5.89% 1.3240 0.3938
June 8.3419 6.034% 0.952 6.338% 1.3240 $0.3993
September 8.1886 7.108% 0.969 7.335% 1.3240 $0.4537
December, 2008 8.0464 9.24% 1.008 9.166% 1.3240 $0.5571
March 2009 $8.8317 8.60% 0.995 8.802% 1.3240 $0.5872
June 10.9846 7.05% 0.999 7.057% 1.3240 $0.5855
September 12.3462 6.03% 0.998 6.042% 1.3240 $0.5634
December 2009 10.5662 5.74% 0.981 5.851% 1.1141 $0.5549
March 2010 10.2497 6.03% 0.992 6.079% 1.1141 $0.5593
June 10.5770 5.96% 0.996 5.984% 1.1141 $0.5681
September 11.3901 5.43% 0.980 5.540% 1.1141 $0.5664
December 2010 10.7659 5.37% 0.993 5.408% 1.0298 $0.5654
March, 2011 11.0560 6.00% 0.994 5.964% 1.0298 $0.6403
June 11.1194 5.87% 1.018 5.976% 1.0298 $0.6453
September 10.2709 6.10%
Note
1.001 6.106% 1.0298 $0.6090
December, 2011 10.0793 5.63%
Note
1.031 5.805% 1.0000 $0.5851
March, 2012 10.3944 5.13%
Note
0.996 5.109% 1.0000 $0.5310
June 10.2151 5.32%
Note
1.012 5.384% 1.0000 $0.5500
September 10.6703 4.61%
Note
0.997 4.624% 1.0000 $0.4934
December, 2012 10.8307 4.24% 0.989 4.287% 1.0000 $0.4643
March, 2013 10.9033 3.87% 0.996 3.886% 1.0000 $0.4237
June 10.3261 4.81% 0.998 4.80% 1.0000 $0.4957
July, 2013 10.1673 5.13% 1.000 5.13% 1.0000 $0.5216
NAVPU is shown after quarterly distributions of dividend income and annual distribution of capital gains.
Portfolio YTW includes cash (or margin borrowing), with an assumed interest rate of 0.00%
The Leverage Divisor indicates the level of cash in the account: if the portfolio is 1% in cash, the Leverage Divisor will be 0.99
Securities YTW divides “Portfolio YTW” by the “Leverage Divisor” to show the average YTW on the securities held; this assumes that the cash is invested in (or raised from) all securities held, in proportion to their holdings.
The Capital Gains Multiplier adjusts for the effects of Capital Gains Dividends. On 2009-12-31, there was a capital gains distribution of $1.989262 which is assumed for this purpose to have been reinvested at the final price of $10.5662. Thus, a holder of one unit pre-distribution would have held 1.1883 units post-distribution; the CG Multiplier reflects this to make the time-series comparable. Note that Dividend Distributions are not assumed to be reinvested.
Sustainable Income is the resultant estimate of the fund’s dividend income per current unit, before fees and expenses. Note that a “current unit” includes reinvestment of prior capital gains; a unitholder would have had the calculated sustainable income with only, say, 0.9 units in the past which, with reinvestment of capital gains, would become 1.0 current units.
DeemedRetractibles are comprised of all Straight Perpetuals (both PerpetualDiscount and PerpetualPremium) issued by BMO, BNS, CM, ELF, GWO, HSB, IAG, MFC, NA, RY, SLF and TD, which are not exchangable into common at the option of the company (definition refined in May, 2011). These issues are analyzed as if their prospectuses included a requirement to redeem at par on or prior to 2022-1-31 (banks) or 2025-1-31 (insurers and insurance holding companies), in addition to the call schedule explicitly defined. See OSFI Does Not Grandfather Extant Tier 1 Capital, CM.PR.D, CM.PR.E, CM.PR.G: Seeking NVCC Status and the January, February, March and June, 2011, editions of PrefLetter for the rationale behind this analysis.
Yields for September, 2011, to January, 2012, were calculated by imposing a cap of 10% on the yields of YLO issues held, in order to avoid their extremely high calculated yields distorting the calculation and to reflect the uncertainty in the marketplace that these yields will be realized. From February to September 2012, yields on these issues have been set to zero. All YLO issues held were sold in October 2012.

Significant positions were held in DeemedRetractible and FixedReset issues on July 31; all of these currently have their yields calculated with the presumption that they will be called by the issuers at par prior to 2022-1-31 (banks) or 2025-1-31 (insurers and insurance holding companies). This presents another complication in the calculation of sustainable yield. The fund also holds positions in various SplitShare issues which also have their yields calculated with the expectation of a maturity at par.

I no longer show calculations that assume the conversion of the entire portfolio into PerpetualDiscounts, as the fund has no holdings of these issues.

I will also note that the sustainable yield calculated above is not directly comparable with any yield calculation currently reported by any other preferred share fund as far as I am aware. The Sustainable Yield depends on:
i) Calculating Yield-to-Worst for each instrument and using this yield for reporting purposes;
ii) Using the contemporary value of Five-Year Canadas (set at 1.31% for the May 31 calculation) to estimate dividends after reset for FixedResets.

Most funds report Current Yield. For instance, ZPR reports a “Portfolio Yield” of 4.90% as of July 31, 2013 and notes:

Portfolio yield is calculated as the most recent income received by the ETF in the form of dividends interest and other income annualized based on the payment frequently divided by the current market value of ETFs investments.

In other words – it’s the Current Yield, a meaningless number. The Current Yield of MAPF is 5.32%, but I will neither report that with any degree of prominence nor take any great pleasure in the fact that it’s higher than the ZPR number. It’s meaningless; to accord it any prominence in portfolio reporting is misleading.

It should be noted that the concept of this Sustainable Income calculation was developed when the fund’s holdings were overwhelmingly PerpetualDiscounts – see, for instance, the bottom of the market in November 2008. It is easy to understand that for a PerpetualDiscount, the technique of multiplying yield by price will indeed result in the coupon – a PerpetualDiscount paying $1 annually will show a Sustainable Income of $1, regardless of whether the price is $24 or $17.

Things are not quite so neat when maturity dates and maturity prices that are different from the current price are thrown into the mix. If we take a notional Straight Perpetual paying $5 annually, the price is $100 when the yield is 5% (all this ignores option effects). As the yield increases to 6%, the price declines to 83.33; and 83.33 x 6% is the same $5. Good enough.

But a ten year bond, priced at 100 when the yield is equal to its coupon of 5%, will decline in price to 92.56; and 92.56 x 6% is 5.55; thus, the calculated Sustainable Income has increased as the price has declined as shown in the graph:
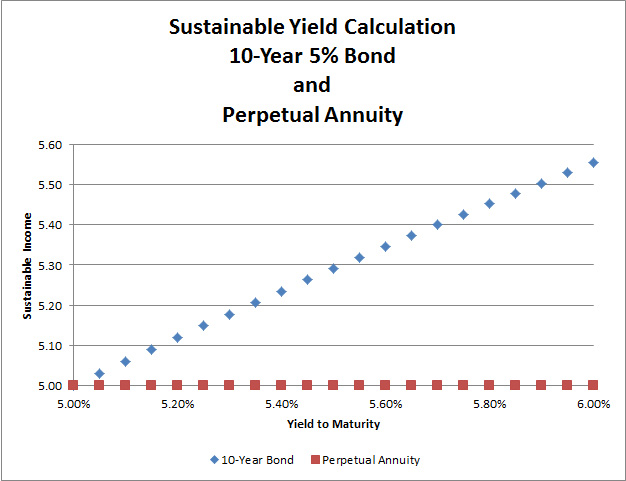

Click for Big

The difference is because the bond’s yield calculation includes the amortization of the discount; therefore, so does the Sustainable Income estimate.

Thus, the decline in the MAPF Sustainable Income from $0.5500 per unit in June, 2012, to $0.5216 per unit in July, 2013, should be looked at as a simple consequence of the fund’s holdings; virtually all of which have their yields calculated in a manner closer to bonds than to Perpetual Annuities.

Different assumptions lead to different results from the calculation, but the overall positive trend is apparent. I’m very pleased with the long-term results! It will be noted that if there was no trading in the portfolio, one would expect the sustainable yield to be constant (before fees and expenses). The success of the fund’s trading is showing up in

  • the very good performance against the index
  • the long term increases in sustainable income per unit

As has been noted, the fund has maintained a credit quality equal to or better than the index; outperformance is due to exploitation of trading anomalies.

Again, there are no predictions for the future! The fund will continue to trade between issues in an attempt to exploit market gaps in liquidity, in an effort to outperform the index and keep the sustainable income per unit – however calculated! – growing.

LFE.PR.B: 13H1 Report, Dividend Policy Announced For Capital Units

Monday, August 5th, 2013

On July 8, Quadravest announced:

Canadian Life Companies Split Corp. (the “Company”) is providing the following update to its shareholders. The net asset value (NAV) of the Company has grown over the past number of months due to increasing valuations of its underlying portfolio of life insurance companies. The Company invests primarily in the common shares of Manulife Financial, Sun Life Financial, Great-West Lifeco, and Industrial Alliance. The NAV of the Company today is approximately $14.50 ($13.68 fully diluted). This provides an intrinsic value for the Class A shareholder (LFE) of approximately $4.50 ($3.68 fully diluted). The Company would also like to take this opportunity to re-iterate its dividend policy on its Class A shares. The Company is restricted from paying dividends on its Class A shares until the undiluted NAV reaches $15.00. When, and if, the undiluted NAV exceeds $15.00, dividends will be re-instated.

On July 23, Quadravest announced:

– As stated in a previously disseminated press release on July 8, 2013, Canadian Life Companies Split Corp. (“the Company”) intends to reinstate dividends on its Class A share (TSX: LFE) when the undiluted net asset value (NAV) per unit of the Company exceeds $15. The NAV as of July 23, 2013 is above $14.75.

The Board of Directors indicates that the initial dividend, if and when reinstated, will be in the amount of $0.05 per month ($0.60 per annum). This dividend once reinstated will provide a current dividend yield of 17% based on the latest closing price of LFE on the Toronto Stock Exchange. The directors have taken into account the cash flow and sustainability of the dividend in determining the amount of the dividend. Due to the Company’s unique structure, the additional return to fund this payment is equivalent to a 4% return on the underlying portfolio. Future market value increases and cash flow increases will be used to increase this dividend up to $0.10 per month ($1.20 per annum) as circumstances warrant.

The Company invests primarily in the common shares of Manulife Financial, Sun Life Financial, Great-West Lifeco, and Industrial Alliance. As stated above, the current NAV of the Company today exceeds $14.75 ($13.88 fully diluted). This provides an intrinsic value for the Class A shareholder (LFE) of approximately $4.75 ($3.88 fully diluted).

According to the company, the undiluted NAV was 14.33 on July 31, and 13.69 fully diluted.

They have also released the 13H1 Financials for LFE, whence the following information can be extracted:

MER: The “Base Management Expense Ratio”, which excludes issuance costs and dividends paid on preferreds, is 1.05%.

Average Net Assets: Calculation of this figure is complicated by the exercise of warrants. Assets were 148.3-million at May 31 and 103.7-million at November 30. Giving the latter figure double weight (as the big warrant exercise was at the end of March) provides an average of 118.6-million. Considering dividends paid on the preferreds were $3.342-million and the preferreds pay 0.625 p.a., this implies an average of 10.69-million units outstanding, with an average NAVPU of (13.56 + 12.48) / 2 = 13.02, for a total of 13.02 x 10.69-million = 139.2-million. Taking the average of these two estimates provides a guess of Average Net Assets = 128.9-million.

Underlying Portfolio Yield: Dividends received of 2.178-million time 2 (semi-annual) divided by average net assets of 128.9-million is 3.38%. The main holdings of the fund are the Big Four Insurers:

Guess at LFE Portfolio Yield
Issuer Yield (as of 2013-8-2)
IAG 2.29%
MFC 2.80%
GWO 4.05%
SLF 4.32%
Average 3.36%

The agreement is astonishing (there have to be compensating errors in there somewhere) and justifies the use of 3.36% portfolio yield.

Income Coverage: Net Investment Income of 1,424,271 divided by Preferred Share Distributions of 3,342,072 is 42%. This figure is undoubtedly brought down by delays in investing the proceeds of the warrant exercise, and therefore of earning dividend income. If we say that the fully diluted NAV is 13.69 (as at 7/31) and the portfolio earns 3.36% (calculated above), that’s $0.4600 p.a. before about 0.10 expenses to pay 0.625 preferred dividends, is about 58%, which sounds like a better guess.

Given all this computation, we can now take a stab at estimated credit quality:

Credit Quality of LFE.PR.B
Parameter 0.60 Cap Unit Dividend 1.20 Cap Unit Dividend
Returns template SLF
Data Collection Period 2002-12-8 to 2010-12-8
Expected Annualized Return 7.00%
Underlying Dividend Yield 3.36%
Initial NAV 13.69
Pfd Redemption Value 10.00
Pfd Coupon 0.625
MER 1.05%
Cap Unit Div (above test) 0.60 1.20
Cap Unit Div (below test) 0.00
NAV Test 15.00
Whole Unit Par Value 25.00
Months to Redemption 64
 
Probability of Default 27.58% 29.95%
Loss Given Default 27.29% 26.11%
Expected Loss 7.53% 7.82%
 
Yield to Maturity
9.96 bid on 8/2
6.30%
Expected Redemption Price 9.25 9.22
Yield to Expectations 5.07% 5.02%

Note that there are some problems with the above calculation, beyond all the estimates discussed above: Capital Unit dividends will be paid based on the undiluted NAV and hence will generally be more than estimated by the credit quality calculator, which is based on diluted NAV.

Update: Assiduous Reader prefhound asks in the comments about the sensitivity of the Expected Default Loss to the expected total return. Actually it’s surprisingly little:


Click for Big

The above chart is taken from the December, 2010, edition of PrefLetter, in which the model is discussed in detail. This is part of the PrefLetter 2010 Collection, sold on the PrefLetter website for the low, low price of only $50. That’s right, only $50! Click on PrefLetter right now to purchase the 2010 Collection for only $50! My server is standing by!

Since there is a cash drag, the big problem is sensitivity to return distribution assumptions; see Split Share Credit Quality; as might be expected, sensitivity to everything increases as the NAV declines; see It’s All About Sequence.

MAPF Portfolio Composition: July, 2013

Monday, August 5th, 2013

Turnover returned to the quiet levels of the past two years in July, to about 4%.

There is extreme segmentation in the marketplace, with OSFI’s NVCC rule changes in February 2011 having had the effect of splitting the formerly relatively homogeneous Straight Perpetual class of preferreds into three parts:

  • Unaffected Straight Perpetuals
  • DeemedRetractibles explicitly subject to the rules (banks)
  • DeemedRetractibles considered by me, but not (yet!) by the market, to be likely to be explicitly subject to the rules in the future (insurers and insurance holding companies)

This segmentation, and the extreme valuation differences between the segments, has cut down markedly on the opportunities for trading. Another trend that hasn’t helped has been the migration of PerpetualDiscounts into PerpetualPremiums (due to price increases) – many of the PerpetualPremiums have negative Yields-to-Worst and those that don’t aren’t particularly thrilling; speaking very generally, PerpetualPremiums are to be avoided, not traded! This effect has caused the first of the three segments noted above to be untradeable for most practical purposes.

To make this more clear, it used to be that there were 70-odd Straight Perpetuals and I was more or less indifferent as to which ones I owned (subject, of course, to issuer concentration concerns and other risk management factors). Thus, if any one of these 70 were to go down in price by – say – $0.25, I would quite often have something in inventory that I’d be willing to swap for it. The segmentation means that I am no longer indifferent; in addition to checking the valuation of a potential buy to its peers, I also have to check its peer group. This cuts down on the potential for trading.

There is no real hope that this situation will be corrected in the near-term. OSFI has indicated that the long-promised “Draft Definition of Capital” for insurers will not be issued “for public consultation in late 2012 or early 2013”, as they fear that it might encourage speculation in the marketplace. It is not clear why OSFI is so afraid of informed speculation, since the constant speculation in the marketplace is currently less informed than it would be with a little bit of regulatory clarity.

As a result of this delay, I have extended the Deemed Maturity date for insurers and insurance holding companies by three years (to 2025-1-31), in the expectation that when OSFI finally does provide clarity, they will allow the same degree of lead-in time for these companies as they did for banks. This has obviously had a major effect on the durations of preferred shares subject to the change but, fortunately, not much on their calculated yields as most of these issues are either trading near par or were trading at sufficient premium that a par call was expected on economic grounds. However, with the declines in the market over the past two months, the expected capital gain on redemption of the insurance-issued DeemedRetractibles has become an important component of the calculated yield.

Sectoral distribution of the MAPF portfolio on July 31 was as follows:

MAPF Sectoral Analysis 2013-7-31
HIMI Indices Sector Weighting YTW ModDur
Ratchet 0% N/A N/A
FixFloat 0% N/A N/A
Floater 0% N/A N/A
OpRet 0% N/A N/A
SplitShare 18.7% (-0.6) 4.39% 6.39
Interest Rearing 0% N/A N/A
PerpetualPremium 0.0% (0) N/A N/A
PerpetualDiscount 1.2% (+0.5) 5.15% 15.12
Fixed-Reset 20.3% (-2.8) 3.20% 0.89
Deemed-Retractible 52.0% (-0.5) 5.93% 8.62
Scraps (Various) 7.7% (+3.1) 6.61% 11.49
Cash 0% (+0.2) 0.00% 0.00
Total 100% 5.13% 6.93
Totals and changes will not add precisely due to rounding. Bracketted figures represent change from June month-end. Cash is included in totals with duration and yield both equal to zero.
DeemedRetractibles are comprised of all Straight Perpetuals (both PerpetualDiscount and PerpetualPremium) issued by BMO, BNS, CM, ELF, GWO, HSB, IAG, MFC, NA, RY, SLF and TD, which are not exchangable into common at the option of the company. These issues are analyzed as if their prospectuses included a requirement to redeem at par on or prior to 2022-1-31 (banks) or 2025-1-3 (insurers and insurance holding companies), in addition to the call schedule explicitly defined. See OSFI Does Not Grandfather Extant Tier 1 Capital, CM.PR.D, CM.PR.E, CM.PR.G: NVCC Status Confirmed and the January, February, March and June, 2011, editions of PrefLetter for the rationale behind this analysis. (all recent editions have a short summary of the argument included in the “DeemedRetractible” section)

Note that the estimate for the time this will become effective for insurers and insurance holding companies was extended by three years in April 2013, due to the delays in OSFI’s providing clarity on the issue.

The “total” reflects the un-leveraged total portfolio (i.e., cash is included in the portfolio calculations and is deemed to have a duration and yield of 0.00.). MAPF will often have relatively large cash balances, both credit and debit, to facilitate trading. Figures presented in the table have been rounded to the indicated precision.

Credit distribution is:

MAPF Credit Analysis 2013-7-31
DBRS Rating Weighting
Pfd-1 0 (0)
Pfd-1(low) 40.5% (-2.5)
Pfd-2(high) 33.4% (-0.3)
Pfd-2 8.6% (+0.2)
Pfd-2(low) 9.8% (-0.8)
Pfd-3(high) 0.0% (-1.0)
Pfd-3 3.8% (+2.1)
Pfd-3(low) 1.7% (+1.1)
Pfd-4(high) 0.4% (0)
Pfd-4 1.0% (-0.1)
Pfd-4(low) 0.8% (0)
Cash 0% (+0.2)
Totals will not add precisely due to rounding. Bracketted figures represent change from June month-end.

The increase in lower quality issues was due to the fund’s taking small positions in several lower quality, low spread FixedResets that plunged in value during the month, notably (month’s performance in brackets): FFH.PR.E (-7.31%), CPX.PR.E (-6.68%), TA.PR.D (-8.24%) and TA.PR.F (-10.42%).

Liquidity Distribution is:

MAPF Liquidity Analysis 2013-7-31
Average Daily Trading Weighting
<$50,000 0.4% (-0.2)
$50,000 – $100,000 8.0% (+1.3)
$100,000 – $200,000 21.6% (+10.4)
$200,000 – $300,000 47.1% (+10.9)
>$300,000 23.0% (-1.8)
Cash 0% (+0.2)
Totals will not add precisely due to rounding. Bracketted figures represent change from June month-end.

MAPF is, of course, Malachite Aggressive Preferred Fund, a “unit trust” managed by Hymas Investment Management Inc. Further information and links to performance, audited financials and subscription information are available the fund’s web page. The fund may be purchased either directly from Hymas Investment Management or through a brokerage account at Odlum Brown Limited. A “unit trust” is like a regular mutual fund, but is sold by offering memorandum rather than prospectus. This is cheaper, but means subscription is restricted to “accredited investors” (as defined by the Ontario Securities Commission) or those who subscribe for $150,000+. Fund past performances are not a guarantee of future performance. You can lose money investing in MAPF or any other fund.

A similar portfolio composition analysis has been performed on the Claymore Preferred Share ETF (symbol CPD) (and other funds) as of August 31, 2012, and published in the October (mainly methodology), November (most funds), and December (ZPR) 2012, PrefLetter. While direct comparisons are difficult due to the introduction of the DeemedRetractible class of preferred share (see above) it is fair to say:

  • MAPF credit quality is better
  • MAPF liquidity is a lower
  • MAPF Yield is higher
  • Weightings in
    • MAPF is much more exposed to DeemedRetractibles
    • MAPF is much less exposed to Operating Retractibles
    • MAPF is much more exposed to SplitShares
    • MAPF is less exposed to FixFloat / Floater / Ratchet
    • MAPF weighting in FixedResets is much lower