Archive for April, 2014

April 10, 2014

Thursday, April 10th, 2014

Let’s all give three cheers for increased regulation:

New rules aimed at making the world safer from blowups in the $693 trillion derivatives market are poised to drive up costs so much for retirement funds and other users that bankers say they do just the opposite.

The toughened standards, hatched five years ago after derivative losses almost crashed the global economy, are meant to safeguard trades and bring more openness to a market whose secrecy and sheer size overwhelmed regulators in 2008. Where swaps had been one-on-one deals before, now they would be backstopped by third parties in clearinghouses that ensure everyone can pay, with the aim of avoiding emergency bailouts and panic.

Rules being finalized by the Basel Committee on Banking Supervision in Switzerland will require banks to set aside more money in the event the swaps go bad. And not just a little bit more — as much as 92 times, or 9,100 percent, more, according to calculations by three banks shared with Bloomberg News. The higher costs in turn may cause market participants to flee rather than take advantage of the clearinghouses, making it more difficult for those third-party guarantors.

Since banks act as customers’ gatekeepers to the clearinghouses, the Basel committee wants them to protect themselves — and the global financial system — by matching every dollar they contribute to the default fund with a dollar of capital.

If the rules were adopted, swaps dealers say that only the wealthiest investors would be able to use clearinghouses. Fewer members would mean eroded financial support for the clearinghouses, which are the last backstop before losses are borne by taxpayers.

Executives in a bank’s treasury department don’t allocate the firm’s money to trading desks without a guarantee that the profit on it will be about 10 percent to 15 percent a year after taxes, depending on the bank. In many cases, banks earn these returns by charging fees to clients.

In one bank’s internal model, a $100 million interest-rate swap between a dealer and its customer prior to the new Basel proposal would have meant that, before taxes, $14,750 in capital had to be set aside.

When the bank’s trading desk asks the firm’s treasury for $14,750 as part of the trade, the traders would have to earn $3,404 per year before taxes for as long as the swap was active. That’s in the old days.

The same $100 million swap would look different under the new proposal. As part of accepting that trade, the clearinghouse would require the bank to deposit $1.2 million into its default fund. Under the Basel committee proposal, the bank would have to have $1.2 million more capital.

According to the dealer bank, it would be required to generate more than $276,000 a year before taxes for that amount of capital. When charges such as the cost of funding and others are added to the trade, the tab balloons to $307,327 a year, the dealer said.

Fortunately, these new rules have been softened:

The Basel Committee on Banking Supervision’s final rule, released today, would require swaps dealers to hold less cash to protect against defaults than did a proposal published last year. The plan now applies a minimum 20 percent risk weighting to money deposited at clearinghouses, which are third parties that guarantee the transactions, down from 1,250 percent in the original proposal. The change takes effect on Jan. 1, 2017.

But central clearing is still a dumb idea.

Here’s yet another indicator that the HFT panic is a marketing gimmick:

Royal Bank has emerged as a leader against predatory high-frequency trading at a time of increasing scrutiny from both regulators and the public after the release of Lewis’s book, which claims the stock market is “rigged” against investors. The bank is described by Lewis as fostering an “RBC nice” culture with its “no asshole rule” on hiring.

High-frequency trading isn’t inherently good or bad, Mills said. The problem arises when certain market players use technology to take advantage of others.

“That’s what we need as an industry, to see regulation mature to the point where it can begin to eliminate those predatory practices, and that’s where we’ll level the playing field,” Mills said in a telephone interview yesterday.

Royal Bank, along with seven partners, owns a stake in and helped found Aequitas, a market with similar goals to IEX. The Toronto-based bank is Canada’s second-largest lender by assets.

“One thing that’s clear is that RBC is the common denominator between IEX and Aequitas,” said Jos Schmitt, chief executive officer at Toronto-based Aequitas, in an April 1 interview at the company’s headquarters in Royal Bank Plaza. “It tells you something about where they come from, what they stand for and what they seek to achieve. They translated that to being the spark in a change on Wall Street and on Bay Street.”

High-frequency trading firms have been accused of ripping off investors in the $22 trillion U.S. stock market by using tactics including paying for the right to trade in dark pools and placing their servers as close to the exchange as possible to speed up trading.

Royal Bank saw what its competitors were doing and decided to go in a different direction, Mills said.

I’ve been saying for a while that the economy’s still no good, and that while government yields are clearly unsustainable, there is not yet a clear trigger of impending doom. Looks like there’s some support for that idea:

Federal Reserve Chair Janet Yellen and her international counterparts are suffering from a case of what psychologists call confirmation bias: They keep insisting inflation will accelerate even as it continues to ebb.

That’s the diagnosis of Ethan Harris, co-head of global economics research at Bank of America Corp. in New York. He says central bankers are seeing what they want to see by blaming subpar inflation in their countries on temporary, partly home-grown forces. That risks ignoring more lasting, global influences ranging from weak worldwide demand and more emerging-market competition to cheap labor in developing nations, cooling commodity prices and technological breakthroughs.

“There is much lower-than-expected inflation showing up in too many places in the world to dismiss it as transitory,” said Allen Sinai, chief executive officer at consultant Decision Economics Inc. in New York.

Almost two-thirds of the 121 economies tracked by Bloomberg are experiencing smaller gains in consumer prices than a year ago, with many undershooting their goals. Global inflation was just 2 percent in February, the lowest since late 2009, when the world was struggling with recession, according to a tally by economists at JPMorgan Chase & Co.

Greece and Ireland were in the bond market today:

Italian bonds gained for a second day and Belgian, French and German securities also rallied. Greek bonds fell, pushing 10-year yields up from near the lowest level since February 2010, as the nation agreed to sell 3 billion euros ($4.17 billion) of five-year notes via banks. Greece received about 600 orders for a total of around 20 billion euros, a person familiar with the sale said. Ireland auctioned 1 billion euros of 10-year debt at a record-low yield.

“Bond markets have woken up on a positive note on the back of a dovish set of Fed minutes,” said Richard McGuire, a fixed-income strategist at Rabobank International in London. “This is a classic case of an improving liquidity outlook raising all boats. The strong demand for Greece’s five-year issue is symptomatic of a positive liquidity outlook trumping more fundamental concern.”

It was another positive day for the Canadian preferred share market, with PerpetualDiscounts winning 16bp, FixedResets up 5bp and DeemedRetractibles gaining 2bp. It is interesting to note that the median YTW on DeemedRetractibles remained negative for the second straight day and the fifth time on record, joining 2012-12-28, 2013-1-4 and 2013-1-10. Volatility was negligible. Volume was below average.

HIMIPref™ Preferred Indices
These values reflect the December 2008 revision of the HIMIPref™ Indices

Values are provisional and are finalized monthly
Index Mean
Current
Yield
(at bid)
Median
YTW
Median
Average
Trading
Value
Median
Mod Dur
(YTW)
Issues Day’s Perf. Index Value
Ratchet 0.00 % 0.00 % 0 0.00 0 -0.5222 % 2,443.1
FixedFloater 4.67 % 3.96 % 35,745 17.45 1 0.0000 % 3,633.5
Floater 2.98 % 3.08 % 49,680 19.55 4 -0.5222 % 2,637.8
OpRet 4.36 % -4.07 % 33,382 0.14 2 -0.0969 % 2,692.1
SplitShare 4.81 % 4.41 % 62,652 4.26 5 -0.1588 % 3,084.2
Interest-Bearing 0.00 % 0.00 % 0 0.00 0 -0.0969 % 2,461.7
Perpetual-Premium 5.54 % -6.57 % 102,763 0.09 13 0.0030 % 2,386.2
Perpetual-Discount 5.43 % 5.37 % 123,448 14.61 23 0.1557 % 2,483.0
FixedReset 4.68 % 3.64 % 210,169 4.20 79 0.0530 % 2,532.6
Deemed-Retractible 5.03 % -0.19 % 146,496 0.13 42 0.0211 % 2,491.1
FloatingReset 2.63 % 2.38 % 213,546 4.12 5 -0.0239 % 2,479.8
Performance Highlights
Issue Index Change Notes
BAM.PR.K Floater -1.22 % YTW SCENARIO
Maturity Type : Limit Maturity
Maturity Date : 2044-04-10
Maturity Price : 16.94
Evaluated at bid price : 16.94
Bid-YTW : 3.11 %
SLF.PR.G FixedReset 1.02 % YTW SCENARIO
Maturity Type : Hard Maturity
Maturity Date : 2025-01-31
Maturity Price : 25.00
Evaluated at bid price : 22.81
Bid-YTW : 4.33 %
Volume Highlights
Issue Index Shares
Traded
Notes
TRP.PR.E FixedReset 252,250 Scotia crossed one block of 50,000 and two of 100,000 each, all at 25.45.
YTW SCENARIO
Maturity Type : Call
Maturity Date : 2019-10-30
Maturity Price : 25.00
Evaluated at bid price : 25.43
Bid-YTW : 3.88 %
TRP.PR.A FixedReset 68,622 Nesbitt crossed 50,000 at 23.75.
YTW SCENARIO
Maturity Type : Limit Maturity
Maturity Date : 2044-04-10
Maturity Price : 22.95
Evaluated at bid price : 23.60
Bid-YTW : 3.87 %
RY.PR.I FixedReset 59,705 RBC crossed 50,000 at 25.60.
YTW SCENARIO
Maturity Type : Call
Maturity Date : 2019-02-24
Maturity Price : 25.00
Evaluated at bid price : 25.60
Bid-YTW : 3.10 %
TRP.PR.B FixedReset 55,765 Nesbitt crossed 50,000 at 20.65.
YTW SCENARIO
Maturity Type : Limit Maturity
Maturity Date : 2044-04-10
Maturity Price : 20.61
Evaluated at bid price : 20.61
Bid-YTW : 3.74 %
BAM.PR.R FixedReset 52,959 RBC crossed 49,900 at 25.30.
YTW SCENARIO
Maturity Type : Limit Maturity
Maturity Date : 2044-04-10
Maturity Price : 23.64
Evaluated at bid price : 25.30
Bid-YTW : 4.04 %
TD.PR.T FloatingReset 42,475 Scotia crossed 40,000 at 24.95.
YTW SCENARIO
Maturity Type : Call
Maturity Date : 2018-07-31
Maturity Price : 25.00
Evaluated at bid price : 24.97
Bid-YTW : 2.51 %
There were 28 other index-included issues trading in excess of 10,000 shares.
Wide Spread Highlights
Issue Index Quote Data and Yield Notes
ENB.PR.D FixedReset Quote: 24.41 – 24.70
Spot Rate : 0.2900
Average : 0.1746

YTW SCENARIO
Maturity Type : Limit Maturity
Maturity Date : 2044-04-10
Maturity Price : 23.04
Evaluated at bid price : 24.41
Bid-YTW : 4.13 %

CU.PR.E Perpetual-Discount Quote: 23.79 – 24.23
Spot Rate : 0.4400
Average : 0.3289

YTW SCENARIO
Maturity Type : Limit Maturity
Maturity Date : 2044-04-10
Maturity Price : 23.44
Evaluated at bid price : 23.79
Bid-YTW : 5.20 %

CU.PR.C FixedReset Quote: 25.66 – 25.99
Spot Rate : 0.3300
Average : 0.2316

YTW SCENARIO
Maturity Type : Call
Maturity Date : 2017-06-01
Maturity Price : 25.00
Evaluated at bid price : 25.66
Bid-YTW : 3.27 %

PWF.PR.A Floater Quote: 19.42 – 20.00
Spot Rate : 0.5800
Average : 0.4991

YTW SCENARIO
Maturity Type : Limit Maturity
Maturity Date : 2044-04-10
Maturity Price : 19.42
Evaluated at bid price : 19.42
Bid-YTW : 2.72 %

BNS.PR.P FixedReset Quote: 25.15 – 25.35
Spot Rate : 0.2000
Average : 0.1222

YTW SCENARIO
Maturity Type : Call
Maturity Date : 2018-04-25
Maturity Price : 25.00
Evaluated at bid price : 25.15
Bid-YTW : 3.15 %

MFC.PR.L FixedReset Quote: 24.74 – 24.92
Spot Rate : 0.1800
Average : 0.1093

YTW SCENARIO
Maturity Type : Hard Maturity
Maturity Date : 2025-01-31
Maturity Price : 25.00
Evaluated at bid price : 24.74
Bid-YTW : 4.09 %

PrefLetter.com Unaffected by “Heartbleed” Vulnerability

Thursday, April 10th, 2014

Many people will have heard of the so-called “Heartbleed Vulnerability” that has afflicted many organizations:

The plain truth is that many organizations spend far more on touting their wares and services online and making their web sites as user friendly as possible than they do on safeguarding information. The Heartbleed bug underscores the dangers that lurk in the underbrush, ready to ambush even the most sophisticated of Internet players. And it ought to prompt much more serious investment in strong security measures and the capacity to quickly detect flaws and squelch breaches.

Unlike the malware attack that resulted in the stunning theft from Target Corp. of about 40 million payment card numbers and some 70 million customer records, the Heartbleed bug was not concocted by some clever teenage hacker for criminal clients. It’s a critical software programming glitch in a data encription standard called OpenSSL, one that has existed for the past two years. OpenSSL is widely used to safeguard traffic between web users and a vast number of servers storing data for a majority of web sites.

This has extended even to the Canada Revenue Agency:

A major cybersecurity flaw that exposes encrypted information to hackers has forced the Canada Revenue Agency to shut down its filing system and push back the deadline for online returns.

I am pleased to advise that as part of the migration of PrefLetter to a new server, the operating system changed from Linux to MS-Windows. Windows is unaffected by the Heartbleed Vulnerability:

Windows comes with its own encryption component called Secure Channel (a.k.a. SChannel), which is not susceptible to the Heartbleed vulnerability.

April 9, 2014

Wednesday, April 9th, 2014

Nothing happened today.

It was a mixed day for the Canadian preferred share market, with PerpetualDiscounts off 3bp, FixedResets up 12bp and DeemedRetractibles gaining 11bp. Volatility was only technically existent. Volume was a little below average.

PerpetualDiscounts now yield 5.42%, equivalent to 7.05% interest at the standard equivalency factor of 1.3x. Long corporates now yield about 4.5%, so the pre-tax interest-equivalent spread (in this context, the “Seniority Spread”) is now about 255bp, a slight (and perhaps spurious) decline from the 260bp reported April 2)
.

HIMIPref™ Preferred Indices
These values reflect the December 2008 revision of the HIMIPref™ Indices

Values are provisional and are finalized monthly
Index Mean
Current
Yield
(at bid)
Median
YTW
Median
Average
Trading
Value
Median
Mod Dur
(YTW)
Issues Day’s Perf. Index Value
Ratchet 0.00 % 0.00 % 0 0.00 0 -0.7702 % 2,455.9
FixedFloater 4.67 % 3.96 % 36,158 17.46 1 0.1477 % 3,633.5
Floater 2.96 % 3.06 % 49,489 19.61 4 -0.7702 % 2,651.7
OpRet 4.36 % -5.54 % 32,957 0.15 2 -0.1740 % 2,694.7
SplitShare 4.80 % 4.39 % 62,588 4.26 5 0.0795 % 3,089.1
Interest-Bearing 0.00 % 0.00 % 0 0.00 0 -0.1740 % 2,464.1
Perpetual-Premium 5.54 % -7.55 % 100,552 0.09 13 0.0877 % 2,386.1
Perpetual-Discount 5.44 % 5.42 % 120,199 14.60 23 -0.0281 % 2,479.2
FixedReset 4.68 % 3.63 % 203,952 4.20 79 0.1169 % 2,531.3
Deemed-Retractible 5.03 % -0.18 % 147,695 0.14 42 0.1091 % 2,490.6
FloatingReset 2.63 % 2.36 % 197,698 4.28 5 0.3112 % 2,480.4
Performance Highlights
Issue Index Change Notes
PWF.PR.A Floater -2.47 % YTW SCENARIO
Maturity Type : Limit Maturity
Maturity Date : 2044-04-09
Maturity Price : 19.36
Evaluated at bid price : 19.36
Bid-YTW : 2.73 %
Volume Highlights
Issue Index Shares
Traded
Notes
TRP.PR.C FixedReset 690,077 RBC crossed two blocks of 342,200 each, both at 22.34. Nice tickets!
YTW SCENARIO
Maturity Type : Limit Maturity
Maturity Date : 2044-04-09
Maturity Price : 21.67
Evaluated at bid price : 22.11
Bid-YTW : 3.77 %
BNS.PR.L Deemed-Retractible 102,235 Scotia crossed blocks of 51,100 and 48,000, both at 25.70.
YTW SCENARIO
Maturity Type : Call
Maturity Date : 2014-05-26
Maturity Price : 25.50
Evaluated at bid price : 25.66
Bid-YTW : -2.41 %
BNS.PR.R FixedReset 85,850 RBC crossed blocks of 25,000 and 60,000, both at 25.75.
YTW SCENARIO
Maturity Type : Call
Maturity Date : 2019-01-26
Maturity Price : 25.00
Evaluated at bid price : 25.65
Bid-YTW : 3.21 %
BMO.PR.J Deemed-Retractible 78,598 RBC crossed 70,000 at 25.75.
YTW SCENARIO
Maturity Type : Call
Maturity Date : 2014-05-09
Maturity Price : 25.50
Evaluated at bid price : 25.78
Bid-YTW : -2.59 %
TD.PR.T FloatingReset 54,788 Scotia crossed 50,000 at 24.96.
YTW SCENARIO
Maturity Type : Hard Maturity
Maturity Date : 2022-01-31
Maturity Price : 25.00
Evaluated at bid price : 24.96
Bid-YTW : 2.52 %
GWO.PR.N FixedReset 51,967 RBC crossed 50,000 at 22.40.
YTW SCENARIO
Maturity Type : Hard Maturity
Maturity Date : 2025-01-31
Maturity Price : 25.00
Evaluated at bid price : 22.38
Bid-YTW : 4.39 %
There were 27 other index-included issues trading in excess of 10,000 shares.
Wide Spread Highlights
Issue Index Quote Data and Yield Notes
PWF.PR.A Floater Quote: 19.36 – 20.00
Spot Rate : 0.6400
Average : 0.4104

YTW SCENARIO
Maturity Type : Limit Maturity
Maturity Date : 2044-04-09
Maturity Price : 19.36
Evaluated at bid price : 19.36
Bid-YTW : 2.73 %

FTS.PR.J Perpetual-Discount Quote: 23.66 – 24.00
Spot Rate : 0.3400
Average : 0.2494

YTW SCENARIO
Maturity Type : Limit Maturity
Maturity Date : 2044-04-09
Maturity Price : 23.33
Evaluated at bid price : 23.66
Bid-YTW : 5.06 %

MFC.PR.G FixedReset Quote: 25.96 – 26.15
Spot Rate : 0.1900
Average : 0.1101

YTW SCENARIO
Maturity Type : Call
Maturity Date : 2016-12-19
Maturity Price : 25.00
Evaluated at bid price : 25.96
Bid-YTW : 3.01 %

W.PR.J Perpetual-Discount Quote: 24.88 – 25.14
Spot Rate : 0.2600
Average : 0.1816

YTW SCENARIO
Maturity Type : Limit Maturity
Maturity Date : 2044-04-09
Maturity Price : 24.62
Evaluated at bid price : 24.88
Bid-YTW : 5.65 %

GWO.PR.I Deemed-Retractible Quote: 21.90 – 22.15
Spot Rate : 0.2500
Average : 0.1760

YTW SCENARIO
Maturity Type : Hard Maturity
Maturity Date : 2025-01-31
Maturity Price : 25.00
Evaluated at bid price : 21.90
Bid-YTW : 6.13 %

CU.PR.E Perpetual-Discount Quote: 23.79 – 24.07
Spot Rate : 0.2800
Average : 0.2071

YTW SCENARIO
Maturity Type : Limit Maturity
Maturity Date : 2044-04-09
Maturity Price : 23.44
Evaluated at bid price : 23.79
Bid-YTW : 5.20 %

April 8, 2014

Tuesday, April 8th, 2014

This could get interesting:

Expectations are building that TMX is getting close to unveiling its plans for a network. TMX has acknowledged that microwaves are a priority but so far the company has not given any specifics.

“We do know that microwaves [are] an important opportunity out there and we have to bring that to this marketplace, we’re just trying to figure out how,” TMX chief executive officer Tom Kloet said in a recent interview.

The speed advantage of microwaves is significant. Because of that, the owner would be able to charge speed-focused traders a high price for access. That’s especially true if there are only a small number of spots on the microwave network.

A microwave link between the TMX Group’s Toronto Stock Exchange data centre in suburban Toronto and the U.S. stock market data centres in New Jersey would be as much as 5 milliseconds faster than a fibre-optic link because microwaves travel more quickly and have a more direct route through the air, ITG Canada estimated in a report earlier this year.

Trial attorney Jim Kidney of the SEC is retiring … but he gave a farewell speech:

The revolving door is a very serious problem. I have had bosses, and bosses of my bosses, whose names we all know, who made little secret that they were here to punch their ticket. They mouthed serious regard for the mission of the Commission, but their actions were tentative and fearful in many instances. You can get back to Wall Street by acting tough, by using the SEC publicity apparatus to promote yourself as tough, and maybe even on a few occasions being tough, if you pick your targets carefully. But don’t appear to fail. Don’t take risks where risk would count. That is not the intended message from the ticket punchers, of course, but it is the one I got on the occasions when I was involved in a high profile case or two. The revolving door doesn’t push the agency’s enforcement envelope very often or very far.

The attitude trickles down the ranks. Combined with the negative views of the civil service promoted by politicians and the beatings we take from the public, it is no surprise that we lose our best and brightest as they see no place to go in the agency and eventually decide they are just going to get their own ticket to a law firm or corporate job punched.

Please don’t tell me we account for other factors in our management of cases. We think about them, of course, but we all see cases frequently to which we offer a head scratching response. Really? The SEC spent time and money on that? These cases have no significant impact and the conduct is of minimal or no harm to the investing public. But the investigation has been intense and expensive. Could no one in management exercise judgment and call the investigation to a halt? Of course not! Bringing the case is a stat!

The metric [quantity] we have now is built into the soul of the Division. It has to be removed root and branch.

Jonathan Weil of Bloomberg wants to make Jim Kidney a commissioner [link now broken? What’s up with that?]; the speech has attracted some press notice:

The SEC also sued Fabrice Tourre, who was vice president on the team that put together the deal at issue in the SEC case, known as Abacus 2007-AC1. A federal jury found Tourre liable last year, and he was ordered in March to pay $825,000 in penalties and other costs.

Kidney, who was part of the initial team that was building the Goldman Sachs case, pressed his bosses in the enforcement division to go higher up the chain. He later took himself off the team after being given a lesser role, according to people familiar with the matter.

In particular, the people said, Kidney argued that the commission should sue Tourre’s boss, Jonathan Egol. Kidney also wanted to bring a case against Paulson & Co. or some executives at the hedge fund, which helped pick the portfolio of securities that were underlying the Abacus vehicle and then bet against it.

The SEC ultimately decided not to sue Egol, the Paulson firm or any individuals from the hedge fund.

While Kidney declined to comment on the Goldman case in particular, much of his role is laid out in a September 2010 report by the agency’s inspector general’s office, which reviewed whether the SEC succumbed to political pressure in bringing the enforcement action. Kidney’s name is blacked out in the report.

He sounds like an honourable man. It seems clear that if there was in fact anything bad about the Abacus deal – Assiduous Readers will remember that I don’t think there was – then Fabrice Tourre should have been only a minor target.

It was a good day for the Canadian preferred share market, with PerpetualDiscounts winning 28bp, FixedResets gaining 8bp and DeemedRetractibles up 21bp. Volatility was minimal. Volume was below average.

HIMIPref™ Preferred Indices
These values reflect the December 2008 revision of the HIMIPref™ Indices

Values are provisional and are finalized monthly
Index Mean
Current
Yield
(at bid)
Median
YTW
Median
Average
Trading
Value
Median
Mod Dur
(YTW)
Issues Day’s Perf. Index Value
Ratchet 0.00 % 0.00 % 0 0.00 0 -0.0840 % 2,474.9
FixedFloater 4.68 % 4.28 % 35,908 17.72 1 -0.1966 % 3,628.1
Floater 2.94 % 3.05 % 49,643 19.62 4 -0.0840 % 2,672.3
OpRet 4.35 % -7.45 % 33,031 0.15 2 0.3493 % 2,699.4
SplitShare 4.81 % 4.39 % 63,403 4.26 5 -0.0477 % 3,086.6
Interest-Bearing 0.00 % 0.00 % 0 0.00 0 0.3493 % 2,468.4
Perpetual-Premium 5.55 % -7.54 % 101,279 0.09 13 0.1090 % 2,384.0
Perpetual-Discount 5.43 % 5.42 % 121,699 14.61 23 0.2840 % 2,479.9
FixedReset 4.68 % 3.64 % 206,009 4.20 79 0.0848 % 2,528.3
Deemed-Retractible 5.03 % 1.05 % 148,469 0.14 42 0.2074 % 2,487.9
FloatingReset 2.64 % 2.41 % 183,028 4.28 5 0.1919 % 2,472.7
Performance Highlights
Issue Index Change Notes
BAM.PF.C Perpetual-Discount 1.06 % YTW SCENARIO
Maturity Type : Limit Maturity
Maturity Date : 2044-04-08
Maturity Price : 21.02
Evaluated at bid price : 21.02
Bid-YTW : 5.82 %
TRP.PR.A FixedReset 1.07 % YTW SCENARIO
Maturity Type : Limit Maturity
Maturity Date : 2044-04-08
Maturity Price : 22.95
Evaluated at bid price : 23.60
Bid-YTW : 3.87 %
Volume Highlights
Issue Index Shares
Traded
Notes
ENB.PR.T FixedReset 81,610 RBC crossed 50,000 at 24.32.
YTW SCENARIO
Maturity Type : Limit Maturity
Maturity Date : 2044-04-08
Maturity Price : 22.89
Evaluated at bid price : 24.29
Bid-YTW : 4.24 %
CU.PR.F Perpetual-Discount 68,997 Nesbitt crossed 60,000 at 23.85.
YTW SCENARIO
Maturity Type : Limit Maturity
Maturity Date : 2044-04-08
Maturity Price : 21.51
Evaluated at bid price : 21.80
Bid-YTW : 5.21 %
CU.PR.D Perpetual-Discount 67,522 Nesbitt crossed 60,000 at 21.70.
YTW SCENARIO
Maturity Type : Limit Maturity
Maturity Date : 2044-04-08
Maturity Price : 23.55
Evaluated at bid price : 23.91
Bid-YTW : 5.17 %
BAM.PF.B FixedReset 64,568 Scotia crossed 45,700 at 24.95.
YTW SCENARIO
Maturity Type : Limit Maturity
Maturity Date : 2044-04-08
Maturity Price : 23.15
Evaluated at bid price : 24.95
Bid-YTW : 4.23 %
BAM.PF.E FixedReset 61,289 YTW SCENARIO
Maturity Type : Limit Maturity
Maturity Date : 2044-04-08
Maturity Price : 23.02
Evaluated at bid price : 24.75
Bid-YTW : 4.29 %
RY.PR.I FixedReset 54,614 RBC crossed 50,000 at 25.60.
YTW SCENARIO
Maturity Type : Call
Maturity Date : 2019-02-24
Maturity Price : 25.00
Evaluated at bid price : 25.58
Bid-YTW : 3.11 %
There were 26 other index-included issues trading in excess of 10,000 shares.
Wide Spread Highlights
Issue Index Quote Data and Yield Notes
GWO.PR.P Deemed-Retractible Quote: 25.11 – 25.49
Spot Rate : 0.3800
Average : 0.2418

YTW SCENARIO
Maturity Type : Hard Maturity
Maturity Date : 2025-01-31
Maturity Price : 25.00
Evaluated at bid price : 25.11
Bid-YTW : 5.39 %

TD.PR.Y FixedReset Quote: 25.28 – 25.58
Spot Rate : 0.3000
Average : 0.1935

YTW SCENARIO
Maturity Type : Call
Maturity Date : 2018-10-31
Maturity Price : 25.00
Evaluated at bid price : 25.28
Bid-YTW : 3.26 %

MFC.PR.B Deemed-Retractible Quote: 22.40 – 22.70
Spot Rate : 0.3000
Average : 0.2017

YTW SCENARIO
Maturity Type : Hard Maturity
Maturity Date : 2025-01-31
Maturity Price : 25.00
Evaluated at bid price : 22.40
Bid-YTW : 6.04 %

FTS.PR.K FixedReset Quote: 24.80 – 25.10
Spot Rate : 0.3000
Average : 0.2116

YTW SCENARIO
Maturity Type : Limit Maturity
Maturity Date : 2044-04-08
Maturity Price : 23.10
Evaluated at bid price : 24.80
Bid-YTW : 3.78 %

GWO.PR.H Deemed-Retractible Quote: 22.99 – 23.20
Spot Rate : 0.2100
Average : 0.1366

YTW SCENARIO
Maturity Type : Hard Maturity
Maturity Date : 2025-01-31
Maturity Price : 25.00
Evaluated at bid price : 22.99
Bid-YTW : 5.91 %

MFC.PR.H FixedReset Quote: 26.14 – 26.35
Spot Rate : 0.2100
Average : 0.1469

YTW SCENARIO
Maturity Type : Call
Maturity Date : 2017-03-19
Maturity Price : 25.00
Evaluated at bid price : 26.14
Bid-YTW : 3.07 %

MAPF Performance: March, 2014

Tuesday, April 8th, 2014

The fund outperformed the indices in March, with no particular internal themes apparent from an examination of the issues’ contributions to relative performance. Overall, the fund benefitted from its extreme underweight position in FixedResets, which underperformed significantly during the month.

relPerf_140331>
Click for Big

relYield>
Click for Big

I continue to believe that the decline in the preferred share market has been overdone; the following table shows the increase in yields since May 22 of some fixed income sectors:

Yield Changes
May 22, 2013
to
March 31, 2014
Sector Yield
May 22
Yield
March 31
Change
Five-Year Canadas 1.38% 1.71% +33bp
Long Canadas 2.57% 2.96% +39bp
Long Corporates 4.15% 4.5% +35bp
FixedResets
Investment Grade
(Interest Equivalent)
3.51% 4.73% +122bp
Perpetual-Discounts
Investment Grade
(Interest Equivalent)
6.34% 7.05% +71bp
The change in yield of PerpetualDiscounts is understated due a massive influx of issues from the PerpetualPremium sub-index over the period, which improved credit quality. When the four issues that comprised the PerpetualDiscount sub-index as of May 22, 2013 are evaluated as of February 28, 2014, the interest-equivalent yield is 7.50% and thus the change is +116bp.

ZPR, is an ETF comprised of FixedResets and Floating Rate issues and a very high proportion of junk issues, returned XXX%, XXX% and XXX% over the past one-, three- and twelve-month periods, respectively (according to the fund’s data), versus returns for the TXPL index of +0.70%, +0.08% and -3.25% respectively. The fund has been able to attract assets of about $983.6-million since inception in November 2012; AUM increased by $29.0-million in March, of which only about $9.5-million is due to internal growth, indicating that money is still flowing into the fund. I feel that the flows into and out of this fund are very important in determining the performance of its constituents.

TXPR had returns over one- and three-months of +0.89% and +2.70%, respectively with CPD performance within expectations.

Returns for the HIMIPref™ investment grade sub-indices for February were as follows:

HIMIPref™ Indices
Performance to March 31, 2013
Sub-Index 1-Month 3-month
Ratchet N/A N/A
FixFloat +0.50% -1.33%
Floater +0.56% -3.53%
OpRet -0.21% +1.03%
SplitShare +1.20% +2.12%
Interest N/A N/A
PerpetualPremium +1.03% +2.39%
PerpetualDiscount +1.94% +5.01%
FixedReset +0.41% +1.80%
DeemedRetractible +0.98% +3.18%
FloatingReset +0.59% -0.58%

Malachite Aggressive Preferred Fund’s Net Asset Value per Unit as of the close March 31, 2014, was $10.2233 after a distribution of 0.135694.

Returns to March 31, 2014
Period MAPF BMO-CM “50” Index TXPR
Total Return
CPD – according to Blackrock
One Month +1.49% +0.61% +0.89% +0.83%
Three Months +4.94% +1.98% +2.70% +2.54%
One Year -1.24% -1.06% -2.33% -2.73%
Two Years (annualized) +4.32% +2.42% +2.09% N/A
Three Years (annualized) +3.58% +3.58% +2.90% +2.38%
Four Years (annualized) +8.12% +5.89% +4.96% N/A
Five Years (annualized) +14.77% +9.70% +8.20% +7.54%
Six Years (annualized) +13.55% +5.37% +4.17%  
Seven Years (annualized) +11.26% +3.49%    
Eight Years (annualized) +10.52% +3.59%    
Nine Years (annualized) +10.21% +3.77%    
Ten Years (annualized) +9.78% +3.59%    
Eleven Years (annualized) +12.25% +4.24%    
Twelve Years (annualized) +10.84% +4.24%    
Thirteen Years (annualized) +11.23% +4.01%    
MAPF returns assume reinvestment of distributions, and are shown after expenses but before fees.
CPD Returns are for the NAV and are after all fees and expenses.
* CPD does not directly report its two- or four-year returns.
Figures for Omega Preferred Equity (which are after all fees and expenses) for 1-, 3- and 12-months are +0.81%, +2.38% and -0.27%, respectively, according to Morningstar after all fees & expenses. Three year performance is +3.31%; five year is +8.77%
Figures for Jov Leon Frazer Preferred Equity Fund Class I Units (which are after all fees and expenses) for 1-, 3- and 12-months are +0.31%, +1.42% and -3.04% respectively, according to Morningstar. Three Year performance is +1.01%; five-year is +5.93%
Figures for Manulife Preferred Income Fund (formerly AIC Preferred Income Fund) (which are after all fees and expenses) for 1-, 3- and 12-months are +0.65%, +2.11% & -7.74%, respectively. Three Year performance is +0.92%
Figures for Horizons AlphaPro Preferred Share ETF (which are after all fees and expenses) for 1-, 3- and 12-months are +0.82%, +2.25% & -0.44%, respectively. Three year performance is +3.81%
Figures for Altamira Preferred Equity Fund are +0.78%, +2.27% and -3.59% for one-, three- and twelve months, respectively.
The figure for BMO S&P/TSX Laddered Preferred Share Index ETF is +0.94%, +2.54% and -4.10% for one-, three- and twelve-months, respectively.
Figures for NexGen Canadian Preferred Share Tax Managed Fund are not available since our wise regulators are protecting you from inappropriate knowledge.
Figures for BMO Preferred Share Fund are similarly off-limits.

MAPF returns assume reinvestment of dividends, and are shown after expenses but before fees. Past performance is not a guarantee of future performance. You can lose money investing in Malachite Aggressive Preferred Fund or any other fund. For more information, see the fund’s main page. The fund is available either directly from Hymas Investment Management or through a brokerage account at Odlum Brown Limited.

A problem that has bedevilled the market over the past two years has been the OSFI decision not to grandfather Straight Perpetuals as Tier 1 bank capital, and their continued foot-dragging regarding a decision on insurer Straight Perpetuals has segmented the market to the point where trading has become much more difficult. The fund occasionally finds an attractive opportunity to trade between GWO issues, which have a good range of annual coupons (but in which trading is now hampered by the fact that the low-coupon issues are trading near par and are callable at par in the near term), but is “stuck” in the MFC and SLF issues, which have a much narrower range of coupon, while the IAG DeemedRetractibles are quite illiquid. Until the market became so grossly segmented, this was not so much of a problem – but now banks are not available to swap into (because they are so expensive) and non-regulated companies are likewise deprecated (because they are not DeemedRetractibles; they should not participate in the increase in value that will follow the OSFI decision I anticipate and, in addition, are analyzed as perpetuals). The fund’s portfolio is, in effect ‘locked in’ to the MFC & SLF issues due to projected gains from a future OSFI decision, to the detriment of trading gains particularly in May, 2013, when the three lowest-coupon SLF DeemedRetractibles (SLF.PR.C, SLF.PR.D and SLF.PR.E) were the worst performing DeemedRetractibles in the sub-index, and in June, 2013, when the insurance-issued DeemedRetractibles behaved like PerpetualDiscounts in a sharply negative market.

In March, insurance DeemedRetractibles outperformed bank DeemedRetractibles:

insBanksPerf_140331
Click for Big

… and Straight Perpetuals:

insStraightPerf_140331
Click for Big

A lingering effect of the downdraft of 2013 has been the return of measurable Implied Volatility (all Implied Volatility calculations use bids from March 7):

ImpVol_GWO_140407
Click for Big

ImpVol_PWF_140407
Click for Big

ImpVol_BNS_140407
Click for Big

Implied Volatility of
Three Series of Straight Perpetuals
April 7, 2014
Issuer Pure Yield Implied Volatility
GWO 4.76% (+0.21) 17% (-5)
PWF 4.20% (-0.05) 24% (-1)
BNS 0.01% (0) 40% (0)
Bracketted figures are changes since February month-end

There is little discernible difference between GWO and PWF, as shown when we show the GWO data with the best fit derived for PWF

ImpVol_GWO_140407_PWFFit
Click for Big

In the September, 2013, edition of PrefLetter, I extended the theory of Implied Volatility to FixedResets – relating the option feature of the Issue Reset Spreads to a theoretical non-callable Market Spread.

ImpVol_BPO_140407
Click for Big

ImpVol_FFH_140407
Click for Big

Implied Volatility of
Two Series of FixedResets
February 28, 2014
Issuer Market Reset Spread
(Non-Callable)
Implied Volatility
BPO 74bp (-11) 40% (0)
FFH 320bp (-18) 9% (+9)
Bracketted figures are changes since February month-end

These are very interesting results: The BPO issues are trading as if calls are a certainty, while FFH issues are trading as if calls are not at all likely.

Those of you who have been paying attention will remember that in a “normal” market (which we have not seen in well over a year) the slope of this line is related to the implied volatility of yields in Black-Scholes theory, as discussed in the January, 2010, edition of PrefLetter. As has been previously noted, very high levels of Implied Volatility (in the 40% range, at which point the calculation may be considered virtually meaningless) imply a very strong expectation of directionality in future prices – i.e, an expectation that all issues will be redeemed at par.

It is significant that the preferred share market knows no moderation. I suggest that a good baseline estimate for Volatility over a three year period is 15% but the observed figure is generally higher in a rising market and lower in a declining one … with, of course, a period of adjustment in between, which I suspect we are currently experiencing.

Sometimes everything works … sometimes it’s 50-50 … sometimes nothing works. The fund seeks to earn incremental return by selling liquidity (that is, taking the other side of trades that other market participants are strongly motivated to execute), which can also be referred to as ‘trading noise’ – although for quite some time, noise trading has taken a distant second place to the sectoral play on insurance DeemedRetractibles; something that dismays me, particularly given that the market does not yet agree with me regarding the insurance issues! There were a lot of strongly motivated market participants during the Panic of 2007, generating a lot of noise! Unfortunately, the conditions of the Panic may never be repeated in my lifetime … but the fund will simply attempt to make trades when swaps seem profitable, without worrying about the level of monthly turnover.

There’s plenty of room for new money left in the fund. I have shown in PrefLetter that market pricing for FixedResets is very often irrational and I have lots of confidence – backed up by my bond portfolio management experience in the markets for Canadas and Treasuries, and equity trading on the NYSE & TSX – that there is enough demand for liquidity in any market to make the effort of providing it worthwhile (although the definition of “worthwhile” in terms of basis points of outperformance changes considerably from market to market!) I will continue to exert utmost efforts to outperform but it should be borne in mind that there will almost inevitably be periods of underperformance in the future.

The yields available on high quality preferred shares remain elevated, which is reflected in the current estimate of sustainable income.

Calculation of MAPF Sustainable Income Per Unit
Month NAVPU Portfolio
Average
YTW
Leverage
Divisor
Securities
Average
YTW
Capital
Gains
Multiplier
Sustainable
Income
per
current
Unit
June, 2007 9.3114 5.16% 1.03 5.01% 1.3240 0.3524
September 9.1489 5.35% 0.98 5.46% 1.3240 0.3773
December, 2007 9.0070 5.53% 0.942 5.87% 1.3240 0.3993
March, 2008 8.8512 6.17% 1.047 5.89% 1.3240 0.3938
June 8.3419 6.034% 0.952 6.338% 1.3240 $0.3993
September 8.1886 7.108% 0.969 7.335% 1.3240 $0.4537
December, 2008 8.0464 9.24% 1.008 9.166% 1.3240 $0.5571
March 2009 $8.8317 8.60% 0.995 8.802% 1.3240 $0.5872
June 10.9846 7.05% 0.999 7.057% 1.3240 $0.5855
September 12.3462 6.03% 0.998 6.042% 1.3240 $0.5634
December 2009 10.5662 5.74% 0.981 5.851% 1.1141 $0.5549
March 2010 10.2497 6.03% 0.992 6.079% 1.1141 $0.5593
June 10.5770 5.96% 0.996 5.984% 1.1141 $0.5681
September 11.3901 5.43% 0.980 5.540% 1.1141 $0.5664
December 2010 10.7659 5.37% 0.993 5.408% 1.0298 $0.5654
March, 2011 11.0560 6.00% 0.994 5.964% 1.0298 $0.6403
June 11.1194 5.87% 1.018 5.976% 1.0298 $0.6453
September 10.2709 6.10%
Note
1.001 6.106% 1.0298 $0.6090
December, 2011 10.0793 5.63%
Note
1.031 5.805% 1.0000 $0.5851
March, 2012 10.3944 5.13%
Note
0.996 5.109% 1.0000 $0.5310
June 10.2151 5.32%
Note
1.012 5.384% 1.0000 $0.5500
September 10.6703 4.61%
Note
0.997 4.624% 1.0000 $0.4934
December, 2012 10.8307 4.24% 0.989 4.287% 1.0000 $0.4643
March, 2013 10.9033 3.87% 0.996 3.886% 1.0000 $0.4237
June 10.3261 4.81% 0.998 4.80% 1.0000 $0.4957
September 10.0296 5.62% 0.996 5.643% 1.0000 $0.5660
December, 2013 9.8717 6.02% 1.008 5.972% 1.0000 $0.5895
March, 2014 10.2233 5.55% 0.998 5.561% 1.0000 $0.5685
NAVPU is shown after quarterly distributions of dividend income and annual distribution of capital gains.
Portfolio YTW includes cash (or margin borrowing), with an assumed interest rate of 0.00%
The Leverage Divisor indicates the level of cash in the account: if the portfolio is 1% in cash, the Leverage Divisor will be 0.99
Securities YTW divides “Portfolio YTW” by the “Leverage Divisor” to show the average YTW on the securities held; this assumes that the cash is invested in (or raised from) all securities held, in proportion to their holdings.
The Capital Gains Multiplier adjusts for the effects of Capital Gains Dividends. On 2009-12-31, there was a capital gains distribution of $1.989262 which is assumed for this purpose to have been reinvested at the final price of $10.5662. Thus, a holder of one unit pre-distribution would have held 1.1883 units post-distribution; the CG Multiplier reflects this to make the time-series comparable. Note that Dividend Distributions are not assumed to be reinvested.
Sustainable Income is the resultant estimate of the fund’s dividend income per current unit, before fees and expenses. Note that a “current unit” includes reinvestment of prior capital gains; a unitholder would have had the calculated sustainable income with only, say, 0.9 units in the past which, with reinvestment of capital gains, would become 1.0 current units.
DeemedRetractibles are comprised of all Straight Perpetuals (both PerpetualDiscount and PerpetualPremium) issued by BMO, BNS, CM, ELF, GWO, HSB, IAG, MFC, NA, RY, SLF and TD, which are not exchangable into common at the option of the company (definition refined in May, 2011). These issues are analyzed as if their prospectuses included a requirement to redeem at par on or prior to 2022-1-31 (banks) or 2025-1-31 (insurers and insurance holding companies), in addition to the call schedule explicitly defined. See OSFI Does Not Grandfather Extant Tier 1 Capital, CM.PR.D, CM.PR.E, CM.PR.G: Seeking NVCC Status and the January, February, March and June, 2011, editions of PrefLetter for the rationale behind this analysis.
Yields for September, 2011, to January, 2012, were calculated by imposing a cap of 10% on the yields of YLO issues held, in order to avoid their extremely high calculated yields distorting the calculation and to reflect the uncertainty in the marketplace that these yields will be realized. From February to September 2012, yields on these issues have been set to zero. All YLO issues held were sold in October 2012.

Significant positions were held in DeemedRetractible, SplitShare and FixedReset issues on February 28; all of these currently have their yields calculated with the presumption that they will be called by the issuers at par prior to 2022-1-31 (banks) or 2025-1-31 (insurers and insurance holding companies) or on a different date (SplitShares). This presents another complication in the calculation of sustainable yield. The fund also holds positions in various SplitShare issues which also have their yields calculated with the expectation of a maturity at par.

I no longer show calculations that assume the conversion of the entire portfolio into PerpetualDiscounts, as the fund has only a small position in these issues.

I will also note that the sustainable yield calculated above is not directly comparable with any yield calculation currently reported by any other preferred share fund as far as I am aware. The Sustainable Yield depends on:
i) Calculating Yield-to-Worst for each instrument and using this yield for reporting purposes;
ii) Using the contemporary value of Five-Year Canadas (set at 1.62% for the February 28 calculation) to estimate dividends after reset for FixedResets.

Most funds report Current Yield. For instance, ZPR reports a “Portfolio Yield” of 4.81% as of March 31, 2014 and notes:

Portfolio yield is calculated as the most recent income received by the ETF in the form of dividends interest and other income annualized based on the payment frequently divided by the current market value of ETFs investments.

In other words – it’s the Current Yield, a meaningless number. The Current Yield of MAPF is 5.07% as of March 31, but I will neither report that with any degree of prominence nor take any great pleasure in the fact that it’s a little higher than the ZPR number. It’s meaningless; to accord it any prominence in portfolio reporting is misleading.

It should be noted that the concept of this Sustainable Income calculation was developed when the fund’s holdings were overwhelmingly PerpetualDiscounts – see, for instance, the bottom of the market in November 2008. It is easy to understand that for a PerpetualDiscount, the technique of multiplying yield by price will indeed result in the coupon – a PerpetualDiscount paying $1 annually will show a Sustainable Income of $1, regardless of whether the price is $24 or $17.

Things are not quite so neat when maturity dates and maturity prices that are different from the current price are thrown into the mix. If we take a notional Straight Perpetual paying $5 annually, the price is $100 when the yield is 5% (all this ignores option effects). As the yield increases to 6%, the price declines to 83.33; and 83.33 x 6% is the same $5. Good enough.

But a ten year bond, priced at 100 when the yield is equal to its coupon of 5%, will decline in price to 92.56; and 92.56 x 6% is 5.55; thus, the calculated Sustainable Income has increased as the price has declined as shown in the graph:


Click for Big

The difference is because the bond’s yield calculation includes the amortization of the discount; therefore, so does the Sustainable Income estimate.

Different assumptions lead to different results from the calculation, but the overall positive trend is apparent. I’m very pleased with the long-term results! It will be noted that if there was no trading in the portfolio, one would expect the sustainable yield to be constant (before fees and expenses). The success of the fund’s trading is showing up in

  • the very good performance against the index
  • the long term increases in sustainable income per unit

As has been noted, the fund has maintained a credit quality equal to or better than the index; outperformance has generally been due to exploitation of trading anomalies.

Again, there are no predictions for the future! The fund will continue to trade between issues in an attempt to exploit market gaps in liquidity, in an effort to outperform the index and keep the sustainable income per unit – however calculated! – growing.

April 7, 2014

Monday, April 7th, 2014

There are some interesting statistics from electronic bond trading:

Traders trying to purchase investment-grade notes are failing about 46 percent of the time, close to the worst rate in more than four years as measured by activity on MarketAxess Holdings Inc.’s electronic platform. On the flip side, investors trying to sell the debt are having the easiest time on record, with an 85 percent success rate.

Bond buyers are showing an unwillingness to part with their holdings as a rally fueled by more than five years of unprecedented Federal Reserve stimulus refuses to die. Ironically, it’s harder than ever to find securities for sale even though the U.S. corporate-debt market has grown 53 percent since 2008, with companies selling $6.9 trillion of notes since then, according to data compiled by the Securities Industry and Financial Markets Association and Bloomberg.

“Right now, everyone’s a buyer,” said Edward Meigs, who manages $1.6 billion of debt assets at First Eagle Investment Management in Baltimore. “There’s a marked level of complacency.”

Traders will submit offers to buy or sell bonds on MarketAxess’s platform within a set period of time. The transaction is considered to fail when time runs out with no takers. New York-based MarketAxess is the most-active electronic venue for trading corporate bonds in the U.S.

And given the difficulty in buying bonds, guess what’s making a comeback?:

Commercial real-estate investor H/2 Capital Partners bundled a hodge podge of its holdings — from bonds tied to skyscrapers and malls to junk-rated bank loans — into about $400 million of securities. The deal, similar to the pre-crisis transactions known as collateralized debt obligations, included one portion that Moody’s Investors Service gave its highest rating of Aaa.

The investment firm is seizing on a revival of the types of transactions that fueled the property boom in 2006 and 2007, showing the lengths to which investors are going to bolster skimpy yields across credit markets. Such offerings are giving commercial-property investors a wider range of options to fund acquisitions, according to Richard Hill, a debt analyst at Morgan Stanley.

The war on markets continues:

U.S. Attorney General Eric Holder promised Congress a thorough investigation into whether high-frequency trading violates laws against insider trading.

Holder said he is responding to concerns being raised about whether the practice creates an uneven playing field for investors.

“The department is committed to ensuring the integrity of our financial markets, and we are determined to follow this investigation wherever the facts and the law may lead,” Holder said in testimony today at a hearing of the House Appropriations subcommittee that oversees the Justice Department.

With respect to my remarks about High Frequency Trading on April 3, Assiduous Reader PL writes in and says:

OK, I see your point. James you are like PT Barnum. But for you there is a sucker born every millisecond.

This is not strictly true. My objection to rules about spoofing and layering and all the other little tactical games that speculators play is twofold:

  • They seek to protect speculators from the consequences of their own actions, and
  • They are completely arbitrary

With respect to the first point – anybody who buys a stock at 20.55 simply because there’s a big bid at 20.50 is taking his chances. He is speculating and he knows he’s speculating. As a matter of public policy, there is no reason to worry over-much about the consequences that might befall speculators; speculators are of interest solely because they provide liquidity to real money players.

That big bid at 20.50 is valuable to real-money players seeking to sell – putting in a spoof order is a dangerous game and can easily blow up in the face of Mr. Clever if somebody else has a well timed pounce algorithm or otherwise hits that bid. Mr. Clever – whose actual goal is to sell a few shares at 20.55 – is now behind the eight-ball and has to sell more shares in order to break even. Mr. Clever has actually supplied liquidity to the market, which is exactly what speculators are supposed to do (although he might have to take some liquidity as he squares his books).

There will doubtless be a lot of whimpering about Granny and her purchase of 500 shares. I don’t really care much about Granny and her 500 shares, either. A stock exchange is life in the raw. If Granny wants professional management of her portfolio, she should hire a professional – last time I checked, there were still lots of them around. We do not insist that hospitals provide facilities and diagrams for amateur brain surgeons; why should we insist that stock exchanges provide a straight-forward and predictable environment for amateur stock traders? Granny’s best bet is an ETF, mutual fund or other arrangement to hire a professional to handle her investment needs.

The concern for Granny is all crocodile tears. It comes from incompetent institutional traders who simply aren’t very good at trading; who find themselves in a horrifying world where anybody – just anybody! – with a bit of capital and computer skills can eat their lunch. The controversy regarding HFT is fuelled by monopolists who are watching their monopoly erode and aren’t very happy about it.

The other point is regarding the arbitrary nature of the anti-spoofing, et cetera, rules and I will introduce that point by quoting again from the SEC press release I quoted on April 4:

“The fair and efficient functioning of the markets requires that prices of securities reflect genuine supply and demand,” said Sanjay Wadhwa, senior associate director of the SEC’s New York Regional Office. “Traders who pervert these natural forces by engaging in layering or some other form of manipulative trading invite close scrutiny from the SEC.”

This is total bullshit and reveals that Sanjay Wadhwa doesn’t have a clue about trading strategies (he’s only a lawyer-accountant – I see no evidence that he’s ever traded a single thing in his life. He is “nurturing” though, and golly, isn’t “nurturing” better than “competent” and “knowledgeable” nowadays?).

Genuine supply and demand? Spoofing works – when it does work! – because when there’s a big order on one side of the market, many speculators will back away from it, reasoning that whoever put that order in will end up moving the market (with more confidence, you can then take the orders that didn’t back away. It was exploitation of this behaviour that got Dondero into trouble – see April 4). So, for instance, if trader M. T. Head of Bozo Corp has an order to sell 10,000 shares of XYZ, the market may well evolve as follows:

  • Market before Order: 21.50-60, 10×10
  • Market immediately after order: 21.50-59, 10×100
  • Market shortly after order: 21.40-59, 10×100

So after this happens a few times, Mr. Head wises up a little, and only puts in an order to sell 1,000 shares intending to feed the rest of his 10,000 shares into the market as he gets filled; so the market evolves like this:

  • Market before Order: 21.50-60, 10×10
  • Market immediately after order: 21.50-59, 10×10
  • Market shortly after order: 21.50-59, 10×10

This has a couple of overall effects – spreads have narrowed (from a dime to nine cents) and execution sizes are reduced (since the 10,000 shares will be sold in pieces). In fact, this is exactly what we have seen in the market over the last twenty years.

But, to the chagrin of Sanjay Wadhwa of the SEC, the market prices no longer reflect genuine supply and demand! Oh, the horror! There is true supply of 10,000 shares, but only 1,000 shares are being advertised! Quick, to the lamp-posts! String up the social misfit of a trader who is keeping 9,000 shares secret! He is perverting the natural forces that Sanjay Wadhwa is sworn to defend!

The situation gets even more ridiculous when we remember that iceberg orders are institutionalized and available on many exchanges: M. T. Head could well have put in an iceberg order, giving the exchange an order for 10,000 shares with instructions to show only 1,000 shares at a time … and now it is the exchange that is perverting the natural forces of supply and demand. For some odd reason, Sanjay Wadhwa doesn’t seem particularly offended by this.

He does, however, have hysterics if M. T. Head takes another step to execute his client’s order at a good price, and puts in a spoof buy for 2,000 shares at 20.51, making the complete evolution of the market like this:

  • Market before Order: 21.50-60, 10×10
  • Market immediately after order: 21.50-59, 10×10
  • Market shortly after order: 21.50-59, 10×10
  • Market after spoof: 21.51-59, 20×10 ILLEGAL, ILLEGAL ILLEGAL!!! Call the gendarmes!

Mr. Head, as mentioned, is taking a bit of chance here, because his bid for 2,000 at 21.51 could get hit, and if it is he’s got 12,000 shares to sell instead of 10,000. But that’s his problem. But maybe it will work; somebody will see the big bid at 21.51 and consider this to be a good reason to buy 1,000 at 21.59; it’s the same principle as backing off on your orders when you see a big order on the other side. If M. T. Head’s good enough at the game his winnings will exceed his losses, he’ll get more clients and take home more money, which is exactly how the system should be working. In the mean-time, we observe that the spoof order increased market depth and decreased market spread. Why is this wrong? Regrettably, as discussed on April 4, this is exactly what got Joseph Dondero into trouble.

However, a good argument can be made that allowing spoofing will actually improve the market for naïve real money. As noted above, speculative bidders will drop their bids in the face of a large offer, believing that it is a naïve seller who will eventually execute at any price he can get (and vice versa for naïve buyers, of course). Along comes Granny, with her market order to sell 100 shares and hits one of those reduced bids and gets less money than she would have had there not been a large seller in the market at that time. If, however, spoofing is allowed, then there will be less certainty regarding the future course of prices, which should result in the speculative bidders not dropping their prices so much – or perhaps not dropping them at all. So the bid-offer spread is not so adversely impacted and Granny gets a better price. Isn’t that good? There’s no evidence that I know of that this will actually be the case; but there is no evidence I know of that it doesn’t, either; it would be interesting to see a few controlled experiments, but the SEC is more interested in grandstanding.

Another example of supply-and-demand uncertainty is a case where I have a client who has 10,000 shares of XYZ and 10,000 shares of ABC, both of which are trading around $20, which – as far as I can tell – is fair value. My client asks me to raise $20,000 because he wants to buy a car. So, wishing to do the best for my client, I put in two orders:

  • Sell 1,000 XYZ at 20.10, and
  • Sell 1,000 ABC at 20.10

Two orders! I’m trying to do the best for my client and get him the best price possible … if I get can sell 1,000 shares at 20.10, he’ll have $100 more than if he sold them at $20.00 … maybe $100 isn’t all that much, but given the choice between $100 in my client’s pocket and $100 in somebody else’s client’s pocket, I know what I like best – and it’s my job to get best execution for my client.

I’m taking a bit of a chance: maybe both offers will get lifted, I’ll have raised too much money, and I’ll have to reinvest the excess, possibly taking a loss on that part of the transaction. Well – that’s my problem. It’s my job to take calculated risks on behalf of my clients – isn’t that what investment is all about? – and in my judgement, for this package of transactions, given market conditions and my evaluation of fair value, this is a calculated risk worth taking.

“But”, shrieks Sanjay Wadhwa, spittle dribbling from his chin, “what about the Holy Supply and Demand? You are putting offers for 2,000 shares on the market when you really only wanting to supply 1,000 shares! Evil, evil, evil! To the lamp-posts!”

So I have to explain that there’s nothing actually illegal about my actions; they happen to be on the right side of an idiotic arbitrary line.

So the result of these precious little anti-spoofing rules are:

  • increased spreads
  • decreased depth
  • lots of arbitrary rules for traders to remember
  • lots of employment for lawyers, accountants, lawyer-accountants and other box-tickers to enforce these rules
  • the occasional ‘Gotcha!’ when the authorities find a technical violation and decide to enforce these rules

You don’t believe in ‘Gotcha!’? Ask David Berry about ‘Gotcha!’. He only got off because (i) He had enough money to fight the case, and (ii) There was enough at stake to make it worthwhile fighting the case. Ask Fabulous Fab about ‘Gotcha!’.

It’s a pretty screwy system, if you ask me.

Rob Carrick of the Globe wrote an article recently titled Real estate or stocks – which will make you richer?, concluding that as an investment, stocks are better, based in part on the following figures:

Canadian Real-Estate
vs.
Canadian Equities
Period Ending
2013-12-31
S&P/TSX Composite Total Return Index National Average Resale Housing Price
10 Years 7.97% 5.4%
20 Years 8.28% 4.5%
30 Years 8.52% 5.5%

He also notes that:

Property taxes, furnishings, maintenance, improvements, insurance and mortgage interest all have to be factored into calculations of how much money is being made on housing.

There’s also a cost to investing, of course. But it’s much more contained and predictable than a house, where costly repairs could be needed at any time. A do-it-yourself investor might pay 0.5 per cent of the value of her account assets in fees and commissions per year, while an investor with an adviser might pay 1 to 1.5 per cent. Even if you lower stock market returns by this amount, you still get a better result than housing.

He neglected to factor in taxes, but this was addressed in the comments. I’ll also point out that national average housing price figures are suspect due to quality improvements.

In the end, I take the view that a house is not an investment. It’s a place to live. All in, if owning makes sense for you – i.e, you can afford it, you have enough stability in your life that you can settle down, that sort of thing – you should own. Then you can paint when you feel like painting. In the long run, house prices aren’t going to appreciate more than people’s salaries improve, although one might get fancy and specify that the price of a house in your price bracket will appreciate according to the improvement in salaries of the people who can afford to buy it, which is a much different thing what with income inequality and all. I have a friend who bought an entry level condo ten years ago, visions of immense riches dancing in her eyes … she’s now sold it in disgust, as it has appreciated in price by about as much as the improvement in salaries of people who buy entry level condos, which ain’t much.

The big value to a house, as far as I can tell, is that the mortgage represents forced saving. Every month you pay $1,500 on your mortgage, $1,000 of that is reducing principal and represents saving; by the time you’ve done this for 25 years, you have something worth having, especially since you’ve kept pace with inflation – however defined – on the entire value. Mind you, that might be an old-fashioned thought, nowadays, what with people taking out lines of credit … it’s even easier than selling part of your portfolio when you need some cash for something important.

DBRS confirmed BCE at Pfd-3(high):

It should be noted that BCE’s ratings are based primarily on the ratings of Bell Canada and reflect the structural subordination of debt (currently none outstanding) and its preferred share obligations relative to Bell Canada.

In terms of financial profile, DBRS expects Bell Canada’s leverage to be appropriate for the current rating category by mid-2015, following modest debt reduction and low-single-digit growth in EBITDA. DBRS expects Bell Canada to use the majority of its free cash flow and ~$700 million of proceeds from the Astral divestitures toward spectrum auction purchases and debt reduction. As such, DBRS forecasts Bell Canada’s gross debt-to-EBITDA will stand at approximately 2.1x at the end of 2014. DBRS continues to expect the Company to reduce its gross debt-to-EBITDA ratio to below 2.0x by mid-2015. DBRS notes that failure by Bell Canada to deleverage as expected could result in a negative rating action.

It was a positive day for the Canadian preferred share market, with PerpetualDiscounts up 8bp, FixedResets winning 11bp and DeemedRetractibles gaining 5bp. Volatility was modest. Volume was low.

HIMIPref™ Preferred Indices
These values reflect the December 2008 revision of the HIMIPref™ Indices

Values are provisional and are finalized monthly
Index Mean
Current
Yield
(at bid)
Median
YTW
Median
Average
Trading
Value
Median
Mod Dur
(YTW)
Issues Day’s Perf. Index Value
Ratchet 0.00 % 0.00 % 0 0.00 0 0.0000 % 2,477.0
FixedFloater 4.67 % 3.96 % 36,409 17.47 1 0.5435 % 3,635.3
Floater 2.94 % 3.06 % 50,058 19.61 4 0.0000 % 2,674.5
OpRet 4.37 % -3.60 % 32,841 0.15 2 -0.0387 % 2,690.0
SplitShare 4.81 % 4.35 % 63,904 4.26 5 0.0636 % 3,088.1
Interest-Bearing 0.00 % 0.00 % 0 0.00 0 -0.0387 % 2,459.8
Perpetual-Premium 5.56 % -3.08 % 102,359 0.09 13 0.1989 % 2,381.4
Perpetual-Discount 5.45 % 5.44 % 122,165 14.66 23 0.0788 % 2,472.9
FixedReset 4.69 % 3.64 % 204,925 4.21 79 0.1084 % 2,526.2
Deemed-Retractible 5.04 % 1.45 % 149,191 0.14 42 0.0471 % 2,482.7
FloatingReset 2.64 % 2.45 % 185,058 4.29 5 0.1601 % 2,467.9
Performance Highlights
Issue Index Change Notes
GWO.PR.N FixedReset -1.02 % YTW SCENARIO
Maturity Type : Hard Maturity
Maturity Date : 2025-01-31
Maturity Price : 25.00
Evaluated at bid price : 22.37
Bid-YTW : 4.39 %
PWF.PR.T FixedReset 1.05 % YTW SCENARIO
Maturity Type : Call
Maturity Date : 2019-01-31
Maturity Price : 25.00
Evaluated at bid price : 25.94
Bid-YTW : 3.31 %
VNR.PR.A FixedReset 1.07 % YTW SCENARIO
Maturity Type : Call
Maturity Date : 2017-10-15
Maturity Price : 25.00
Evaluated at bid price : 25.36
Bid-YTW : 3.90 %
Volume Highlights
Issue Index Shares
Traded
Notes
TRP.PR.A FixedReset 63,140 Nesbitt crossed 49,100 at 23.53.
YTW SCENARIO
Maturity Type : Limit Maturity
Maturity Date : 2044-04-07
Maturity Price : 22.72
Evaluated at bid price : 23.35
Bid-YTW : 3.91 %
ENB.PR.N FixedReset 57,925 TD crossed 50,000 at 24.95.
YTW SCENARIO
Maturity Type : Call
Maturity Date : 2018-12-01
Maturity Price : 25.00
Evaluated at bid price : 24.93
Bid-YTW : 4.18 %
TD.PR.P Deemed-Retractible 56,520 RBC crossed 49,900 at 26.11.
YTW SCENARIO
Maturity Type : Call
Maturity Date : 2014-05-07
Maturity Price : 25.75
Evaluated at bid price : 26.03
Bid-YTW : -11.63 %
TRP.PR.B FixedReset 53,890 Nesbitt crossed 50,000 at 20.27.
YTW SCENARIO
Maturity Type : Limit Maturity
Maturity Date : 2044-04-07
Maturity Price : 20.30
Evaluated at bid price : 20.30
Bid-YTW : 3.80 %
MFC.PR.K FixedReset 52,900 Nesbitt crossed 50,000 at 24.88.
YTW SCENARIO
Maturity Type : Call
Maturity Date : 2018-09-19
Maturity Price : 25.00
Evaluated at bid price : 24.90
Bid-YTW : 3.96 %
ENB.PR.D FixedReset 46,800 TD crossed 40,000 at 24.34.
YTW SCENARIO
Maturity Type : Limit Maturity
Maturity Date : 2044-04-07
Maturity Price : 23.00
Evaluated at bid price : 24.32
Bid-YTW : 4.15 %
There were 20 other index-included issues trading in excess of 10,000 shares.
Wide Spread Highlights
Issue Index Quote Data and Yield Notes
TD.PR.I FixedReset Quote: 25.28 – 25.72
Spot Rate : 0.4400
Average : 0.2585

YTW SCENARIO
Maturity Type : Call
Maturity Date : 2014-07-31
Maturity Price : 25.00
Evaluated at bid price : 25.28
Bid-YTW : 1.44 %

ELF.PR.H Perpetual-Discount Quote: 24.45 – 24.81
Spot Rate : 0.3600
Average : 0.2167

YTW SCENARIO
Maturity Type : Limit Maturity
Maturity Date : 2044-04-07
Maturity Price : 24.04
Evaluated at bid price : 24.45
Bid-YTW : 5.63 %

GWO.PR.Q Deemed-Retractible Quote: 24.08 – 24.38
Spot Rate : 0.3000
Average : 0.1870

YTW SCENARIO
Maturity Type : Hard Maturity
Maturity Date : 2025-01-31
Maturity Price : 25.00
Evaluated at bid price : 24.08
Bid-YTW : 5.65 %

CM.PR.E Perpetual-Premium Quote: 25.35 – 25.60
Spot Rate : 0.2500
Average : 0.1527

YTW SCENARIO
Maturity Type : Call
Maturity Date : 2014-05-07
Maturity Price : 25.00
Evaluated at bid price : 25.35
Bid-YTW : -15.03 %

GWO.PR.N FixedReset Quote: 22.37 – 22.64
Spot Rate : 0.2700
Average : 0.1759

YTW SCENARIO
Maturity Type : Hard Maturity
Maturity Date : 2025-01-31
Maturity Price : 25.00
Evaluated at bid price : 22.37
Bid-YTW : 4.39 %

IAG.PR.F Deemed-Retractible Quote: 25.92 – 26.19
Spot Rate : 0.2700
Average : 0.1957

YTW SCENARIO
Maturity Type : Call
Maturity Date : 2018-03-31
Maturity Price : 25.25
Evaluated at bid price : 25.92
Bid-YTW : 5.16 %

MAPF Portfolio Composition: March 2014

Monday, April 7th, 2014

Turnover increased in March, to about 7.5%, largely due to the fund’s taking advantage of weakness in low-spread FixedResets.

There is extreme segmentation in the marketplace, with OSFI’s NVCC rule changes in February 2011 having had the effect of splitting the formerly relatively homogeneous Straight Perpetual class of preferreds into three parts:

  • Unaffected Straight Perpetuals
  • DeemedRetractibles explicitly subject to the rules (banks)
  • DeemedRetractibles considered by me, but not (yet!) by the market, to be likely to be explicitly subject to the rules in the future (insurers and insurance holding companies)

This segmentation, and the extreme valuation differences between the segments, has cut down markedly on the opportunities for trading. Another trend that hasn’t helped was the migration of PerpetualDiscounts into PerpetualPremiums (due to price increases) in early 2013 – many of the PerpetualPremiums had negative Yields-to-Worst and those that don’t aren’t particularly thrilling; speaking very generally, PerpetualPremiums are to be avoided, not traded! This effect has caused the first of the three segments noted above to be untradeable for most practical purposes. Last summer’s downdraft reversed the trend and resulted in a large pool of PerpetualDiscounts, but due to their long term they are still, as a class, inferior to DeemedRetractibles.

To make this more clear, it used to be that there were 70-odd Straight Perpetuals and I was more or less indifferent as to which ones I owned (subject, of course, to issuer concentration concerns and other risk management factors). Thus, if any one of these 70 were to go down in price by – say – $0.25, I would quite often have something in inventory that I’d be willing to swap for it. The segmentation means that I am no longer indifferent; in addition to checking the valuation of a potential buy to other Straights, I also have to check its peer group. This cuts down on the potential for trading.

There is no real hope that this situation will be corrected in the near-term. OSFI has indicated that the long-promised “Draft Definition of Capital” for insurers will not be issued “for public consultation in late 2012 or early 2013”, as they fear that it might encourage speculation in the marketplace. It is not clear why OSFI is so afraid of informed speculation, since the constant speculation in the marketplace is currently less informed than it would be with a little bit of regulatory clarity.

As a result of this delay, I have extended the Deemed Maturity date for insurers and insurance holding companies by three years (to 2025-1-31), in the expectation that when OSFI finally does provide clarity, they will allow the same degree of lead-in time for these companies as they did for banks. This had a major effect on the durations of preferred shares subject to the change but, fortunately, not much on their calculated yields as most of these issues were either trading near par when the change was made or were trading at sufficient premium that a par call was expected on economic grounds. However, with the declines in the market over the past nine months, the expected capital gain on redemption of the insurance-issued DeemedRetractibles has become an important component of the calculated yield.

Due to further footdragging by OSFI, I will be extending the DeemedMaturity date for insurance issues by another two years in the near future.

Sectoral distribution of the MAPF portfolio on March 31 was as follows:

MAPF Sectoral Analysis 2014-01-31
HIMI Indices Sector Weighting YTW ModDur
Ratchet 0% N/A N/A
FixFloat 0% N/A N/A
Floater 0% N/A N/A
OpRet 0% N/A N/A
SplitShare 15.1% (+0.2) 4.10% 5.79
Interest Rearing 0% N/A N/A
PerpetualPremium 0% N/A N/A
PerpetualDiscount 10.5% (+0.2) 5.25% 15.02
Fixed-Reset 9.3% (+4.2) 4.05% 7.84
Deemed-Retractible 54.8% (-4.3) 6.13% 8.31
Scraps (Various) 10.2% (+0.2) 6.33% 11.99
Cash +0.2% (-0.4) 0.00% 0.00
Total 100% 5.55% 8.95
Totals and changes will not add precisely due to rounding. Bracketted figures represent change from February month-end. Cash is included in totals with duration and yield both equal to zero.
DeemedRetractibles are comprised of all Straight Perpetuals (both PerpetualDiscount and PerpetualPremium) issued by BMO, BNS, CM, ELF, GWO, HSB, IAG, MFC, NA, RY, SLF and TD, which are not exchangable into common at the option of the company. These issues are analyzed as if their prospectuses included a requirement to redeem at par on or prior to 2022-1-31 (banks) or 2025-1-3 (insurers and insurance holding companies), in addition to the call schedule explicitly defined. See OSFI Does Not Grandfather Extant Tier 1 Capital, CM.PR.D, CM.PR.E, CM.PR.G: NVCC Status Confirmed and the January, February, March and June, 2011, editions of PrefLetter for the rationale behind this analysis. (all recent editions have a short summary of the argument included in the “DeemedRetractible” section)

Note that the estimate for the time this will become effective for insurers and insurance holding companies was extended by three years in April 2013, due to the delays in OSFI’s providing clarity on the issue.

The “total” reflects the un-leveraged total portfolio (i.e., cash is included in the portfolio calculations and is deemed to have a duration and yield of 0.00.). MAPF will often have relatively large cash balances, both credit and debit, to facilitate trading. Figures presented in the table have been rounded to the indicated precision.

The shift from DeemedRetractibles to FixedResets was caused mainly by trades selling GWO.PR.Q (at about 23.72) to purchase GWO.PR.N (at about 21.96). At month-end, GWO.PR.Q was bid at 23.93 (up about 21 cents) and GWO.PR.N was at 22.19 (up about 26 cents) – so the trade was slightly ahead by month-end.

Credit distribution is:

MAPF Credit Analysis 2014-2-28
DBRS Rating Weighting
Pfd-1 0 (0)
Pfd-1(low) 28.4% (-0.1)
Pfd-2(high) 52.6% (+0.1)
Pfd-2 0%
Pfd-2(low) 8.5% (+0.1)
Pfd-3(high) 1.0% (0)
Pfd-3 4.5% (-0.6)
Pfd-3(low) 2.6% (+0.9)
Pfd-4(high) 0%
Pfd-4 0%
Pfd-4(low) 0.8% (0)
Pfd-5(high) 1.4% (+0.1)
Cash +0.6% (+0.5)
Totals will not add precisely due to rounding. Bracketted figures represent change from February month-end.
A position held in NPI.PR.A is not rated by DBRS, but has been included as “Pfd-3(high)” in the above table on the basis of its S&P rating of P-3(high).

Liquidity Distribution is:

MAPF Liquidity Analysis 2014-3-31
Average Daily Trading Weighting
<$50,000 0.0% (0)
$50,000 – $100,000 19.1% (+1.9)
$100,000 – $200,000 19.8% (-0.3)
$200,000 – $300,000 55.6% (+1.5)
>$300,000 5.3% (-2.7)
Cash +0.2% (-0.4)
Totals will not add precisely due to rounding. Bracketted figures represent change from February month-end.

MAPF is, of course, Malachite Aggressive Preferred Fund, a “unit trust” managed by Hymas Investment Management Inc. Further information and links to performance, audited financials and subscription information are available the fund’s web page. The fund may be purchased either directly from Hymas Investment Management or through a brokerage account at Odlum Brown Limited. A “unit trust” is like a regular mutual fund, but is sold by offering memorandum rather than prospectus. This is cheaper, but means subscription is restricted to “accredited investors” (as defined by the Ontario Securities Commission) or those who subscribe for $150,000+. Fund past performances are not a guarantee of future performance. You can lose money investing in MAPF or any other fund.

A similar portfolio composition analysis has been performed on the Claymore Preferred Share ETF (symbol CPD) (and other funds) as of August 31, 2012, and published in the October (mainly methodology), November (most funds), and December (ZPR) 2012, PrefLetter. While direct comparisons are difficult due to the introduction of the DeemedRetractible class of preferred share (see above) it is fair to say:

  • MAPF credit quality is better
  • MAPF liquidity is a bit lower
  • MAPF Yield is higher
  • Weightings
    • MAPF is much more exposed to DeemedRetractibles
    • MAPF is much less exposed to Operating Retractibles
    • MAPF is much more exposed to SplitShares
    • MAPF is less exposed to FixFloat / Floater / Ratchet
    • MAPF weighting in FixedResets is much lower

April 4, 2014

Friday, April 4th, 2014

I mentioned on April 4 that Charles Schwab, Inc., had come out against High Frequency Trading (HFT). Assiduous Readers have been on tenterhooks all day, wondering when Schwab will reveal the secrets of the universe and the golden key to riches through equity investment. Today, we got an answer:

“When you’re at record high levels, people start to get a little tentative going into weekends,” Randy Frederick, managing director of trading and derivatives at Charles Schwab Corp. which manages $2.2 trillion in client assets, said in a phone interview. “Taking a few profits off the table going into the weekend is probably not a bad strategy.”

What a thoroughly asinine remark, illustrative of Big Broker culture: ‘Go with the flow and avoid thinking’.

Meanwhile, another firm has been victimized for not being kind to stupid people:

The Securities and Exchange Commission today charged the owner of a Holmdel, N.J.-based brokerage firm with manipulative trading of publicly traded stocks through an illegal practice known as “layering” or “spoofing.”

The SEC also charged the owner and others for registration violations. Two firms and five individuals agreed to pay a combined total of nearly $3 million to settle the case.

In layering, the trader places orders with no intention of having them executed but rather to trick others into buying or selling a stock at an artificial price driven by the orders that the trader later cancels. An SEC investigation found that Joseph Dondero, a co-owner of Visionary Trading LLC, repeatedly used this strategy to induce other market participants to trade in a particular stock. By placing and then canceling layers of orders, Dondero created fluctuations in the national best bid or offer of a stock, increased order book depth, and used the non-bona fide orders to send false signals to other market participants who misinterpreted the layering as true demand for the stock.

“The fair and efficient functioning of the markets requires that prices of securities reflect genuine supply and demand,” said Sanjay Wadhwa, senior associate director of the SEC’s New York Regional Office. “Traders who pervert these natural forces by engaging in layering or some other form of manipulative trading invite close scrutiny from the SEC.”

Well, if technical analysts want to play around attempting to measure “true demand” for any particular stock, let them. But the fair and efficient functioning of the markets actually requires that the prices of securities reflect, to as close a degree as possible, the fundamental value of those securities. That’s how you get the best results in capital allocation, both by issuers getting clear signals about what their businesses are worth, and by investors being rewarded according to the accuracy of their estimates of fundamental value.

I will also point out that this spoofing strategy can get very expensive if somebody starts running a pounce algorithm.

By keeping markets safe for the stupid, the regulators are encouraging bubbles and hindering sustainable expansion of the economy.

There was a pretty good US jobs number today:

Companies powered the U.S. job market past a milestone in March as private employment exceeded the pre-recession peak for the first time, showing the kind of progress Federal Reserve officials look for to maintain their current policy course.

Payrolls excluding government agencies rose by 192,000 workers after a 188,000 gain in February that was larger than first estimated, the Labor Department reported today in Washington. That brought the job count to 116.1 million, beating the January 2008 high of 116 million. The jobless rate held at 6.7 percent even as almost half a million people entered the workforce.

… but Pew Research reminds us that there is a lot of catching up to do:

Because more people are entering the labor force each month, merely replacing all the jobs lost during the recession won’t bring employment back to its pre-crisis level.

Under the most optimistic scenario — the economy adds 472,000 jobs a month, the highest single-month rate in the 2000s — it would still take until October 2015 for employment to regain its pre-recession level. If the economy replicates its performance in 2005 (the best year since 2000) and adds about 208,000 jobs a month, it would take until September 2018. And if the economy continues to add jobs at the rate it has since late 2010 — an average of 182,000 a month — the employment gap won’t be closed till August 2019.

It was another positive day for the Canadian preferred share market, with PerpetualDiscounts up 5bp, FixedResets winning 10bp and DeemedRetractibles gaining 3bp. Volatility was minimal. Volume was well below average.

HIMIPref™ Preferred Indices
These values reflect the December 2008 revision of the HIMIPref™ Indices

Values are provisional and are finalized monthly
Index Mean
Current
Yield
(at bid)
Median
YTW
Median
Average
Trading
Value
Median
Mod Dur
(YTW)
Issues Day’s Perf. Index Value
Ratchet 0.00 % 0.00 % 0 0.00 0 0.0560 % 2,477.0
FixedFloater 4.69 % 4.30 % 35,505 17.71 1 0.0000 % 3,615.6
Floater 2.94 % 3.06 % 50,329 19.62 4 0.0560 % 2,674.5
OpRet 4.64 % -0.97 % 99,042 0.21 3 0.0000 % 2,691.1
SplitShare 4.81 % 4.31 % 64,519 4.27 5 0.0000 % 3,086.1
Interest-Bearing 0.00 % 0.00 % 0 0.00 0 0.0000 % 2,460.7
Perpetual-Premium 5.54 % -2.83 % 103,554 0.09 13 0.0876 % 2,376.7
Perpetual-Discount 5.44 % 5.47 % 123,069 14.62 23 0.0545 % 2,470.9
FixedReset 4.69 % 3.64 % 208,005 4.31 79 0.0959 % 2,523.5
Deemed-Retractible 5.04 % 0.97 % 150,064 0.24 42 0.0347 % 2,481.6
FloatingReset 2.63 % 2.48 % 186,626 4.30 5 0.1666 % 2,464.0
Performance Highlights
Issue Index Change Notes
CIU.PR.C FixedReset -1.79 % YTW SCENARIO
Maturity Type : Limit Maturity
Maturity Date : 2044-04-04
Maturity Price : 20.88
Evaluated at bid price : 20.88
Bid-YTW : 3.81 %
BAM.PF.B FixedReset 1.30 % YTW SCENARIO
Maturity Type : Limit Maturity
Maturity Date : 2044-04-04
Maturity Price : 23.14
Evaluated at bid price : 24.94
Bid-YTW : 4.22 %
Volume Highlights
Issue Index Shares
Traded
Notes
W.PR.J Perpetual-Discount 201,980 TD crossed two blocks of 100,000 each, both at 24.70.
YTW SCENARIO
Maturity Type : Limit Maturity
Maturity Date : 2044-04-04
Maturity Price : 24.46
Evaluated at bid price : 24.70
Bid-YTW : 5.68 %
BMO.PR.J Deemed-Retractible 190,010 RBC crossed three blocks; 100,000 and 30,000 at 25.74 and 25,000 at 25.75. Desjardins crossed 31,700 at 25.75.
YTW SCENARIO
Maturity Type : Call
Maturity Date : 2014-05-04
Maturity Price : 25.50
Evaluated at bid price : 25.77
Bid-YTW : -2.84 %
FTS.PR.K FixedReset 107,802 RBC crossed 100,000 at 25.04.
YTW SCENARIO
Maturity Type : Limit Maturity
Maturity Date : 2044-04-04
Maturity Price : 23.17
Evaluated at bid price : 25.00
Bid-YTW : 3.72 %
TD.PR.Q Deemed-Retractible 57,261 RBC crossed 47,500 at 26.30.
YTW SCENARIO
Maturity Type : Call
Maturity Date : 2014-05-04
Maturity Price : 25.75
Evaluated at bid price : 26.24
Bid-YTW : -21.04 %
BNS.PR.X FixedReset 43,404 CIBC bought blocks of 10,000 and 10,700 from Nesbitt, both at 24.99.
YTW SCENARIO
Maturity Type : Call
Maturity Date : 2014-05-25
Maturity Price : 25.00
Evaluated at bid price : 24.98
Bid-YTW : 3.66 %
ENB.PR.D FixedReset 32,296 TD crossed 25,000 at 24.35.
YTW SCENARIO
Maturity Type : Limit Maturity
Maturity Date : 2044-04-04
Maturity Price : 22.99
Evaluated at bid price : 24.30
Bid-YTW : 4.13 %
There were 23 other index-included issues trading in excess of 10,000 shares.
Wide Spread Highlights
Issue Index Quote Data and Yield Notes
VNR.PR.A FixedReset Quote: 25.36 – 25.69
Spot Rate : 0.3300
Average : 0.2502

YTW SCENARIO
Maturity Type : Call
Maturity Date : 2017-10-15
Maturity Price : 25.00
Evaluated at bid price : 25.36
Bid-YTW : 4.22 %

IFC.PR.C FixedReset Quote: 25.59 – 25.83
Spot Rate : 0.2400
Average : 0.1803

YTW SCENARIO
Maturity Type : Call
Maturity Date : 2016-09-30
Maturity Price : 25.00
Evaluated at bid price : 25.59
Bid-YTW : 3.24 %

BAM.PR.X FixedReset Quote: 21.23 – 21.47
Spot Rate : 0.2400
Average : 0.1840

YTW SCENARIO
Maturity Type : Limit Maturity
Maturity Date : 2044-04-04
Maturity Price : 21.23
Evaluated at bid price : 21.23
Bid-YTW : 4.37 %

HSB.PR.D Deemed-Retractible Quote: 25.27 – 25.54
Spot Rate : 0.2700
Average : 0.2149

YTW SCENARIO
Maturity Type : Call
Maturity Date : 2014-12-31
Maturity Price : 25.00
Evaluated at bid price : 25.27
Bid-YTW : 3.58 %

CIU.PR.C FixedReset Quote: 20.88 – 21.24
Spot Rate : 0.3600
Average : 0.3057

YTW SCENARIO
Maturity Type : Limit Maturity
Maturity Date : 2044-04-04
Maturity Price : 20.88
Evaluated at bid price : 20.88
Bid-YTW : 3.81 %

RY.PR.C Deemed-Retractible Quote: 25.65 – 25.82
Spot Rate : 0.1700
Average : 0.1163

YTW SCENARIO
Maturity Type : Call
Maturity Date : 2014-11-24
Maturity Price : 25.25
Evaluated at bid price : 25.65
Bid-YTW : 2.86 %

TXPR / TXPL 14Q2 Rebalancing Changes Announced

Friday, April 4th, 2014

S&P Dow Jones Indices Canadian Index Operations has announced:

the following index changes as a result of the quarterly S&P/TSX Preferred Share Index and S&P/TSX Preferred Share Laddered Index Reviews. These changes will be effective at the open on Monday, April 21, 2014.

S&P/TSX Preferred Share Index

ADDITIONS

Symbol
Issue Name CUSIP
AIM.PR.C AIMIA INC. CUMULATIVE RESET SERIES ‘3’ PR 00900Q 40 0
BAM.PF.E BROOKFIELD ASSET MANAGEMNT INC CL A PR SER 38 112585 55 9
CWB.PR.B CANADIAN WESTERN BANK 5-YR RESET PR SER ‘5’ 136765 50 0
ENB.PF.A ENBRIDGE INC. PR SER ‘9’ 29250N 62 6
IAG.PR.F INDUSTRIAL ALLIANCE INS & FIN SERV 5.90% PR F 455871 50 9
MFC.PR.L MANULIFE FINANCIAL CORP. CL 1 PR SER ’15’ 56501R 72 6
NA.PR.L NATIONAL BANK OF CANADA 1ST PR SERIES ’16’ 633067 51 7
NA.PR.S NATIONAL BANK OF CANADA 5-YR 1ST PR SER ’30’ 633067 31 9
PPL.PR.E PEMBINA PIPELINE CORPORATION CL ‘A’ PR SER 5 706327 11 1
RY.PR.Z ROYAL BANK OF CANADA 1ST PR NON-CUM SER ‘AZ’ 78012G 41 1
TRP.PR.E TRANSCANADA CORPORATION 1ST PR SERIES ‘9’ 89353D 86 7

DELETIONS

Symbol
Issue Name CUSIP
ELF.PR.H E-L FINANCIAL CORP. 5.50% 1ST PR SERIES ‘3’ 26857Q 50 7
FTS.PR.E FORTIS INC. 1ST PR SERIES ‘E’ 349553 80 0
TCL.PR.D TRANSCONTINENTAL INC. 1ST PR SERIES ‘D’ 893578 30 2
VNR.PR.A VALENER INC. SERIES ‘A’ PR 91912H 20 7

S&P/TSX Preferred Share Laddered Index

ADDITIONS

Symbol
Issue Name CUSIP
AIM.PR.C AIMIA INC. CUMULATIVE RESET SERIES ‘3’ PR 00900Q 40 0
CWB.PR.B CANADIAN WESTERN BANK 5-YR RESET PR SER ‘5’ 136765 50 0
ENB.PF.A ENBRIDGE INC. PR SER ‘9’ 29250N 62 6
MFC.PR.L MANULIFE FINANCIAL CORP. CL 1 PR SER ’15’ 56501R 72 6
NA.PR.S NATIONAL BANK OF CANADA 5-YR 1ST PR SER ’30’ 633067 31 9
PPL.PR.E PEMBINA PIPELINE CORPORATION CL ‘A’ PR SER 5 706327 11 1
RY.PR.Z ROYAL BANK OF CANADA 1ST PR NON-CUM SER ‘AZ’ 78012G 41 1
TRP.PR.E TRANSCANADA CORPORATION 1ST PR SERIES ‘9’ 89353D 86 7

April 3, 2014

Friday, April 4th, 2014

Assiduous Reader PL writes in and says:

I know that getting and correctly interpreting market reaction to information quicker whether one minute or one second than the other players will always be an advantage. And though I think there should be a small transaction tax on all of us to reduce this madness I know this may never happen in North America, even though it is happening in Europe I believe.

HOWEVER the one HFT practice that should be stopped is the fake orders. Any bid or offer should be required to stay in for one minute during trading hours. If they want to enter BS orders then let them do them before market opens.

I never buy or sell anything in the first half hour anyway. Your thoughts on eliminating fake deliberately deceptive orders.?

I disagree with your characterization of short-duration orders as “fake”. They may not be posted on the exchange for very long (as little as a few milliseconds), but for the entire time they’re up, they may be executed against.

This is a controversial subject – Panther Energy Trading LLC was victimized by the CFTC for spoofing:

According to the Order, Coscia and Panther made money by employing a computer algorithm that was designed to unlawfully place and quickly cancel orders in exchange-traded futures contracts. For example, Coscia and Panther would place a relatively small order to sell futures that they did want to execute, which they quickly followed with several large buy orders at successively higher prices that they intended to cancel. By placing the large buy orders, Coscia and Panther sought to give the market the impression that there was significant buying interest, which suggested that prices would soon rise, raising the likelihood that other market participants would buy from the small order Coscia and Panther were then offering to sell. Although Coscia and Panther wanted to give the impression of buy-side interest, they entered the large buy orders with the intent that they be canceled before these orders were actually executed. Once the small sell order was filled according to the plan, the buy orders would be cancelled, and the sequence would quickly repeat but in reverse – a small buy order followed by several large sell orders. With this back and forth, Coscia and Panther profited on the executions of the small orders many times over the period in question.

David Meister, the CFTC’s Enforcement Director, said, “While forms of algorithmic trading are of course lawful, using a computer program that is written to spoof the market is illegal and will not be tolerated. We will use the Dodd Frank anti-disruptive practices provision against schemes like this one to protect market participants and promote market integrity, particularly in the growing world of electronic trading platforms.”

I take the view that you can’t cheat an honest man. If somebody is spoofed into taking the ‘wrong’ side of the market in this way, he has only himself to blame. The markets exist for the formation and movement of long term capital – these short-term games are basically irrelevant to this purpose, but to the extent they do exist, they narrow spreads for real-money players. Speculators – such as HFT, traditional brokerages and fools – should be of interest to policy makers only to the extent that they provide liquidity to real money. We should not be doing a damn thing to protect traders whose Big Idea is ‘buy things when they start to go up’. As I said on May 7, 2010:

The way to eliminate stupid dumb trading is to ensure that stupid dumb traders lose all their money, go bankrupt and die.

The CFTC – under Dodd-Frank – takes the view that these are simply short-term versions of pump-and-dump, despite the fact that no execution actually occurred. If Panther had executed wash trades through separate accounts, giving rise to actual volume, they would have a better case for this … but with pump-and-dump, I also take the view that the law is merely molly-coddling of incompetent fools. If 21.50 is too much to pay for XZY stock … then don’t buy XZY at 21.50. It’s as simple as that.

I cancelled an order today within one minute of placing it. I’ll use fake numbers to illustrate: there was a bid for 500 shares at 21.50; the next bid was at 21.40. The offer was at about 21.60. I wanted to sell 1,000 shares and I thought 21.50 was a good price, so I hit the bid and got done for 500, which left me on the offer side of the market. But the offer behind me was at 21.60! Why should I improve the quote – using client money – by ten cents? So I modified the offer on the 500 shares remaining on my order to 21.58. Selling at 21.50 was good, but selling at 21.58 would be better. Selling at 21.50 with execution certainty is one thing; offering the entire world an option to buy them at 21.50 is another.

I don’t understand why you want to jail me for that.

It should also be noted that although Nanex is a firm I respect – they did excellent work on the Flash Crash – their conclusions regarding algorithmic behaviour have been challenged:

Nanex regularly misunderstands what it sees in market data and is fueling misconceptions that damage investor confidence, according to Manoj Narang, founder and chief executive officer of HFT firm Tradeworx Inc. in Red Bank, New Jersey. He compared Nanex to the “truthers” who doubt the official explanation of the Sept. 11 terrorist attacks.

There are usually benign explanations for what look to Nanex like attempts to manipulate prices through what it calls “quote stuffing,” he said. For example, he said, bursts of quotes could be trading algorithms reacting when the difference between the best bid to buy and the best offer to sell grows to more than a penny. The programs automatically cancel the orders after exchanges modify them to avoid markets where bids equal offers, according to Narang, resulting in “inadvertent repetitive behavior” by algorithms.

Assiduous Reader PL’s support for a Tobin Tax is one that keeps resurfacing like a lump of decomposing sewage:

Still, proponents of stricter regulation said they see the debate over the [Michael Lewis] book [Flash Boys] as a catalyst for possible future changes.

“The simplest approach and most direct approach is with a transaction tax,” said [ Democrat Representative Peter ] DeFazio, whose legislation would impose what he described as a “miniscule” 3-basis-point levy on the sell side of transactions.

However, it is quite apparent that Tobin taxes harm market quality. One possibility where the AR PL and I might have a meeting of minds is the potential for an exchange to impose a fee for the placement of an order – generally, once you’re permitted to place orders on the exchange, the only fees remaining are charged for executed transactions.

Schwab is upset about the number of orders:

High-frequency trading pumped out over 300,000 trade inquiries each second last year, up from just 50,000 only seven years earlier. Yet actual trade volume on the exchanges has remained relatively flat over that period. It’s an explosion of head-fake ephemeral orders – not to lock in real trades, but to skim pennies off the public markets by the billions.

Added systems burdens, costs and distortions of rapid-fire quote activity: Ephemeral quotes, also called “quote stuffing,” that are cancelled and reposted in milliseconds distort the tape and present risk to the resiliency and integrity of critical market data and trading infrastructure. The tremendous added costs associated with the expanded capacity and bandwidth necessary to support this added data traffic is ultimately borne in part by individual investors.

There are solutions. Today there is no restriction to pumping out millions of orders in a matter of seconds, only to reverse the majority of them. It’s the life-blood of high-frequency trading. A simple solution would be to establish cancellation fees to discourage the practice of quote stuffing. The SEC and CFTC floated the idea last year. It has great merit. Make the fees high enough and they will eliminate high-frequency trading entirely.

However, I would support a charge for order entry (or simply order cancellation, assuming that executed orders get charged by other means) only to the extent that it is imposed by the exchanges to recover costs or as a source of competitive advantage. If, once you count amortization of all the required infrastructure, it costs $1 to process 1,000,000 orders, then by all means, charge $0.000001 to process an order. If you want to make a profit and the market will bear it, then by all means, charge $0.000002 to process an order. If your customers complain that they have to process all these orders too, then by all means offer them a kiddie feed at reduced price, transmitting orders only when they have been extant for 10 milliseconds.

But don’t start imposing fees with grandiose visions of Better Living Through Higher Taxation. We all know where that ends up.

In fact, I have learned from a paper by Charles M. Jones of Columbia Business School titled What do we know about high-frequency trading? that:

Order cancellation or excess message fees: If bandwidth and data processing requirements are overwhelming some trading venue customers, it may be appropriate for trading venues to set prices accordingly and charge the participants who are imposing those costs on others. Nasdaq is currently imposing these fees in the U.S.; it is too soon to measure the effects. However, order cancellation fees will almost certainly reduce liquidity provision away from the inside quote, reducing market depth. The current initiatives should be studied carefully before broader-based message fees are considered.

He also points out – bless the man – that:

Minimum order exposure times: Under these proposals, submitted orders could not be cancelled for at least some period of time, perhaps 50 milliseconds. This would force large changes in equity markets and could severely discourage liquidity provision. The economic rationale here is particularly suspect, as the overriding goal in market design should be to encourage liquidity provision.

Securities transaction taxes: The evidence indicates that these taxes reduce share prices, increase volatility, reduce price efficiency, worsen liquidity, increase trading costs, and cause trading to move offshore.

At the cost of severe personal trauma – which I hope you guys appreciate – I have actually gone to the extent of watching a video titled ‘Michael Lewis: Programmers have Replaced Traders’. My God, but I hate watching TV and listening to lectures! Anyway, the video makes it plain that the big thing that is really at issue is the replacement of the old time smiley-boys by geeks who can actually do things, like programme these here computer whatchamacallits. Brad Katsuyama, who was discussed on PrefBlog on April 2, was on it … just another smiley boy, having his lunch eaten by people who know what they’re doing. Yawn.

Meanwhile, Schneiderman wrote an op-ed for the Daily News titled The need for speed is costing billions:

Some high-frequency trading firms engage in a practice called “latency arbitrage” — a technical euphemism that hides a threat to the integrity of our markets.

This is what we should be talking about. This is what I am investigating.

Put simply, latency arbitrage describes the trading strategy whereby high-frequency traders gain access to market prices before regular investors.

Armed with what amounts to knowledge of the future, these traders execute tens of thousands of trades in milliseconds with essentially zero risk — driving up the cost for other purchasers of stock.

Here is how it works: When traditional investors buy or sell stocks, they often use what’s called the “consolidated feed” to gather market data and determine the best bid or offer in the nation. This is particularly so in private trading venues, where regular investors like pension funds often trade.

Because high-frequency trading firms receive market prices before traders relying on the consolidated feed, they are able to see the prices early, jump in and take the best one in the blink of an eye. Regular investors are left in the dark.

Well, BooHooHoo. OK, Schneiderman, make it a law that the only market data feed allowed is the Schneiderman Consolidated Feed. Fine. I’ll co-locate with the feed provider. If that’s illegal, I’ll rent a room across the street. You’re in an argument with physics here and you ain’t gonna win.

He goes on:

That is also why I am calling for market reforms like the one put forward by experts at the University of Chicago.

He is referring to frequent batch auctions, which were discussed on PrefBlog on March 19. It was also given a brief mention in the CFTC Concept Release on Risk Controls and System Safeguards for Automated Trading Environments, which also asked a question dear to Assiduous Reader PL’s heart:

96. Should exchanges impose a minimum time period for which orders must remain on the order book before they can be withdrawn? If so, should this minimum resting time requirement apply to orders of all sizes or be restricted to orders smaller than a specific threshold? If there should be a specific threshold, how should that threshold be determined?

99. Would batched order processing increase the number of milliseconds that are necessary for correlations among related securities to be established? If so, what specific costs would result from this change and how do those costs compare to the potential benefits described in recent research?

The comment period on this concept release was extended to Valentine’s Day; fifty-seven comments have been published on the CFTC website. I simply do not have time to comb through all these things, especially since it would seem that this is viewed as simply a preliminary skirmish in a long war, but I did read a comment by Thomas McCabe of One Chicago LLC:

Market participants should be free to enter, cancel, or cancel/replace their orders at will, as they assume the risk of execution or non-execution. Exchanges are in a unique position to understand the strain on their systems caused by orders and should be allowed to independently govern throughput into those systems. Accordingly, we oppose the Commission mandating that exchanges impose minimum time periods for orders.

Well, yeah. I looked around a bit for critiques of batched order processing and found one on a blog by somebody claiming to have a good resume. The post is titled Beware Discrete Auctions:

But, I was intrigued by the idea of batch auctions, because I’ve heard people who think discrete auctions are better than continuous ones. I think they are not very good, and a simple example is an extreme of this, one can look at the performance of closing vs. opening prices. One is at the end of continuous trading, one where there’s no trading. What happens?

Well, I looked at over 1000 stocks, from 2000 to today. I excluded really small, low-priced stocks. The Open-Open returns have slightly higher volatility (2% higher), but more importantly, there’s a lot more ‘mean reversion’. The graph below shows the future returns(O-O or C-C), sorted each day into deciles by the immediate prior return (O-O or C-C, respectively), then averaged over all those days.

Basically, markets open at extremes that are quickly erased, allowing the market makers to pocket nice premiums for these temporary imbalances (you can’t make money off this if you aren’t a specialist). Continuous trading takes such trades away from monopolists, and allows competition to work.

meanReversion
Click for Big

… and a comment to that post …

Our U Chicago Colleagues are delusional: They are trying to solve a problem that doesn’t exist.

People just need to stop using “market” orders. Would you buy a house on the “market” price, by telling your Realtor that you’ll agree to ANY price the seller wants? Probably not. And there’s no reason to do that with stocks either.

Of course, one reason to use market trades is because the trader is too lazy to figure out limits. In that case, the trader pays for that convenience.

Regarding “clogging bandwidth” there is no evidence that flash orders are causing dissarray in the exchange. Even if they were, that would just be a technical issue of the exchange, and should be handled like any DOS attack.

Third, their solution won’t work. Batching by 1 second would lead to people timing the system, and figuring out how do direct orders into one auction or another to optimize trading. It would actually add complexity into the market that would give an advantage to the HFTs. The authors should try their proposed solution at Kovler Cafe, and see if it makes getting lunch more orderly.

One problem I see with batched processing is swap orders – or paired orders that have that intent. Say I want to sell A and buy B. In such a case, when I get one side filled, I want to execute the other as quickly as possible, so I can make or exceed my spread target. Batching interferes with that.

Another problem is when I’m spending or raising X dollars on behalf of a client. If I am a good little Portfolio Manager, genuinely trying to do the best for my client, I’ll put in a bunch of orders totalling (say) 2X. As some get filled, I’ll cancel others and – with no more than average luck – be able to raise or spend X dollars at good prices on the market. Again, batched processing will make that cancellation process a bit more chancy, causing me to reduce my over-ordering, reducing liquidity in the market place and making real-money trading more expensive.

Yet another problem is for dealers executing crosses, which may or may not be contingent on other stuff (e.g., pairs trades and, in the futures market, exchange for physicals). At present, there is a quote with a spread in continuous time, with executions in discrete time; therefore, there will always be a quote and the cross can be executed anywhere inside that quote. With batching, there’s the potential for the market to be locked at inconvenient prices for lengthy periods; another obstacle to trading by real-money traders.

The Australians had this to say about latency arbitrage:

We do not regard the fact that market participants can co-locate to obtain a speed advantage as inherently unfair. Speed of access to the market has always been contestable, from the days of physical proximity on the floor, when an open outcry system operated. We recognise that not all market operators choose to operate at the co-location site with the lowest latency, but for those who do, our concern is to ensure that the facilities for doing so are made available to them on a fair basis and on transparent terms.

Our assessment is that access to these services is fair. Market operators offer economically reasonable and transparent pricing, inclusive of ongoing fee costs, that is publicly available and access to these services is available on a non-discriminatory basis. Network connections within co-location facilities are precisely measured, and all participants within the facility receive their data feed with exactly the same latency as any other participant running the same options.

However, market operators are required to provide market data on a fair, transparent and non-discriminatory basis. No trader is capable of detecting any submitted market message before acceptance by that operator. Many of the complaints about latency received and reviewed by ASIC appear to arise from the complainants’ misunderstanding of participant SORs.

390 Many market participants will find that the routing options and time taken by their SORs to break, and route, orders between operators is considerably longer than the reaction times of many highly automated traders. If this happens they may find that when an order reaches market A and, before the related order reaches market B, another system has generated an order for market B possibly in response to the order on market A. Market participants need to take this factor into account when programming decision logic for their SORs.

… but the Australians don’t like market rebates:

We have previously stated (e.g. in Report 237 Response to submissions on Consultation Paper 145 Australian equity market structure: Proposals (REP 237) and CP 168) that we would be concerned if pricing incentives influence behaviour in a way that is not in the best interests of clients and wider market integrity. We believe there is sufficient evidence to conclude that maker–taker models, where the market operator pays a rebate, do not promote market quality or market integrity.

Intriugingly:

Another sign of Australia’s success in limiting HFT is that fewer orders go unfilled due to a charge on orders. High-frequency strategies are usually defined by the use of computers to post and cancel orders in times measured in thousandths and even millionths of seconds. In the six years through the end of 2013, the average order-to-trade ratio in Australia was 4.2, less than half that of the NYSE, according to data compiled by Sydney-based research firm Capital Markets CRC Ltd.

I can’t find any more information on that.

So, Assiduous Reader PL, my conclusion is: You are being manipulated by the Smiley-Boys. Cancellations and resting times are simply not an issue to real money fundamental traders.

There is widespread frustration over Canada’s inadequate housing data:

The issue came to the forefront Thursday after Canadian Imperial Bank of Commerce economist Benjamin Tal released a strongly worded note, titled “Flying Blind,” in which he said “the gap between the importance of the real estate market to the economy and the lack of publicly available information on it is mind-boggling.”

His laundry list of information that’s missing includes the share of foreign investors in the condominium market, the distribution of mortgages by credit score and the average down-payment.

“It would be useful to have more information about personal debt and the mortgage market,” says Toronto-Dominion Bank chief economist Craig Alexander. “If we think that Canada has a problem with excessive personal debt, you need the data to actually assess the vulnerability and what the associated risks are. But the reality is we actually have quite limited information.”

“Because there is a bit of a void on housing data we do have a lot of ill-considered opinions on the real estate market, and it’s hard to completely refute some of the wild talk we’ve had in recent years because the data set is limited,” says BMO Nesbitt Burns chief economist Douglas Porter.

He cautions, however, that more information is not a panacea. Deeper U.S. data did not prevent a housing boom and crash in that country.

I think a good first step would be for the Bank of Canada to stop lying about 5-year mortgage rates, but I’m just a grouch.

Great-West Lifeco has announced a deal:

Great-West Lifeco Inc. today announced that its U.S. subsidiary Great-West Financial® has reached an agreement to acquire the J.P. Morgan Retirement Plan Services large-market recordkeeping business. Upon completion of the acquisition, Great-West Financial will become the second-largest retirement services provider by participants in the U.S. defined contribution market, with nearly 6.8 million participants and US$387 billion in recordkeeping assets. Terms of the transaction were not disclosed.

The J.P. Morgan Retirement Plan Services business comprises 200 clients with approximately 1.9 million participants and US$167 billion in retirement plan assets. As part of the transaction more than 1,000 staff and management affiliated with J.P. Morgan Retirement Plan Services will join Great-West Financial.

The transaction is scheduled to close in the third quarter of 2014, subject to regulatory approval in the U.S.

Jacqueline Nelson of the Globe reports:

“Great-West’s business has been more focused on the small to mid-sized market, so the JP Morgan transaction is highly complementary,” Mr. [Paul] Mahon [chief executive officer of Great-West Lifeco] said. The large market is classified as defined-contribution plans with more than $25-million (U.S.) in assets under administration, wrote analyst Peter Routledge. But JP Morgan’s plans are far larger, with average assets of $835-million, he noted.

Being in the larger market is helpful for two reasons, Mr. Mahon said. First, it lends credibility that a company can do business with the Fortune 100 employers. JP Morgan is the largest bank in the U.S. by assets, so it’s brand name has carried far with clients. If the deal boosts Great-West’s profile in the U.S. it could help the company sell other major products, such as asset management services and insurance products.

Second, and even more importantly to Mr. Mahon, different sized corporations have different requirements from plan managers. Large corporations often demand greater flexibility and technology capabilities. The acquisition allows Great-West to offer some of those advanced systems to its smaller clients.

DBRS comments:

DBRS views the transaction as a positive development and consistent with the Company’s strategy to grow its U.S. retirement services businesses. There are no changes to the ratings.

There is some integration risk given the very large size of these DC plans. It will be important for GWF to manage client retention well. However, switching plan record keepers is costly and time consuming for plan sponsors, so there would need to be a very significant inducement, be it positive or negative, for a plan departure to occur. DBRS views favourably the potential for incremental profits and future product placement synergies with the rest of the Company and views the financial impact of this acquisition as diminutive compared to the overall size of GWL’s balance sheet.

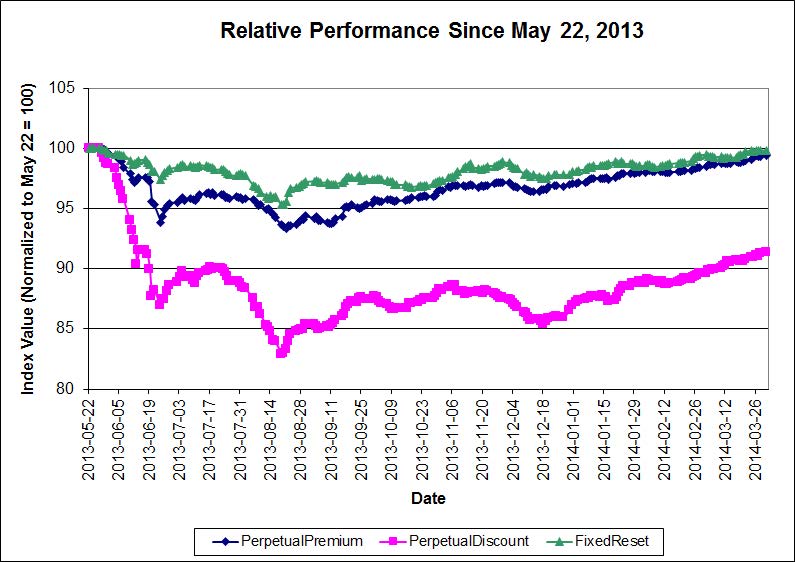
It was a good day for the Canadian preferred share market, with PerpetualDiscounts winning 16bp, FixedResets gaining 4bp and DeemedRetractibles up 7bp. Volatility was minimal. Volume was very low.

HIMIPref™ Preferred Indices
These values reflect the December 2008 revision of the HIMIPref™ Indices

Values are provisional and are finalized monthly
Index Mean
Current
Yield
(at bid)
Median
YTW
Median
Average
Trading
Value
Median
Mod Dur
(YTW)
Issues Day’s Perf. Index Value
Ratchet 0.00 % 0.00 % 0 0.00 0 0.3794 % 2,475.6
FixedFloater 4.69 % 4.30 % 36,824 17.71 1 -0.0987 % 3,615.6
Floater 2.94 % 3.05 % 50,373 19.63 4 0.3794 % 2,673.0
OpRet 4.64 % -0.96 % 103,093 0.21 3 0.1033 % 2,691.1
SplitShare 4.81 % 4.25 % 65,274 4.27 5 -0.0953 % 3,086.1
Interest-Bearing 0.00 % 0.00 % 0 0.00 0 0.1033 % 2,460.7
Perpetual-Premium 5.54 % -1.58 % 104,199 0.09 13 0.0423 % 2,374.6
Perpetual-Discount 5.44 % 5.47 % 124,550 14.61 23 0.1599 % 2,469.6
FixedReset 4.69 % 3.64 % 215,566 4.31 79 0.0389 % 2,521.0
Deemed-Retractible 5.04 % 1.15 % 151,472 0.16 42 0.0663 % 2,480.7
FloatingReset 2.63 % 2.49 % 188,977 4.30 5 0.1763 % 2,459.9
Performance Highlights
Issue Index Change Notes
PWF.PR.A Floater 1.28 % YTW SCENARIO
Maturity Type : Limit Maturity
Maturity Date : 2044-04-03
Maturity Price : 19.85
Evaluated at bid price : 19.85
Bid-YTW : 2.66 %
PWF.PR.P FixedReset 1.28 % YTW SCENARIO
Maturity Type : Limit Maturity
Maturity Date : 2044-04-03
Maturity Price : 23.39
Evaluated at bid price : 23.75
Bid-YTW : 3.63 %
Volume Highlights
Issue Index Shares
Traded
Notes
NA.PR.S FixedReset 133,248 Scotia crossed 100,000 at 25.39.
YTW SCENARIO
Maturity Type : Call
Maturity Date : 2019-05-15
Maturity Price : 25.00
Evaluated at bid price : 25.49
Bid-YTW : 3.82 %
BNS.PR.A FloatingReset 122,000 Nesbitt crossed 115,000 at 25.26.
YTW SCENARIO
Maturity Type : Call
Maturity Date : 2018-04-25
Maturity Price : 25.00
Evaluated at bid price : 25.29
Bid-YTW : 2.43 %
BMO.PR.L Deemed-Retractible 98,323 RBC crossed 69,600 at 26.40; Scotia crossed 25,000 at the same price.
YTW SCENARIO
Maturity Type : Call
Maturity Date : 2014-05-25
Maturity Price : 25.75
Evaluated at bid price : 26.39
Bid-YTW : -7.53 %
TRP.PR.E FixedReset 97,350 Scotia crossed blocks of 40,000 and 50,000 shares, both at 25.30.
YTW SCENARIO
Maturity Type : Limit Maturity
Maturity Date : 2044-04-03
Maturity Price : 23.20
Evaluated at bid price : 25.21
Bid-YTW : 3.94 %
ENB.PF.A FixedReset 78,020 Recent new issue.
YTW SCENARIO
Maturity Type : Limit Maturity
Maturity Date : 2044-04-03
Maturity Price : 23.19
Evaluated at bid price : 25.21
Bid-YTW : 4.25 %
TRP.PR.A FixedReset 57,720 TD crossed 50,000 at 22.45.
YTW SCENARIO
Maturity Type : Limit Maturity
Maturity Date : 2044-04-03
Maturity Price : 22.71
Evaluated at bid price : 23.33
Bid-YTW : 3.89 %
There were 18 other index-included issues trading in excess of 10,000 shares.
Wide Spread Highlights
Issue Index Quote Data and Yield Notes
BAM.PR.T FixedReset Quote: 24.06 – 24.42
Spot Rate : 0.3600
Average : 0.2161

YTW SCENARIO
Maturity Type : Limit Maturity
Maturity Date : 2044-04-03
Maturity Price : 23.00
Evaluated at bid price : 24.06
Bid-YTW : 4.20 %

CU.PR.G Perpetual-Discount Quote: 21.70 – 21.98
Spot Rate : 0.2800
Average : 0.1688

YTW SCENARIO
Maturity Type : Limit Maturity
Maturity Date : 2044-04-03
Maturity Price : 21.38
Evaluated at bid price : 21.70
Bid-YTW : 5.23 %

HSB.PR.D Deemed-Retractible Quote: 25.27 – 25.51
Spot Rate : 0.2400
Average : 0.1545

YTW SCENARIO
Maturity Type : Call
Maturity Date : 2014-12-31
Maturity Price : 25.00
Evaluated at bid price : 25.27
Bid-YTW : 3.57 %

BNS.PR.Q FixedReset Quote: 25.30 – 25.54
Spot Rate : 0.2400
Average : 0.1564

YTW SCENARIO
Maturity Type : Call
Maturity Date : 2018-10-25
Maturity Price : 25.00
Evaluated at bid price : 25.30
Bid-YTW : 3.28 %

GWO.PR.G Deemed-Retractible Quote: 24.33 – 24.57
Spot Rate : 0.2400
Average : 0.1648

YTW SCENARIO
Maturity Type : Hard Maturity
Maturity Date : 2025-01-31
Maturity Price : 25.00
Evaluated at bid price : 24.33
Bid-YTW : 5.57 %

RY.PR.A Deemed-Retractible Quote: 25.65 – 25.85
Spot Rate : 0.2000
Average : 0.1506

YTW SCENARIO
Maturity Type : Call
Maturity Date : 2014-05-24
Maturity Price : 25.25
Evaluated at bid price : 25.65
Bid-YTW : -3.58 %