An article in the Globe and Mail brought to my attention a paper by the eponymous Will Dunning Inc. titled How to Dissect a Housing Bubble which seems highly worthy of close attention:
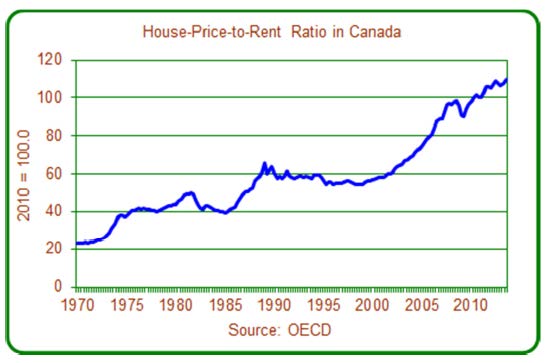
This report begins (in section 2.0) by looking at one of the key pieces of evidence that is brandished by those who believe a housing bubble exists in Canada: data on the ratio of house prices to rents, which has been created by the Organization for Economic Co-operation and Development (“OECD”). To be blunt, while the OECD has relied on data that it might consider the best available for the purpose, the data in reality is badly flawed and results in wildly inaccurate estimates.
The subsequent section (3.0 A Better Dataset) utilizes an alternative dataset, from the Royal LePage House Price Survey2. This analysis finds that the price to rent ratio in Canada has indeed increased, although the rise in the ratio is much less than was estimated by the OECD.
…
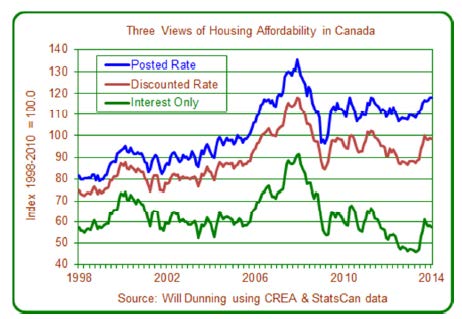
Section 4.0 (Housing Affordability Indicators) takes a slightly different approach, looking at evolving mortgage costs in relation to incomes. Several organizations publish housing affordability indexes. These generally indicate that housing affordability has deteriorated in Canada, and this has become an important part of the discussion. In this author’s opinion, these indexes share a major flaw: they rely on a measure of interest rates (“posted rates”) that exists only for administrative purposes and is divorced from the interest rates that can be found in the marketplace.
Well! That’s provocative enough, but I’ll grant him more credibility than the usual purveyors of shadow-statistics. The mortgage and GIC rates posted by the Bank of Canada are nonsensical (perhaps the legacy of some plan hatched by the Feds and executed by Lapdog Carney) – a five year mortgage is listed as costing 5.24% for the last three weeks of February and 4.99% for the first two weeks of March. Give me a break. Those are the posted rates – the banks have found that by having a posted rate and applying a discount, they can issue mortgages at the discounted price, but force buy-backs at the posted price when mortgagors exit early. Nice work, if you can get it, but why is the BoC participating in this charade? They’ve been reporting 5-Year GICs at 1.63% for the past five weeks, which will surprise anybody with access to the Financial Post web page or any of the myriad web sites which are able to report financial data more accurately than Parakeet Poluz and his fellow lackeys.
Actually, it’s even worse than it looks – Dunning claims:
Posted rates exist for administrative purposes only: lenders must use them in the calculation of debt service costs for some mortgages that receive federally guaranteed mortgage insurance. In mortgage contracts, interest rates and options for future interest rates are sometimes expressed as the posted rate minus a discount. In addition, when lenders calculate the penalties that borrowers pay for repaying early, posted rates (minus a pre-determined discount) are often in input into the calculations.
Dunning charges that:
The OECD calculates the Canadian house price to rent ratio using:
- • For house prices – the Teranet/National Bank National Composite House Price Index from 1999Q2. Prior to that date, data are from the Canadian Department of Finance.
- • For rents, the rent component of the Consumer Price Index (“CPI”)
…
For the years prior to 1999 (during which it appears that the CREA average national resale price is used), the rates of price growth have likely been distorted upwards by changes in the quality of the housing inventory.
…
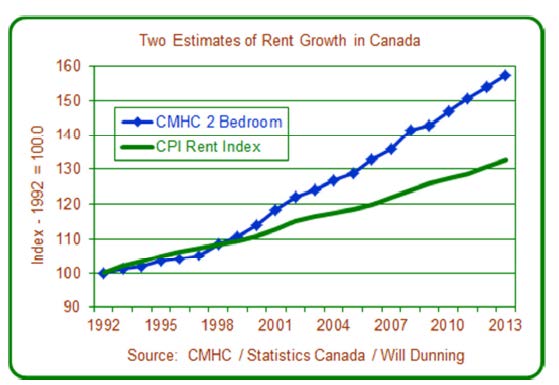
Looking at the rent data used in the calculation (the rent component of Statistics Canada’s Consumer Price Index), rates of rent growth are badly under-estimated.Data from rental surveys conducted by Canada Mortgage and Housing Corporation (“CMHC”) hint at the degree to which rent increases have been under-estimated in the Statistics Canada data that has been used by the OECD. It is clear in this data that the methodology change made in 2009 did not fully cure the data quality issues, and that the CPI rent index remains highly inaccurate.
The chart to the right presents CMHC data on average rents for apartments (units with two bedrooms) in Canada. To permit comparison to the rent component of the Consumer Price Index, the author has converted both datasets to indexes that equal 100 in 1992. Over the entire period covered, the CMHC data shows a total increase of 57.4% (2.2% per year); the CPI data shows a total rise of 32.7% (1.4% per year). Even for the period subsequent to the 2009 methodology revision, the CPI data shows a significantly slower rate of rent growth (1.3% per year) compared to the CMHC data (2.4% per year).
It can be argued that the CMHC data is not “constant quality” (because of additions to the inventory through new construction as well as due to renovations) and therefore the CMHC data might be distorted compared to the CPI (which attempts to measure rent change for constant quality accommodation). However, it should be noted that there are few additions to the inventory that is covered by the CMHC rental market survey – during the time period covered in the chart most growth of rental inventory has been in rented condominiums and other housing forms that are not included in the survey. Therefore, the degree of distortion from new supply is likely to be very small.
Click for Big
Interesting, indeed! This indicated long-term underestimation of rental growth is given credence by the OECD figures that are so fraught with interest:
Click for Big
Now, I’m reserving judgement on whether we’re in a housing bubble or not. I won’t even express a view as to whether houses are currently either rich or cheap. But I will not believe, not for one New York minute, that the Price-to-Rent ratio has quintupled since 1970. And, while I realize that Toronto is not actually equivalent to Canada (there are still a few unfortunate districts in the country), I will not believe, not for one New York minute, that the Price-to-Rent ratio has doubled since the bubble I remember of the late eighties, when one of my fellow clerks – making a clerical salary and not blessed with independent wealth – owned four houses, each of them mortgaged to hell ‘n’ gone (she got wiped out).
Of particular interest is his comparison of CMHC figures and the rent component of inflation:

Click for Big
This may well give the conspiracy theorists some live ammunition about CPI underestimation, at long last, but there’s more too it than simply academic discussions of price-rent ratios – the CPI is used to increment rent-control limits. One does not need to be a rabid partisan of Mike Harris to believe that rent control destroyed traditional rental housing in Toronto; a long term underestimate of rent increases just makes it more obvious.
That’s the meat of the report I found most interesting … I’ll just reproduce two more charts:
Click for Big
Click for Big
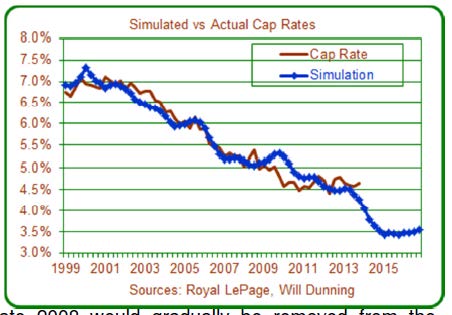
The current calculated cap rate of 4-5% looks right to me. In one building with which I am familiar, two-bedrooms sell for about $140,000, or can be rented for about $1,200 monthly – and this is roughly average for the area according to the CMHC. There’s a $600 maintenance fee, so the landlord’s cap rate is … just under 5%.
Anyway, this report is fraught with interest, what with us being told daily that we’re in imminent danger of a crash. The OECD and its fellow travellers need to address these issues and explain why they believe their figures to be accurate indicators of the Canadian housing market.