Archive for October, 2014

PVS Semi-Annual Report, June 2014

Monday, October 13th, 2014

Partners Value Split Corp. has released its Semi-Annual Report to June 30, 2014.

The company has the following issues outstanding: PVS.PR.A, PVS.PR.B, PVS.PR.C and PVS.PR.D.

Figures of interest are:

MER: I suggest it is best to include the amortization of share issue costs in MER – after all, this is a charge against the stated value of the company. Therefore, expenses were $213,000 (regular expenses) + $710,000 (amortization) = $923,000 for six months on assets of $2.348-billion (see below) or 8bp p.a..

Average Net Assets: We need this to calculate portfolio yield and MER. There were negligible capital transactions, so we’ll just take the average of the beginning and end of period assets (including preferred shares) so: [(1.501-billion + 0.690-billion) + (1.816-billion + 0.690-billon)]/2 = $2.348-billion

Underlying Portfolio Yield: Total Income of $21.0-million divided by average net assets of $2,348-million is 1.79% p.a..

Income Coverage: Net income of $20.846-million less amortization of $0.710-million is $20.136-million to cover senior preferred dividends of $12.993-million is 155%. However, I consider it prudent to include the $5-million stated entitlement of the Junior preferreds, even though less than half of this was actually paid in 2013 because the Juniors can be retracted at any time, which could prove embarrassing in times of extreme stress. So I’d say income coverage is 112%.

TD Sells Sponsored Company Agreements To Timbercreek

Monday, October 13th, 2014

This is late … really late! But better late than never.

On August 22, TD Bank announced:

TD Sponsored Companies Inc. (“TDSCI”) is pleased to announce that shareholders of TD Split Inc. (TSX:TDS), 5Banc Split Inc. (TSX:FBS) and Big 8 Split Inc. (TSX:BIG) (collectively, the “Funds”) today approved the proposed change in the administrator and investment manager of the Funds to Timbercreek Asset Management Ltd. (“Timbercreek”) from TDSCI, as more fully described in the Funds’ management information circular dated July 3, 2014.

The Transaction is expected to close in the middle of September 2014, subject to, among other conditions, obtaining all required regulatory approvals, at which time Timbercreek will become the administrator and investment fund manager of each Fund.

On September 19 it was further announced:

TD Sponsored Companies Inc. (“TDSCI”) and Timbercreek Asset Management Ltd. (“Timbercreek”) announced today the completion of the previously announced transaction pursuant to which Timbercreek has acquired the rights to administer and manage TD Split Inc., 5Banc Split Inc. and Big 8 Split Inc. (collectively, the “Funds”).

As a result of the transaction, Timbercreek now acts as administrator and investment fund manager of the Funds.

According to information on SEDAR, to which I am not permitted to link directly because I am a member of the public and the Canadian Securities Administrators have determined that scumbag members of the public are not permitted to link to public documents, but one of which is referenced as “TD Split Inc. Aug 1 2014 10:50:29 ET Management information circular – English PDF 91 K”:

Recently, TDSCI determined that acting as administrator for closed-end funds does not represent a core business focus going forward and is therefore seeking to exit the closed-end fund business at this time. On June 24, 2014, TDSCI and Timbercreek announced that they had entered into a definitive agreement (the ‘‘Transaction’’) pursuant to which Timbercreek agreed to acquire the rights to act as administrator and investment fund manager to the Funds under (i) the administration agreement dated November 15, 2010 between TD Split Inc. and TDSCI, (ii) the administration agreement dated December 15, 2011 between 5Banc Split Inc. and TDSCI and (iii) the administration agreement dated December 15, 2013 between Big 8 Split Inc. and TDSCI (collectively, the ‘‘Administration Agreements’’ and each, an ‘‘Administration Agreement’’).

Timbercreek Asset Management Ltd. has a value oriented investment philosophy, and specializes in providing conservatively managed, risk averse alternative asset class investment opportunities to institutions, trusts and endowment funds, discretionary investment advisors and qualified individuals. Timbercreek, a wholly owned subsidiary of Timbercreek Asset Management Inc., is an investment management company that employs a conservative and risk averse approach to real estate based investments. Timbercreek Asset Management Inc. is principally owned by 2314716 Ontario Limited, which in turn is principally owned, directly or indirectly, by R. Blair Tamblyn, Ugo Bizzarri and Tye Bousada. Its head office is located at 1000 Yonge Street, Suite 500, Toronto, Ontario, M4W 2K2.

The preferred shares affected, with links to their new websites, are:

October 10, 2014

Friday, October 10th, 2014

CU Inc. has announced:

it will issue $200,000,000 of 4.094% Debentures maturing on October 19, 2054, at a price of $100.00 to yield 4.094%. This issue was sold by RBC Dominion Securities Inc., BMO Nesbitt Burns Inc., TD Securities Inc., Scotia Capital Inc. and CIBC World Markets Inc. Proceeds from the issue will be used to finance capital expenditures, to repay existing indebtedness, and for other general corporate purposes of ATCO Electric Ltd. and ATCO Gas and Pipelines Ltd.

CIU.PR.A is trading in-line with the CU PerpetualDiscounts at about 5.12%, which is an interest-equivalent 6.66%, meaning that the Seniority Spread for CIU is about 256bp, in line with the index averages. Which is always nice to confirm on an individual company basis!

I think Parakeet Poloz has been told to stop providing forward guidance. He’s listed as the author of a BoC Discussion Paper, Integrating Uncertainty and Monetary Policy-Making: A Practitioner’s Perspective:

This paper discusses how central banking is evolving in light of recent experience, with particular emphasis on the incorporation of uncertainty into policy decision-making. The sort of post-crisis uncertainty that central banks are dealing with today is more profound than that which is typically subjected to rigorous analysis and does not lend itself easily to formal modelling. As a practical matter, the policy-maker is dependent on macro models to develop a coherent monetary policy plan, and this burden of coherence means that fundamental uncertainty must be incorporated explicitly into the policy formulation process. As suggested here, doing so transforms policy formulation from an exercise in reverse engineering to one of risk management, one consequence of which is to inject a little more realism about uncertainty into the policy narrative, while trusting markets to wrestle with the data flow and deliver two-way trading. The evolution is likely to be a long one—researchers are encouraged to keep focusing on developing a practical understanding of how the economy works, one that admits that rules around economic behaviour are not cast in stone, but are almost certainly subject to variation through time and events.

Helping people to appreciate the underlying reality and the limitations of our craft without invalidating our core value proposition is a challenging task. More importantly, the business of central banking is being reinvented in real time in reaction to these realities. At the Bank of Canada, some of the key manifestations of this evolution, as I have tried to motivate above, are:
(i) explicitly building forecast ranges or scenario modelling around key assumption variables, such as potential output, the neutral interest rate and the world price of oil, into our public policy dialogue;
(ii) pointing to key elements of fundamental uncertainty, analyzing the associated policy risks carefully and openly, and laying out complementary research as we learn more about those risks;
(iii) investing more in consultations with Canadian business people and financial market participants, both in the form of surveys and in frank, face-to-face conversations around alternative interpretations of the macroeconomic data;
(iv) bringing a more fulsome narrative to the policy decision-making process, based on a risk-management framework rather than the more conventional policy engineering model; and,
(v) bringing to the table more research on real-financial linkages and financial stability risks to generate a richer set of considerations that influence day-to-day policy thinking.

If the Parakeet and his masters want to emphasize the uncertainty of forecasting, they would be much better advised to appoint strong, independently minded people to the rate-setting committee, publicizing the dissenting votes with a brief rationale, and encouraging members of the committee to make speeches giving their views. Just like the FOMC. And, as I’ve noted before, I feel quite certain that a lot of these dissenting speeches are orchestrated … ‘Bob, I don’t think you’re right on this one, but you might be! Why not highlight that in a speech so the possibility gets some discussion?’

There were good Canadian jobs numbers:

Canada’s jobs numbers have followed a perfect pattern this year, with gains one month followed by losses the next.

September was no different. The country added a better-than-expected 74,100 jobs last month and – in a complete reversal of the prior month – most of the gains were in full-time positions, and in the private sector.

To put things in a longer-term perspective, employment has grown by a still-muted average of 13,000 jobs per month in the past year. But last month’s increase was an improvement in the jobs picture.

David Parkinson snipes in the Globe:

Statscan reports the “standard error” for the overall survey at 28,500. That means that statistically speaking, 68 per cent of the time the actual monthly job-change figure will be within a range of 28,500 plus or minus the figure Statscan reports; the other 32 per cent of the time, it will be a figure outside that range.

The standard error on the private-sector employment figure is 38,200, while for self-employment it’s 25,900.

What this means is that big numbers in the survey need to be taken with a grain of salt.

But anyway … jobs? Schmobs!:

Now, as longer-run inflation expectations erode in financial markets, the Federal Open Market Committee is shifting its focus toward prices after putting its main emphasis on jobs for months. Several officials worried that “inflation might persist below” the committee’s target for “quite some time,” minutes from the Sept. 16-17 meeting said.

Too-low inflation “is getting to be a real issue again,” said former Fed Governor Laurence Meyer. With inflation at 1.5 percent according to the Fed’s preferred index, Meyer said FOMC policy makers aren’t likely to raise interest rates, even if the economy approaches full employment, defined as a jobless rate of 5.2 percent to 5.5 percent. Unemployment was 5.9 percent last month.

Policy makers including regional Fed Presidents William Dudley of New York, Charles Evans of Chicago and Narayana Kocherlakota of Minneapolis have in recent days all mentioned below-target inflation as a risk that weighs against raising interest rates too soon.

And the stock market blew us another raspberry:

The Standard & Poor’s 500 Index (SPX) posted the biggest weekly drop in two years as concern about chipmaker earnings fueled a rout across the technology industry.

The Dow Jones Industrial Average (INDU) erased gains for the year as Intel Corp., Microsoft Corp. and Cisco Systems Inc. fell more than 3.5 percent. Microchip Technology Inc. tumbled 12 percent said quarterly revenue was crimped by a decline in China sales and warned of an industry correction. Juniper Networks Inc. sank 9.1 percent after reporting preliminary results that missed its own forecast.

The S&P 500 lost 1.2 percent to 1,906.09 as of 4 p.m. in New York. The index fell 3.1 percent for the week, the biggest drop since May 2012.

European Central Bank President Mario Draghi clashed with Germany’s finance minister yesterday over the steps needed to revive growth in the euro area, while Federal Reserve officials have said the U.S. economy may be at risk from a global slowdown.

The S&P 500 has fallen for the past three weeks, the longest run since January. It’s down 5.2 percent from a record on Sept. 18, trimming its gain for the year to 3 percent.

The Canadian preferred market declined today, with PerpetualDiscounts down 5bp, FixedResets losing 9bp and DeemedRetractibles off 3bp. Losing FixedResets dominated the Performance Highlights table. Volume was very low.

HIMIPref™ Preferred Indices
These values reflect the December 2008 revision of the HIMIPref™ Indices

Values are provisional and are finalized monthly
Index Mean
Current
Yield
(at bid)
Median
YTW
Median
Average
Trading
Value
Median
Mod Dur
(YTW)
Issues Day’s Perf. Index Value
Ratchet 3.09 % 3.07 % 23,169 19.52 1 1.6736 % 2,704.9
FixedFloater 0.00 % 0.00 % 0 0.00 0 0.2923 % 4,086.5
Floater 2.91 % 3.08 % 61,768 19.54 4 0.2923 % 2,743.9
OpRet 4.04 % 2.08 % 109,999 0.08 1 -0.0788 % 2,732.5
SplitShare 4.29 % 4.06 % 85,520 3.85 5 0.0364 % 3,153.0
Interest-Bearing 0.00 % 0.00 % 0 0.00 0 -0.0788 % 2,498.6
Perpetual-Premium 5.49 % 0.40 % 77,349 0.09 18 0.1054 % 2,452.4
Perpetual-Discount 5.33 % 5.15 % 96,621 15.07 18 -0.0502 % 2,588.0
FixedReset 4.23 % 3.69 % 167,525 16.49 75 -0.0925 % 2,547.2
Deemed-Retractible 5.03 % 2.59 % 100,736 0.46 42 -0.0258 % 2,558.9
FloatingReset 2.55 % -0.48 % 63,281 0.09 6 -0.0522 % 2,551.1
Performance Highlights
Issue Index Change Notes
TRP.PR.A FixedReset -1.91 % YTW SCENARIO
Maturity Type : Limit Maturity
Maturity Date : 2044-10-10
Maturity Price : 21.70
Evaluated at bid price : 22.10
Bid-YTW : 3.89 %
TRP.PR.C FixedReset -1.68 % YTW SCENARIO
Maturity Type : Limit Maturity
Maturity Date : 2044-10-10
Maturity Price : 21.01
Evaluated at bid price : 21.01
Bid-YTW : 3.73 %
FTS.PR.H FixedReset -1.55 % YTW SCENARIO
Maturity Type : Limit Maturity
Maturity Date : 2044-10-10
Maturity Price : 20.28
Evaluated at bid price : 20.28
Bid-YTW : 3.73 %
MFC.PR.F FixedReset -1.47 % YTW SCENARIO
Maturity Type : Hard Maturity
Maturity Date : 2025-01-31
Maturity Price : 25.00
Evaluated at bid price : 22.05
Bid-YTW : 4.65 %
BAM.PR.E Ratchet 1.67 % YTW SCENARIO
Maturity Type : Limit Maturity
Maturity Date : 2044-10-10
Maturity Price : 23.89
Evaluated at bid price : 24.30
Bid-YTW : 3.07 %
Volume Highlights
Issue Index Shares
Traded
Notes
NA.PR.W FixedReset 185,568 Recent new issue.
YTW SCENARIO
Maturity Type : Limit Maturity
Maturity Date : 2044-10-10
Maturity Price : 23.05
Evaluated at bid price : 24.73
Bid-YTW : 3.73 %
MFC.PR.M FixedReset 94,096 Scotia crossed 67,000 at 25.23.
YTW SCENARIO
Maturity Type : Call
Maturity Date : 2019-12-19
Maturity Price : 25.00
Evaluated at bid price : 25.25
Bid-YTW : 3.83 %
TD.PF.A FixedReset 75,330 Nesbitt crossed 67,200 at 25.10.
YTW SCENARIO
Maturity Type : Limit Maturity
Maturity Date : 2044-10-10
Maturity Price : 23.19
Evaluated at bid price : 25.11
Bid-YTW : 3.63 %
BAM.PF.G FixedReset 62,600 Recent new issue.
YTW SCENARIO
Maturity Type : Limit Maturity
Maturity Date : 2044-10-10
Maturity Price : 23.14
Evaluated at bid price : 25.05
Bid-YTW : 4.28 %
TD.PF.B FixedReset 58,643 RBC crossed 25,000 at 25.05; Scotia crossed 20,000 at the same price.
YTW SCENARIO
Maturity Type : Limit Maturity
Maturity Date : 2044-10-10
Maturity Price : 23.19
Evaluated at bid price : 25.04
Bid-YTW : 3.65 %
GWO.PR.N FixedReset 42,509 Nesbitt crossed 35,000 at 21.82.
YTW SCENARIO
Maturity Type : Hard Maturity
Maturity Date : 2025-01-31
Maturity Price : 25.00
Evaluated at bid price : 21.77
Bid-YTW : 4.55 %
There were 17 other index-included issues trading in excess of 10,000 shares.
Wide Spread Highlights
Issue Index Quote Data and Yield Notes
MFC.PR.F FixedReset Quote: 22.05 – 22.80
Spot Rate : 0.7500
Average : 0.4689

YTW SCENARIO
Maturity Type : Hard Maturity
Maturity Date : 2025-01-31
Maturity Price : 25.00
Evaluated at bid price : 22.05
Bid-YTW : 4.65 %

TRP.PR.C FixedReset Quote: 21.01 – 21.35
Spot Rate : 0.3400
Average : 0.2254

YTW SCENARIO
Maturity Type : Limit Maturity
Maturity Date : 2044-10-10
Maturity Price : 21.01
Evaluated at bid price : 21.01
Bid-YTW : 3.73 %

IGM.PR.B Perpetual-Premium Quote: 25.80 – 26.21
Spot Rate : 0.4100
Average : 0.3157

YTW SCENARIO
Maturity Type : Call
Maturity Date : 2018-12-31
Maturity Price : 25.00
Evaluated at bid price : 25.80
Bid-YTW : 4.99 %

SLF.PR.B Deemed-Retractible Quote: 23.51 – 23.77
Spot Rate : 0.2600
Average : 0.1796

YTW SCENARIO
Maturity Type : Hard Maturity
Maturity Date : 2025-01-31
Maturity Price : 25.00
Evaluated at bid price : 23.51
Bid-YTW : 5.62 %

CU.PR.G Perpetual-Discount Quote: 22.17 – 22.40
Spot Rate : 0.2300
Average : 0.1581

YTW SCENARIO
Maturity Type : Limit Maturity
Maturity Date : 2044-10-10
Maturity Price : 21.85
Evaluated at bid price : 22.17
Bid-YTW : 5.12 %

SLF.PR.D Deemed-Retractible Quote: 22.04 – 22.28
Spot Rate : 0.2400
Average : 0.1721

YTW SCENARIO
Maturity Type : Hard Maturity
Maturity Date : 2025-01-31
Maturity Price : 25.00
Evaluated at bid price : 22.04
Bid-YTW : 6.06 %

DBRS Withdraws Rating on INE

Friday, October 10th, 2014

DBRS has announced that it:

has today discontinued the Issuer Rating and Preferred Shares rating for Innergex Renewable Energy Inc. (the Company). DBRS notes that this action is unrelated to the credit profile of the Company.

This is an unsolicited rating. This rating was not initiated at the request of the issuer or rated entity and did not include participation by the issuer or any related third party.

DBRS had downgraded the preferreds to Pfd-4(high) in March, 2013.

Innergex has two issues outstanding, INE.PR.A, a FixedReset 5.00%+279 that commenced trading in September 2010 and INE.PR.C, a Straight Perpetual, 5.75%, that commenced trading in December 2012.

The two issues continue to be rated P-3 by S&P.

TLM.PR.A Downgraded to P-3 by S&P

Thursday, October 9th, 2014

Standard & Poor’s has announced:

  • •We expect Talisman Energy Inc.’s operating performance, specifically its production and cost profile, to show limited improvement in the next 18-24 months, constraining any significant cash-flow growth.
  • •At the same time, we expect Talisman to significantly outspend internally generated cash flow through 2015. Even if the company meets its US$2 billion asset sale target in the next 12-18 months, we do not think its credit profile is commensurate with that of its ‘BBB’ rated peers.
  • •As a result, we are lowering our long-term corporate credit and senior unsecured debt ratings on Talisman to ‘BBB-‘ from ‘BBB’.
  • •We are also lowering our global scale rating on its preferred stock to ‘BB’ from ‘BB+’ and its Canada scale rating on the preferred stock to ‘P-3’ from ‘P-3 (High)’.
  • •The stable outlook reflects our view that Talisman’s cash flow from its increasing liquids production combined with any asset sales will allow the company to maintain its funds from operations-to-debt at more than 30% through 2015.

Standard & Poor’s Ratings Services today said it lowered its long-term corporate credit rating on Calgary, Alta.-based Talisman Energy Inc., and its senior unsecured debt rating ‘BBB-‘ from ‘BBB’. At the same time, Standard & Poor’s lowered its global scale rating on its preferred stock to ‘BB’ from ‘BB+’ and its Canada scale rating on the stock to ‘P-3’ from ‘P-3 (High)’. Standard & Poor’s also affirmed its ‘A-3’ short-term and commercial paper ratings on Talisman. The outlook is
stable.

The stable outlook reflects Standard & Poor’s view that Talisman will continue to focus on improving its high-netback liquids production, focus on operational performance, and maintain balance-sheet strength at current levels. The outlook also reflects our expectation that the company’s FFO-to-net debt will remain in the 30%-40% range.

For us to revise the outlook to positive, we would expect Talisman’s business risk profile to improve substantially — for example, if it were to improve its operating costs in line with those of other higher rated E&P peers and production netbacks sustainably. We may also consider a positive action if we expect the company to improve its FFO-to-net adjusted debt to above 40% due to improving operating performance. Better credit metrics due to significant asset sales alone would not be sufficient for a positive rating action.

If Talisman’s capital expenditures accelerate without a clear path for production growth, such that credit measures rise above 3.0x for debt to EBITDA and fall below 30% for FFO to debt, we would consider a negative rating action. Also, material declines in production, realized commodity prices, or deterioration in operating efficiency could lead to a downgrade.

TLM.PR.A is a FixedReset 4.20%+277, announced 2011-12-5 and closing 2011-12-14 to market disdain. The underwriters needed to slash prices to clear their inventory. It was downgraded to Pfd-3 [Trend Negative] by DBRS last September.

The issue is tracked by HIMIPref™ but relegated to the Scraps index on credit concerns.

Update, 2014-10-14: Talisman has also been downgraded by Moody’s, but they don’t rate the preferreds:

The Baa3 senior unsecured rating reflects Talisman’s sizable reserves, production and valuable other assets, tempered by the execution risks of an ongoing major shift in strategy and capital spending and dividends that outstrip internal cash flow generation. While production has declined due largely to asset sales, we expect modest production growth in 2015 from existing assets given the use of development capital in Southeast Asia, the Eagle Ford and Columbia. However, we expect an overall decline in reserves and production, cash flow, debt and negative free cash flow over the next 12 to 18 months as asset sales take place. When the strategic re-positioning is complete, we believe that Talisman will be positioned as a Baa3-rated company, with internally generated cash flow that can largely fund its negative free cash flow in the North Sea and an asset base that can provide growth opportunities and improvements in Talisman’s very high finding and development costs and very weak leveraged full-cycle ratio.

October 9, 2014

Thursday, October 9th, 2014

The equity jocks are off their meds:

After plunging 1.5 percent on Oct. 7 and rallying almost 1.8 percent yesterday, the Standard & Poor’s 500 Index dropped 2.1 percent at 4 p.m. in New York today, the biggest turnaround in almost three years. As investors weigh the prospect of slower economic growth overseas against the benefit of U.S. interest rates staying near zero, a measure of 10-day volatility has risen to the highest level since April, data compiled by Bloomberg show.

The only phrase that generates more comments on this site than “real estate” is “trailer fees”. So it is with some glee that I report that the trailer fee wars are heating up:

“Trailer fees – the meteor is closer than you think” was the title of a recent note put out by Mr. Sedran and Mr. Holden [of CIBC]. The meteor in question is a ban on trailer fees.

“Regulators are studying the impact of these fees, with the results of those studies and a recommendation expected early 2015. A ban on trailer fees would follow a global trend and would address the regulators’ conflict of interest concerns. We think such a ban is coming, and sooner than many think.”

The story is marred by an inaccuracy:

The big knock against trailer fees is that despite the advisor having a fiduciary duty to put the client in the product that best serves their needs, there is a financial incentive for the advisor to sell the client the fund with the highest trailer fee – a glaring conflict of interest.

… but we may see a lot of “portfolio managers” without track records:

Mr. Sedran and Mr. Holden say the industry will likely transition to a model where advisors would be paid for managing a client’s entire portfolio, similar to how financial planners are paid today. Furthermore, under such a model, the advisor’s compensation would be tied to whether their client’s portfolio appreciates in value. The implication is that it will also be in the advisor’s interest to put clients into the funds they believe will perform the best over time.

The so-called implication is laughable – it will continue to be a lot easier for salesmen to get a fresh $1,000 into the account from the client than it is to outperform by 1% on a $100,000 portfolio. But people like to dream.

There’s a laugh line:

The bigger players, such as the Canadian banks who already have vast mutual fund sales forces in branches, should be able to manage the transition just fine, according to Mr. Sedran and Mr. Holden.

Well, of course. If it hurt the banks, their future employees at the regulatory agencies wouldn’t dream of the idea. I remain interested in the regulatory agencies views on new issue commissions and proxy solicitation fees – which are functionally equivalent to trailer fees – but the silence continues.

I have often remarked at the superiority of US institutions over their Canadian counterparts with respect to transparency. It is very useful to gain insight into the policy-setting process by reviewing the countervailing arguments within the various committees – but, of course, there are always some who would prefer a two-line press release:

Joseph LaVorgna, chief U.S. economist at Deutsche Bank AG in New York, said officials risk sowing confusion.

“It’s hard to have a unifying message when you have this many people who feel it’s incumbent on them to tell you what the Fed is thinking,” he said.

“I wish the Fed would answer generalities with generalities,” he said. “When they try to quantify, that’s when the problems come up.”

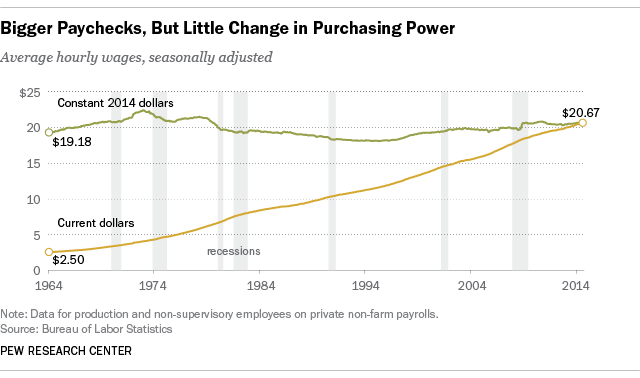
There’s some more information from Pew Research regarding stagnant wages:

Following the better-than-expected September jobs report, several economic analyses have pointed out the continuing lack of meaningful wage growth, even as tens of thousands of people head back to work. Economic theory, after all, predicts that as labor markets tighten, employers will offer higher wages to entice workers their way.

But a look at five decades’ worth of government wage data suggests that the better question might be, why should now be any different? For most U.S. workers, real wages — that is, after inflation is taken into account — have been flat or even falling for decades, regardless of whether the economy has been adding or subtracting jobs.

Cash money isn’t the only way workers are compensated, of course — health insurance, retirement-account contributions, education and transit subsidies and other benefits all can be part of the package. But wages and salaries are the biggest (about 70%, according to the Bureau of Labor Statistics) and most visible component of employee compensation.

But after adjusting for inflation, today’s average hourly wage has just about the same purchasing power as it did in 1979, following a long slide in the 1980s and early 1990s and bumpy, inconsistent growth since then. In fact, in real terms the average wage peaked more than 40 years ago: The $4.03-an-hour rate recorded in January 1973 has the same purchasing power as $22.41 would today.

A similar measure, “usual weekly earnings” of employed, full-time, wage and salary workers, tells much the same story, albeit over a shorter time period. In seasonally adjusted current dollars, median usual weekly earnings rose from $232 in the first quarter 0f 1979 (when the series began) to $782 in the second quarter of this year (the most recent data available). But in real terms, the median has barely budged over that period.

Wage_stagnation
Click for Big

But amidst all the gloom and doom, there’s some good news:

Prince Edward Island has joined Ottawa’s move to create a national securities regulator, bringing the total to five provinces who have signed onto the plan.

The federal Finance Department said Thursday the province has signed a memorandum of agreement to join the Co-operative Capital Markets Regulatory System.

The addition of P.E.I. follows a decision in July by Saskatchewan and New Brunswick to join B.C., Ontario and the federal government in establishing a national regulator.

I have said for a long, long time that piecemeal cooperation is better than none and much more attainable than the single-regulator pipedream. Mind you, I think the commentary we occasionally see regarding the wonderfulness of a national-mostly regulator is highly overwrought. All that will happen is that some unnecessarily duplicated paperwork will be eliminated. But that’s good reason enough.

It was a poor day for the Canadian preferred share market, with PerpetualDiscounts down 12bp, FixedResets losing 13bp and DeemedRetractibles off 8bp. Volatility was average and balanced, but comprised entirely of FixedResets. Volume was on the low side of average.

HIMIPref™ Preferred Indices
These values reflect the December 2008 revision of the HIMIPref™ Indices

Values are provisional and are finalized monthly
Index Mean
Current
Yield
(at bid)
Median
YTW
Median
Average
Trading
Value
Median
Mod Dur
(YTW)
Issues Day’s Perf. Index Value
Ratchet 3.14 % 3.13 % 23,337 19.41 1 -0.4167 % 2,660.4
FixedFloater 0.00 % 0.00 % 0 0.00 0 -0.5950 % 4,074.6
Floater 2.92 % 3.09 % 62,765 19.52 4 -0.5950 % 2,735.9
OpRet 4.04 % 0.98 % 110,907 0.08 1 0.0789 % 2,734.6
SplitShare 4.29 % 4.00 % 89,024 3.85 5 -0.1361 % 3,151.9
Interest-Bearing 0.00 % 0.00 % 0 0.00 0 0.0789 % 2,500.5
Perpetual-Premium 5.50 % 1.69 % 77,694 0.08 18 -0.1687 % 2,449.8
Perpetual-Discount 5.33 % 5.14 % 96,578 15.08 18 -0.1218 % 2,589.3
FixedReset 4.22 % 3.74 % 169,967 16.37 75 -0.1278 % 2,549.6
Deemed-Retractible 5.03 % 2.13 % 104,351 0.37 42 -0.0764 % 2,559.5
FloatingReset 2.57 % -2.37 % 79,699 0.08 6 0.1436 % 2,552.5
Performance Highlights
Issue Index Change Notes
FTS.PR.H FixedReset -1.34 % YTW SCENARIO
Maturity Type : Limit Maturity
Maturity Date : 2044-10-09
Maturity Price : 20.60
Evaluated at bid price : 20.60
Bid-YTW : 3.76 %
FTS.PR.K FixedReset -1.25 % YTW SCENARIO
Maturity Type : Limit Maturity
Maturity Date : 2044-10-09
Maturity Price : 23.01
Evaluated at bid price : 24.45
Bid-YTW : 3.73 %
TRP.PR.B FixedReset 1.26 % YTW SCENARIO
Maturity Type : Limit Maturity
Maturity Date : 2044-10-09
Maturity Price : 19.29
Evaluated at bid price : 19.29
Bid-YTW : 3.77 %
PWF.PR.P FixedReset 1.57 % YTW SCENARIO
Maturity Type : Limit Maturity
Maturity Date : 2044-10-09
Maturity Price : 22.02
Evaluated at bid price : 22.64
Bid-YTW : 3.54 %
Volume Highlights
Issue Index Shares
Traded
Notes
NA.PR.W FixedReset 314,800 Recent new issue.
YTW SCENARIO
Maturity Type : Limit Maturity
Maturity Date : 2044-10-09
Maturity Price : 23.06
Evaluated at bid price : 24.78
Bid-YTW : 3.77 %
NA.PR.M Deemed-Retractible 107,456 Nesbitt crossed 103,900 at 26.30.
YTW SCENARIO
Maturity Type : Call
Maturity Date : 2014-11-08
Maturity Price : 25.75
Evaluated at bid price : 26.30
Bid-YTW : -25.34 %
BAM.PF.G FixedReset 88,955 Recent new issue.
YTW SCENARIO
Maturity Type : Limit Maturity
Maturity Date : 2044-10-09
Maturity Price : 23.12
Evaluated at bid price : 25.01
Bid-YTW : 4.34 %
BMO.PR.M FixedReset 82,561 Nesbitt crossed blocks of 51,000 and 31,000, both at 25.44.
YTW SCENARIO
Maturity Type : Call
Maturity Date : 2018-08-25
Maturity Price : 25.00
Evaluated at bid price : 25.37
Bid-YTW : 3.11 %
HSE.PR.A FixedReset 74,704 Nesbitt crossed 65,000 at 22.92.
YTW SCENARIO
Maturity Type : Limit Maturity
Maturity Date : 2044-10-09
Maturity Price : 22.47
Evaluated at bid price : 22.87
Bid-YTW : 3.71 %
BMO.PR.T FixedReset 67,725 Nesbitt crossed 51,000 at 25.34.
YTW SCENARIO
Maturity Type : Limit Maturity
Maturity Date : 2044-10-09
Maturity Price : 23.27
Evaluated at bid price : 25.31
Bid-YTW : 3.73 %
There were 29 other index-included issues trading in excess of 10,000 shares.
Wide Spread Highlights
Issue Index Quote Data and Yield Notes
ENB.PR.B FixedReset Quote: 24.32 – 24.75
Spot Rate : 0.4300
Average : 0.2646

YTW SCENARIO
Maturity Type : Limit Maturity
Maturity Date : 2044-10-09
Maturity Price : 23.18
Evaluated at bid price : 24.32
Bid-YTW : 4.06 %

IGM.PR.B Perpetual-Premium Quote: 25.90 – 26.21
Spot Rate : 0.3100
Average : 0.2124

YTW SCENARIO
Maturity Type : Call
Maturity Date : 2018-12-31
Maturity Price : 25.00
Evaluated at bid price : 25.90
Bid-YTW : 4.89 %

FTS.PR.K FixedReset Quote: 24.45 – 24.79
Spot Rate : 0.3400
Average : 0.2440

YTW SCENARIO
Maturity Type : Limit Maturity
Maturity Date : 2044-10-09
Maturity Price : 23.01
Evaluated at bid price : 24.45
Bid-YTW : 3.73 %

FTS.PR.F Perpetual-Discount Quote: 23.75 – 23.99
Spot Rate : 0.2400
Average : 0.1613

YTW SCENARIO
Maturity Type : Limit Maturity
Maturity Date : 2044-10-09
Maturity Price : 23.50
Evaluated at bid price : 23.75
Bid-YTW : 5.21 %

CU.PR.D Perpetual-Discount Quote: 24.02 – 24.19
Spot Rate : 0.1700
Average : 0.1100

YTW SCENARIO
Maturity Type : Limit Maturity
Maturity Date : 2044-10-09
Maturity Price : 23.64
Evaluated at bid price : 24.02
Bid-YTW : 5.14 %

BAM.PR.B Floater Quote: 17.04 – 17.20
Spot Rate : 0.1600
Average : 0.1035

YTW SCENARIO
Maturity Type : Limit Maturity
Maturity Date : 2044-10-09
Maturity Price : 17.04
Evaluated at bid price : 17.04
Bid-YTW : 3.10 %

NA.PR.W Soft On Unimpressive Volume

Thursday, October 9th, 2014

National Bank of Canada has announced:

that it has closed its domestic public offering of non-cumulative 5-year rate reset first preferred shares series 32 (the “Series 32 Preferred Shares”). National Bank issued 12 million Series 32 Preferred Shares at a price of $25.00 per share to raise gross proceeds of $300 million.

The offering was underwritten by a syndicate led by National Bank Financial Inc.

The Series 32 Preferred Shares will commence trading on the Toronto Stock Exchange today under the ticker symbol NA.PR.W.

The Series 32 Preferred Shares were issued under a prospectus supplement dated October 2, 2014 to National Bank’s short form base shelf prospectus dated October 5, 2012.

NA.PR.W will be tracked by HIMIPref™. It is still rated Pfd-2(low) by DBRS, as confirmed on July 7, so despite being considered junk by S&P, it will be added to the FixedResets subindex.

The issue traded 740,000 shares today (consolidated exchanges) in a range of 24.76-97 before closing at 24.78-82, 1×12. Vital statistics are:

NA.PR.W FixedReset YTW SCENARIO
Maturity Type : Limit Maturity
Maturity Date : 2044-10-09
Maturity Price : 23.06
Evaluated at bid price : 24.78
Bid-YTW : 3.77 %

Update, 2014-10-11: NA.PR.W is a FixedReset, 3.90%+225, announced September 30.

October 8, 2014

Thursday, October 9th, 2014

Russia is intervening in the currency markets:

Russia’s central bank sold $420 million of foreign currency in its third day of interventions this month to slow the ruble’s world-beating decline.

The monetary authority spent the funds on Oct. 6 to shore up the ruble, the latest data on its website showed today. The bank also said it shifted the upper boundary of the currency’s trading band by 5 kopeks yesterday. The exchange rate was little changed at 44.6979 versus the dollar-euro basket as of 10:12 a.m. in Moscow today.

Bank of Russia will probably need to spend as much as $30 billion by year-end to slow the decline in the ruble, which lost 14 percent against the dollar last quarter, according to UralSib Capital.

Demand for dollars and euros is growing among Russian companies as they contend with $54.7 billion of debt repayments in the next three months, according to central bank data.

A little bird asked me to comment on a paper by Pablo Fernandez of University of Navarra – IESE Business School titled CAPM: An Absurd Model:

The CAPM is an absurd (having no rational or orderly relationship to human life; contrary to all reason or common sense) model because its assumptions and its predictions/conclusions have no basis in the real world. The use of CAPM is also a source of litigation: many professors, lawyers… get nice fees because many professionals use CAPM instead of common sense to calculate the required return to equity. Users of the CAPM make many illogical errors valuing companies, accepting/rejecting investment projects, evaluating fund performance, pricing goods and services in regulated markets, calculating value creation…

According to the dictionary, a theory is “an idea or set of ideas that is intended to explain facts or events”; and a model is “a set of ideas and numbers that describe the past, present, or future state of something”. With the vast amount of information and research that we have, it is quite clear that the CAPM is neither a theory nor a model because it does not “explain facts or events”, nor does it “describe the past, present, or future state of something”.

It is important to differentiate between a fact (something that truly exists or happens: something that has actual existence; a true piece of information) and an opinion (what someone thinks about a particular thing). The CAPM could be described as an uninformed opinion, and not as a sensible opinion.

We all should try to explain a portion of “the world as it is”, not of “the world according to a wrong theory” nor of “the world if men were not men”. Ricardo Yepes, professor of philosophy of my university, wrote: “Learning means being able to keep perceiving reality as it truly is: complex – and not trying to fit every new experience into a closed and pre-conceived notion or overall scheme”. We may find out an investor’s expected IBM beta and expected market risk premium (MRP) by asking him. However, it is impossible to determine the expected IBM beta and the expected MRP of the market (for the market as a whole), because these two parameters do not exist. Different investors have different cash flow expectations and use different expected (and required) returns to equity (different expected market risk premium and different expected beta). One could only talk of the beta and the market risk premium if all investors had the same expectations. But investors do not have homogeneous expectations.

Sections 11 and 12 show how to calculate required returns in a sensible way and how to use betas being a reasonable person.

Just an example: calculation of the beta of electrical companies done by a European Electricity Regulatory Commission. “We calculate the betas of all traded European companies. Leveraged betas were calculated using 2 years of weekly data. The Market Index chosen was the Dow Jones STOXX Total Market Index. There is a great dispersion (from -0.24 to 1.16) and some odd betas (negative and higher than one). We decided to maintain all betas… To unlever the betas, we assumed that the beta of the debt is zero for all companies. Then, the Commission calculates the average of the unlevered betas and relever it using an objective debt to equity ratio based on the average debt to equity ratio of comparable companies. The levered beta proposed by the Commission for the transport activity is 0.471870073”

The Commission acknowledges that calculated betas have a “great dispersion (from -0.24 to 1.16)” but calculates the average of all of them and finally provides betas with a precision of 9 figures after the decimal point!

According with the CAPM “the market” assigns a beta to every company and that beta may be calculated with a regression of historical data. Of course, every investor should use this “market beta”. As we have already mentioned, the first problem is that this “market beta” does not exist.

When we calculate betas using historical data we encounter several well-known problems:
1. They change considerably from one day to the next.
2. They depend very much on which stock index is used as the market reference.
3. They depend very much on the historical period (5 years, 3 years…) used.
4. They depend on what returns (monthly, yearly…) are used to calculate them.
5. Very often we do not know if the beta of one company is lower or higher than the beta of another.
6. Calculated betas have little correlation with stock returns.
7. β = 1 has a higher correlation with stock returns than calculated betas for many companies
8. The correlation coefficients of the regressions used to calculate the betas are very small.
9. The relative magnitude of betas often makes very little sense: companies with high risk often have lower calculated betas than companies with lower risk.

It was a mixed day for the Canadian preferred share market, with PerpetualDiscounts gaining 1bp, FixedResets off 7bp and DeemedRetractibles down 8bp. Volatility was low (Floaters don’t count!). Volume was low.

PerpetualDiscounts now yield 5.16%, equivalent to 6.71% interest at the standard equivalency factor of 1.3x. Long corporates are now at about 4.2%, so the pre-tax interest-equivalent spread (in this context, the “Seniority Spread”) is now about 250bp, a widening from the 240bp reported September 10.

HIMIPref™ Preferred Indices
These values reflect the December 2008 revision of the HIMIPref™ Indices

Values are provisional and are finalized monthly
Index Mean
Current
Yield
(at bid)
Median
YTW
Median
Average
Trading
Value
Median
Mod Dur
(YTW)
Issues Day’s Perf. Index Value
Ratchet 3.13 % 3.12 % 23,525 19.44 1 -0.2079 % 2,671.5
FixedFloater 0.00 % 0.00 % 0 0.00 0 -0.7553 % 4,099.0
Floater 2.91 % 3.07 % 62,551 19.58 4 -0.7553 % 2,752.3
OpRet 4.04 % 1.81 % 111,987 0.08 1 0.0000 % 2,732.5
SplitShare 4.29 % 4.00 % 89,954 3.85 5 0.1193 % 3,156.2
Interest-Bearing 0.00 % 0.00 % 0 0.00 0 0.0000 % 2,498.6
Perpetual-Premium 5.49 % 0.07 % 78,136 0.08 18 0.0937 % 2,453.9
Perpetual-Discount 5.32 % 5.16 % 95,861 15.14 18 0.0142 % 2,592.5
FixedReset 4.22 % 3.73 % 168,986 16.36 74 -0.0741 % 2,552.8
Deemed-Retractible 5.02 % 2.33 % 101,409 0.23 42 -0.0831 % 2,561.5
FloatingReset 2.58 % -4.24 % 79,206 0.08 6 -0.1890 % 2,548.8
Performance Highlights
Issue Index Change Notes
PWF.PR.P FixedReset -1.89 % YTW SCENARIO
Maturity Type : Limit Maturity
Maturity Date : 2044-10-08
Maturity Price : 21.80
Evaluated at bid price : 22.29
Bid-YTW : 3.61 %
BAM.PR.B Floater -1.32 % YTW SCENARIO
Maturity Type : Limit Maturity
Maturity Date : 2044-10-08
Maturity Price : 17.17
Evaluated at bid price : 17.17
Bid-YTW : 3.07 %
BAM.PR.K Floater -1.04 % YTW SCENARIO
Maturity Type : Limit Maturity
Maturity Date : 2044-10-08
Maturity Price : 17.14
Evaluated at bid price : 17.14
Bid-YTW : 3.08 %
TRP.PR.B FixedReset -1.04 % YTW SCENARIO
Maturity Type : Limit Maturity
Maturity Date : 2044-10-08
Maturity Price : 19.05
Evaluated at bid price : 19.05
Bid-YTW : 3.82 %
Volume Highlights
Issue Index Shares
Traded
Notes
BAM.PF.G FixedReset 740,320 New issue settled today.
YTW SCENARIO
Maturity Type : Limit Maturity
Maturity Date : 2044-10-08
Maturity Price : 23.12
Evaluated at bid price : 25.00
Bid-YTW : 4.34 %
FTS.PR.M FixedReset 93,750 Recent new issue.
YTW SCENARIO
Maturity Type : Limit Maturity
Maturity Date : 2044-10-08
Maturity Price : 23.18
Evaluated at bid price : 25.10
Bid-YTW : 3.95 %
BMO.PR.S FixedReset 78,090 RBC crossed 75,000 at 25.39.
YTW SCENARIO
Maturity Type : Call
Maturity Date : 2019-05-25
Maturity Price : 25.00
Evaluated at bid price : 25.40
Bid-YTW : 3.75 %
MFC.PR.K FixedReset 70,460 RBC crossed 63,900 at 25.02.
YTW SCENARIO
Maturity Type : Hard Maturity
Maturity Date : 2025-01-31
Maturity Price : 25.00
Evaluated at bid price : 25.01
Bid-YTW : 3.84 %
MFC.PR.H FixedReset 64,790 RBC crossed 60,100 at 26.16.
YTW SCENARIO
Maturity Type : Call
Maturity Date : 2017-03-19
Maturity Price : 25.00
Evaluated at bid price : 26.14
Bid-YTW : 2.77 %
RY.PR.H FixedReset 61,010 RBC crossed 50,000 at 25.35.
YTW SCENARIO
Maturity Type : Limit Maturity
Maturity Date : 2044-10-08
Maturity Price : 23.29
Evaluated at bid price : 25.36
Bid-YTW : 3.69 %
There were 23 other index-included issues trading in excess of 10,000 shares.
Wide Spread Highlights
Issue Index Quote Data and Yield Notes
CIU.PR.C FixedReset Quote: 20.39 – 21.24
Spot Rate : 0.8500
Average : 0.7318

YTW SCENARIO
Maturity Type : Limit Maturity
Maturity Date : 2044-10-08
Maturity Price : 20.39
Evaluated at bid price : 20.39
Bid-YTW : 3.73 %

TRP.PR.B FixedReset Quote: 19.05 – 19.39
Spot Rate : 0.3400
Average : 0.2411

YTW SCENARIO
Maturity Type : Limit Maturity
Maturity Date : 2044-10-08
Maturity Price : 19.05
Evaluated at bid price : 19.05
Bid-YTW : 3.82 %

MFC.PR.B Deemed-Retractible Quote: 22.92 – 23.20
Spot Rate : 0.2800
Average : 0.1816

YTW SCENARIO
Maturity Type : Hard Maturity
Maturity Date : 2025-01-31
Maturity Price : 25.00
Evaluated at bid price : 22.92
Bid-YTW : 5.80 %

CU.PR.F Perpetual-Discount Quote: 22.15 – 22.34
Spot Rate : 0.1900
Average : 0.1302

YTW SCENARIO
Maturity Type : Limit Maturity
Maturity Date : 2044-10-08
Maturity Price : 21.84
Evaluated at bid price : 22.15
Bid-YTW : 5.13 %

BAM.PR.K Floater Quote: 17.14 – 17.30
Spot Rate : 0.1600
Average : 0.1022

YTW SCENARIO
Maturity Type : Limit Maturity
Maturity Date : 2044-10-08
Maturity Price : 17.14
Evaluated at bid price : 17.14
Bid-YTW : 3.08 %

NA.PR.M Deemed-Retractible Quote: 26.36 – 26.53
Spot Rate : 0.1700
Average : 0.1138

YTW SCENARIO
Maturity Type : Call
Maturity Date : 2014-11-07
Maturity Price : 25.75
Evaluated at bid price : 26.36
Bid-YTW : -27.91 %

BAM.PF.G Firm on Good Volume

Thursday, October 9th, 2014

Brookfield Asset Management Inc. has announced:

the completion of its previously announced Class A Preference Shares, Series 42 issue in the amount of C$300,000,000. The offering was underwritten by a syndicate led by TD Securities Inc., RBC Capital Markets, CIBC and Scotiabank.

Brookfield issued 12,000,000 Series 42 Shares at a price of C$25.00 per share, for total gross proceeds of C$300,000,000. Holders of the Series 42 Shares will be entitled to receive a cumulative quarterly fixed dividend yielding 4.50% annually for the initial period ending June 30, 2020. Thereafter, the dividend rate will be reset every five years at a rate equal to the 5-year Government of Canada bond yield plus 2.84%. The Series 42 Shares will commence trading on the Toronto Stock Exchange this morning under the ticker symbol BAM.PF.G.

BAM.PF.G is a FixedReset, 4.50%+284, announced October 1. It will be tracked by HIMIPref™ and has been assigned to the FixedResets subindex.

The issue traded 1,056,420 shares today (consolidated exchanges) in a range of 24.95-05 before closing at what TMX Money claims to be a locked market at 25.00, 6×10, with the bid on the TSX and the offer on Pure. Vital statistics are:

BAM.PF.G FixedReset YTW SCENARIO
Maturity Type : Limit Maturity
Maturity Date : 2044-10-08
Maturity Price : 23.12
Evaluated at bid price : 25.00
Bid-YTW : 4.34 %

The Implied Volatility calculation for the BAM FixedResets is interesting, partly because of the very high level of Implied Volatility, but mainly because it highlights a huge gap that has opened up between BAM.PR.R (FixedReset 5.40%+230, commenced trading January, 2010) and BAM.PR.T (FixedReset 4.50%+231, commenced trading October, 2010). These are now bid at 25.4 and 24.55, respectively, despite having virtually identical Issue Reset Spreads. The next Exchange Dates for these issues differ by only nine months, which is really to short a time to introduce complicated arguments about the expected path of interest rates which would be wrong anyway. There should be some pricing difference due to the difference in the dividends currently paid, but the BAM.PR.R has only 7 payments to go until reset – the total dividend advantage is just under forty cents; one might reasonably expect the price difference to be a little under forty cents (given discounting of the dividend stream and the effect of price on post-reset expected dividend yield). But it ain’t.

ImpVol_BAM_FR_141008

October 7, 2014

Tuesday, October 7th, 2014

Europe isn’t looking very good:

U.K. 10-year government bonds rose with their German counterparts as a report showed factory orders in Europe’s largest economy plunged the most since 2009 in August, underlining risks to the euro area’s recovery.

Five-year gilts advanced for the fifth time in six days. The yield fell last week to the lowest level since February as reports signaled the U.K. economy was losing momentum, fueling speculation the Bank of England will delay interest-rate increases. The pound declined versus the euro as Business Secretary Vince Cable said Britain’s currency was still too strong and stifling exports.

U.K. house prices fell for the first time in almost a year and a half in September, Nationwide Building Society said on Sept. 30, while a Markit Economics report on Oct. 3 showed services growth cooled more than economists forecast, further signs that the recovery may be losing enough momentum for the Bank of England to refrain from increasing borrowing costs. That has fueled gains in government bonds and slowed the rally in the pound.

and there are renewed deflation fears:

Inflation in the euro area has fallen yet again and now stands at 0.3 percent. Prices are already falling in several of the European Union’s weaker economies. Even so-called core inflation, which excludes temporary factors and reveals the underlying trend, stands at less than 1 percent, a full percentage point below the ECB’s target.

… which is causing some to criticize Draghi and the ECB:

European Central Bank President Mario Draghi has disappointed investors and economists by failing to detail the size of the expansion he’s seeking in the central bank’s balance sheet. This much is clear from today’s investment bank research reports. Parsing Draghi’s comments from yesterday, as his favorite inflation measure fell to a record today, raises the chilling prospect that it may already be too late to avert deflation in the euro region — and that he knows it.

For the first time, Draghi has abandoned the incantation he’s used for months against the perceived evils of falling prices: “Inflation expectations for the euro area over the medium to long term continue to be firmly anchored.” That’s how he put it in his opening remarks at the August monetary policy press conference, and then followed it up, at the question-and-answer session, with, “Long-term expectations remain anchored at 2 percent.”

Yesterday, in addition to dropping the mantra from his speech, Draghi also demurred when he was directly asked if he thought inflationary expectations were anchored:

Well, first of all, the inflation expectations — first of all, we don’t use — let me get this clear, because there has been a certain amount of misunderstanding in the last few weeks — we don’t use one single measure of inflation expectations. We use a broad range of indicators. And our inflation expectations measures have gone down especially on the short horizons and are now around 8 points below 2 percent on the five-year on five-year, and so we look at that with — definitely with great attention. I would say that the measures we’ve taken have been determined exactly because our medium-term outlook on inflation expectation has worsened and we see that the risks have increased.

Lena Komileva, the chief economist at G Plus Economics in London, a research company, interpreted the absence as a sign the ECB is aware that the euro region risks what she calls “Japanification.” Annual inflation was just 0.3 percent last month; it hasn’t touched 2 percent since January 2013.

All this gloom had an effect:

Stocks tumbled and bonds rallied, sending yields to the lowest since May 2013, as the International Monetary Fund cut its global outlook and German industrial production plunged. Oil slid to a 17-month low.

The Standard & Poor’s 500 Index (SPX) fell 1.5 percent to 1,935.10 at 4 p.m. in New York, the lowest level since Aug. 12. The Dow Jones Industrial Average lost 1.6 percent, the most since July. The yield on 30-year Treasuries retreated 8 basis points to 3.05 percent as investors sought safety. Oil tumbled 1.7 percent to the lowest since April 2013, while gold futures climbed 0.4 percent. Volatility rose, with the VIX jumping to the highest since March.

The IMF cut its outlook for global growth in 2015 and warned about the risks of rising geopolitical tensions and a financial-market correction as stocks reach “frothy” levels. German industrial production dropped 4 percent in August in the biggest decline since 2009.

With Hallowe’en fast approaching, I would be remiss if I didn’t alert Assiduous Readers to the BEST PRANK EVER:

A lewd statue of the devil that seemingly popped up overnight in East Vancouver has been taken down by city officials after raising eyebrows — among other things.

The statue stood about eight to nine feet tall on a pedestal near the intersection of 4th Avenue and Clark Drive for several hours Tuesday.

It was removed by city crews at around 3:15 p.m.

The statue also appeared to sport a full erection, a detail that likely raised hell with some of the commuters who use the station.

satanStatue
Click for … um … big

It was a positive day for the Canadian preferred share market, with PerpetualDiscounts winning 18bp, FixedResets gaining 1bp and DeemedRetractibles up 2bp. Volatility was minimal. Volume was low.

HIMIPref™ Preferred Indices
These values reflect the December 2008 revision of the HIMIPref™ Indices

Values are provisional and are finalized monthly
Index Mean
Current
Yield
(at bid)
Median
YTW
Median
Average
Trading
Value
Median
Mod Dur
(YTW)
Issues Day’s Perf. Index Value
Ratchet 3.12 % 3.11 % 24,499 19.46 1 0.0416 % 2,677.1
FixedFloater 0.00 % 0.00 % 0 0.00 0 0.1513 % 4,130.2
Floater 2.88 % 3.03 % 58,295 19.68 4 0.1513 % 2,773.3
OpRet 4.04 % 1.67 % 116,196 0.08 1 -0.0788 % 2,732.5
SplitShare 4.29 % 4.03 % 91,336 3.85 5 0.2738 % 3,152.4
Interest-Bearing 0.00 % 0.00 % 0 0.00 0 -0.0788 % 2,498.6
Perpetual-Premium 5.46 % 2.11 % 78,060 0.08 18 0.1157 % 2,451.6
Perpetual-Discount 5.31 % 5.15 % 96,080 15.12 18 0.1817 % 2,592.1
FixedReset 4.21 % 3.73 % 171,024 16.38 73 0.0061 % 2,554.7
Deemed-Retractible 5.01 % 2.10 % 102,459 0.23 42 0.0200 % 2,563.6
FloatingReset 2.57 % -6.56 % 65,011 0.08 6 -0.0261 % 2,553.6
Performance Highlights
Issue Index Change Notes
PWF.PR.R Perpetual-Premium 1.43 % YTW SCENARIO
Maturity Type : Call
Maturity Date : 2021-04-30
Maturity Price : 25.00
Evaluated at bid price : 26.31
Bid-YTW : 4.77 %
Volume Highlights
Issue Index Shares
Traded
Notes
SLF.PR.E Deemed-Retractible 108,841 National crossed 78,800 at 22.21.
YTW SCENARIO
Maturity Type : Hard Maturity
Maturity Date : 2025-01-31
Maturity Price : 25.00
Evaluated at bid price : 22.29
Bid-YTW : 5.97 %
MFC.PR.A OpRet 56,550 TD crossed two blocks of 26,000 each, both at 25.39.
YTW SCENARIO
Maturity Type : Call
Maturity Date : 2014-11-06
Maturity Price : 25.25
Evaluated at bid price : 25.35
Bid-YTW : 1.67 %
BMO.PR.W FixedReset 52,939 TD crossed 40,000 at 25.08.
YTW SCENARIO
Maturity Type : Limit Maturity
Maturity Date : 2044-10-07
Maturity Price : 23.18
Evaluated at bid price : 25.08
Bid-YTW : 3.71 %
ENB.PF.G FixedReset 40,120 Recent new issue.
YTW SCENARIO
Maturity Type : Limit Maturity
Maturity Date : 2044-10-07
Maturity Price : 23.11
Evaluated at bid price : 25.00
Bid-YTW : 4.21 %
HSE.PR.A FixedReset 28,350 Nesbitt crossed 25,000 at 22.92.
YTW SCENARIO
Maturity Type : Limit Maturity
Maturity Date : 2044-10-07
Maturity Price : 22.45
Evaluated at bid price : 22.85
Bid-YTW : 3.71 %
FTS.PR.M FixedReset 28,344 Recent new issue.
YTW SCENARIO
Maturity Type : Limit Maturity
Maturity Date : 2044-10-07
Maturity Price : 23.19
Evaluated at bid price : 25.12
Bid-YTW : 3.95 %
There were 19 other index-included issues trading in excess of 10,000 shares.
Wide Spread Highlights
Issue Index Quote Data and Yield Notes
TRP.PR.A FixedReset Quote: 22.35 – 22.65
Spot Rate : 0.3000
Average : 0.1872

YTW SCENARIO
Maturity Type : Limit Maturity
Maturity Date : 2044-10-07
Maturity Price : 21.87
Evaluated at bid price : 22.35
Bid-YTW : 3.92 %

MFC.PR.C Deemed-Retractible Quote: 22.68 – 22.95
Spot Rate : 0.2700
Average : 0.1837

YTW SCENARIO
Maturity Type : Hard Maturity
Maturity Date : 2025-01-31
Maturity Price : 25.00
Evaluated at bid price : 22.68
Bid-YTW : 5.77 %

TD.PR.Q Deemed-Retractible Quote: 25.91 – 26.19
Spot Rate : 0.2800
Average : 0.2001

YTW SCENARIO
Maturity Type : Call
Maturity Date : 2014-11-06
Maturity Price : 25.75
Evaluated at bid price : 25.91
Bid-YTW : -6.35 %

PWF.PR.P FixedReset Quote: 23.00 – 23.22
Spot Rate : 0.2200
Average : 0.1572

YTW SCENARIO
Maturity Type : Limit Maturity
Maturity Date : 2044-10-07
Maturity Price : 22.56
Evaluated at bid price : 23.00
Bid-YTW : 3.56 %

BAM.PF.E FixedReset Quote: 24.51 – 24.78
Spot Rate : 0.2700
Average : 0.2080

YTW SCENARIO
Maturity Type : Limit Maturity
Maturity Date : 2044-10-07
Maturity Price : 22.96
Evaluated at bid price : 24.51
Bid-YTW : 4.21 %

MFC.PR.F FixedReset Quote: 22.41 – 22.79
Spot Rate : 0.3800
Average : 0.3205

YTW SCENARIO
Maturity Type : Hard Maturity
Maturity Date : 2025-01-31
Maturity Price : 25.00
Evaluated at bid price : 22.41
Bid-YTW : 4.52 %