Unintended consequences? Or a simple macro-economic effect on free markets?
When the federal government tightened mortgage rules in 2012, overheated condo markets in Toronto and Vancouver were widely seen as the main target. But little more than two years later, it’s many smaller cities that are bearing the brunt of stricter regulations.
Winnipeg, Montreal and Moncton are grappling with a surplus of unsold condo units driven by a surge in new construction and a dwindling supply of first-time buyers in the wake of Ottawa’s decision in June, 2012, to limit mortgage insurance to amortization periods of 25 years or less from 30 years.
Meanwhile…:
Home loans from $1 million to $5 million were the fastest growing part of the jumbo market in January, according to purchase application data from the Mortgage Bankers Association. Wealthy borrowers are seeking even bigger loans this year while luxury housing prices rise and lenders lure them with competitive terms.
As first-time homebuyers struggle to qualify for mortgages in a market that’s shrinking after the housing collapse, lenders are providing more multi-million dollar loans to Americans who pose less risk. These borrowers are using the loans to purchase high-end homes in cities such as San Francisco and Miami, where prices have been climbing.
Yellen spoke gentle words of dovish restraint in her Humphrey-Hawkins testimony:
The yield on the benchmark note fell below 2 percent for the first time in a week as Yellen repeated in testimony before Congress a pledge to be “patient” means an increase is unlikely for “at least the next couple” of meetings. She said the labor market wasn’t fully healed and that she saw no evidence that inflation was rising toward the central bank’s 2 percent goal.
…
The benchmark 10-year yield fell eight basis points, or 0.08 percentage point, to 1.98 percent at 1:32 p.m. New York time, according to Bloomberg Bond Trader data. It rose as high as 2.10 percent earlier. The price of the 2 percent note maturing in February 2025 rose 22/32, or $6.88 per $1,000 face amount, to 100 6/32.
Treasuries remained higher after the U.S. sold $26 billion of two-year notes at a yield of 0.603 percent as the Fed’s 22 primary dealers were left with their smallest share of the securities in almost a year.
“It is important to emphasize that a modification of the forward guidance should not be read as indicating that the committee will necessarily increase the target range in a couple of meetings,” Yellen said. “We are reasonably confident that inflation will move back to our 2 percent inflation target over time.”
The Fed’s preferred gauge of inflation, the personal consumption expenditures index, has stayed below 2 percent since April 2012, and it rose just 0.7 percent in the year through December.
…
Traders saw a 45 percent chance the Fed will raise the benchmark rate from between zero to 0.25 percent by its September meeting, according to fed funds futures data compiled by Bloomberg. That’s down from 51 percent prior to Tuesday’s testimony.
Meanwhile, it appears that Lapdog Carney has received instructions to undermine capitalism in order to do his electoral duty for the guys that hired him:
Bank of England chief Mark Carney warned employers on Tuesday not to use near-zero inflation as an excuse to offer staff low wage settlements, as that might derail Britain’s economic recovery.
British wages have only recently started to rise faster than inflation after years of real-term falls.
Many firms will agree 2015 wage deals in coming months amid falling inflation and political uncertainty before national elections in May that are likely to be closely fought.
…
Carney said risks from low inflation in Britain related mainly to the labour market, not to deferred consumption as occurred in Japan, where deflation became entrenched.
Other policy makers are more concerned about the risk of inflation overshooting, however.
MPC member Martin Weale told the same parliamentary panel rates could rise sooner than markets expected. They currently price in a first rise in around a year.
Both Weale and fellow policy maker Ian McCafferty voted five times late last year to raise rates, before dropping this call in January in the face of tumbling oil prices.
Another MPC member, Kristin Forbes, said earlier on Tuesday that there could be a case to start raising rates soon due to potential future pressure from wages, financial stability risks or unsustainable borrowing patterns.
“Any could factor into a case to tighten monetary policy in the near future. But they do not currently appear to be generating a sufficient cost to merit a change in interest rates today,” she said.
This “supply and demand” nonsense is so old fashioned, isn’t it?
Speaking of government policy, it seems that Parakeet Poluz wants to be less accountable:
Stephen Poloz says the time has come for the Bank of Canada and other central banks to reinvent monetary policy by moving beyond solely targeting inflation.
Central bankers need do a better job of making sense of a host of new risks buffeting the financial system, such as exchange rate moves and globalized production chains, the Bank of Canada governor said Tuesday.
“We need to develop a monetary policy framework that integrates inflation risks and financial stability risks, both statically and dynamically, and captures much more accurately the uncertainties we face,” he said.
After all, OSFI is given a free ride on incompetence, as long as the whole system doesn’t blow up. Why shouldn’t everybody else?
However, reduced US expectations of tightening were met with reduced Canadian expectations of loosening:
Market participants, however, keyed in on one statement that strongly suggests another rate cut from the central bank is not as imminent as one would have imagined.
“So the downside risk insurance from the interest rate cut buys us some time to see how the economy actually responds,” Mr. Poloz said in his concluding remarks.
The implication of this statement is that the central bank will wait to determine whether more monetary stimulus is required to offset the “unambiguously negative” effect of the decline in oil prices.
Market participants quickly digested this new information and began to bet against a Bank of Canada rate cut next week.
On Monday, the overnight index swap market was pricing in an 82 per cent chance of 25 basis point reduction in the overnight rate to 0.5 per cent on March 4th. This belief was supported by persistently low oil prices and underwhelming economic data. Soon after Mr. Poloz’s remarks were released, the overnight index swaps suggest the consensus view is for the bank to stand pat: the implied odds of a rate cut, as of the close on Tuesday, stand at 42 per cent.
And the feds continue to make taxation more regressive:
Parliamentary Budget Officer Jean-Denis Fréchette says the Conservative government’s plan to double the contribution limit for tax-free savings accounts would cost Ottawa and the provinces billions in revenue.
In a new report released Tuesday, the PBO notes that if the current annual limit of $5,500 is doubled to $11,000, Ottawa would lose $14.7-billion a year in federal revenue by 2060 and the provinces would lose $7.6-billion a year.
The PBO also notes that doubling the contribution rate would primarily benefit well-off Canadians, making the tax break “much more regressive.”
“By 2060, gains for high wealth households project to be twice the median and ten times that of low-wealth households,” the report states.
The PBO report comes on the same day as a similar report from Simon Fraser University Professor Rhys Kesselman, who also noted that while the program’s cost in terms of lost revenue is relatively small for now, it will grow significantly over time.
“Like a little baby who looks cuddly and cute, this proposed initiative would grow up to be the hulking teenager who eats everyone out of house and home,” Dr. Kesselman’s report for the SFU School of Public Policy states.
I have no objections at all to tax expenditures that encourage Canadians to save for a comfortable retirement – that strikes me as being very good political policy. However, I have seen very little discussion of proposed limits in terms of actual outcomes – and no, I’m not so short-sighted and ignorant as to suggest the outcome is ‘saving a few thousand in tax this year’. The actual outcome is measured in terms of the standard of living in retirement; while I am all in favour of programmes that will help Joe Lunchbucket save a bit so he can have total retirement income of $50,000 p.a., I am firmly opposed to tax expenditures that help Edwin Plutocrat III to have total retirement income of $150,000 p.a. But we never see discussion – by which I mean actual evidence and analysis – of the cost effectiveness of this.
Just as an example – and this is not only not an actuarial study, it’s also not an intensively researched post – look at the OTPP contribution limits:
This chart shows the total contributions that will be deducted in 2015 for your Teachers’ pension based on various gross salaries.
| |
Annual contributions |
| Annual salary |
2015* |
2014** |
| $30,000 |
$3,450 |
$3,450 |
| $40,000 |
$4,600 |
$4,600 |
| $50,000 |
$5,750 |
$5,750 |
| $60,000 |
$7,002 |
$7,020 |
| $70,000 |
$8,312 |
$8,330 |
| $80,000 |
$9,622 |
$9,640 |
| $90,000 |
$10,932 |
$10,950 |
| $100,000 |
$12,242 |
$12,260 |
The Ontario government and other employers match total annual member contributions.
So, making the (possibly erroneous) assumption that the contribution rates are intended to maintain the standard of living implied by the related salary, this leads me to conclude that RRSP contribution limits should be about $14,000 p.a.; and that this limit should be adjusted downward to reflect the impact of TSFAs. Why are we taxing Joe Lunchbucket extra in order to assist Edwin Plutocrat III to achieve retirement income far in excess of the average Canadian salary?
However, just so you know … I think that when retirees downsize their home, the cash they take out on the transaction should be eligible (up to limits reflecting the above principles) for rollover to a TSFA. Saving via mortgage payments is still saving!
S&P has given something called the Floating Rate Investment Grade Preferred Fund a rating of P-2f, but I can’t find anything more regarding this new entrant.
There were modest gains in the Canadian preferred share market today, with PerpetualDiscounts gaining 8bp, FixedResets up 9bp and DeemedRetractibles winning 17bp. The Performance Highlights table continues to be lengthy, with ENB FixedResets prominent among the winners. Volume was above average; it is noteworthy that the larger blocks changed hands well below the closing bids.
For as long as the FixedReset market is so violently unsettled, I’ll keep publishing updates of the more interesting and meaningful series of FixedResets’ Implied Volatilities. This doesn’t include Enbridge because although Enbridge has a large number of issues outstanding, all of which are quite liquid, the range of Issue Reset Spreads is too small for decent conclusions. The low is 212bp (ENB.PR.H; second-lowest is ENB.PR.D at 237bp) and the high is a mere 268 for ENB.PF.G.
Remember that all rich /cheap assessments are:
» based on Implied Volatility Theory only
» are relative only to other FixedResets from the same issuer
» assume constant GOC-5 yield
» assume constant Implied Volatility
» assume constant spread
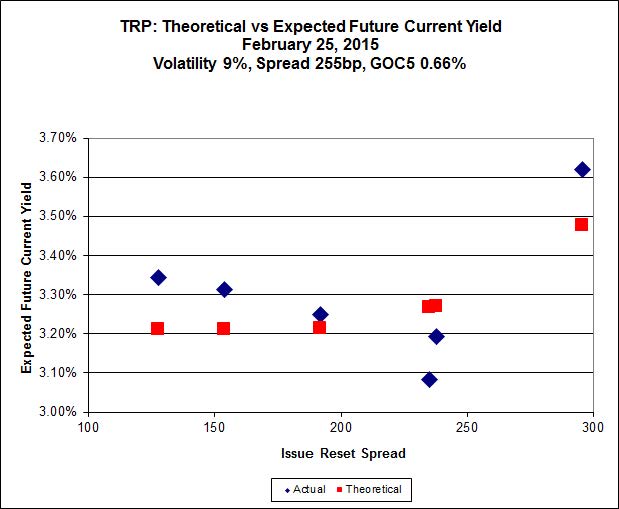
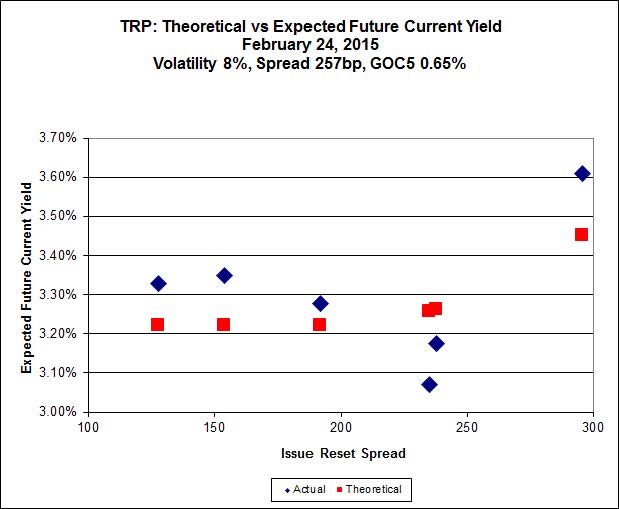
Here’s TRP:
 Click for Big
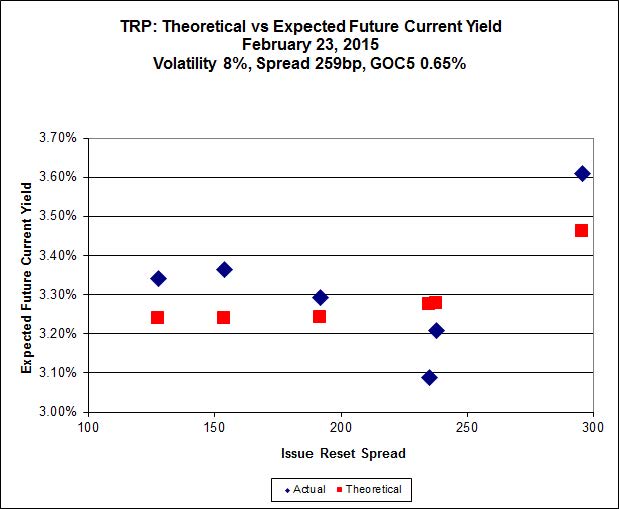
The new issue has caused a large change in the curve-fitting for the TRP series of FixedResets, which is discussed at greater length on the post announcing the new issue. TRP.PR.E, which resets 2019-10-30 at +235, is bid at 24.43 to be $1.40 rich, while the new issue, resetting 2020-11-30 at +296, is $1.15 cheap at its issue price of 25.00.
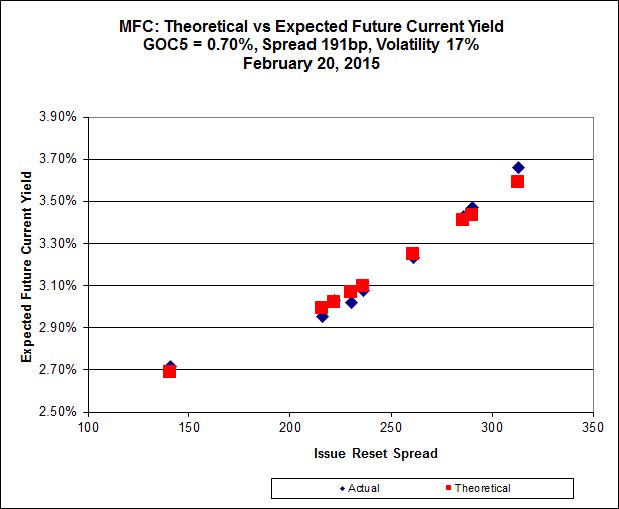
 Click for Big
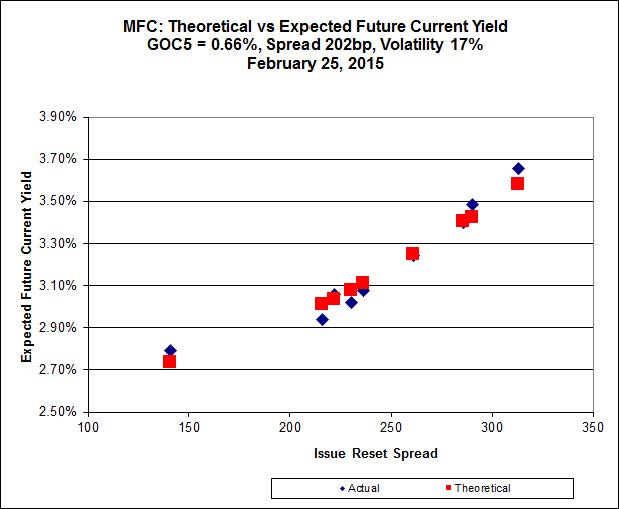
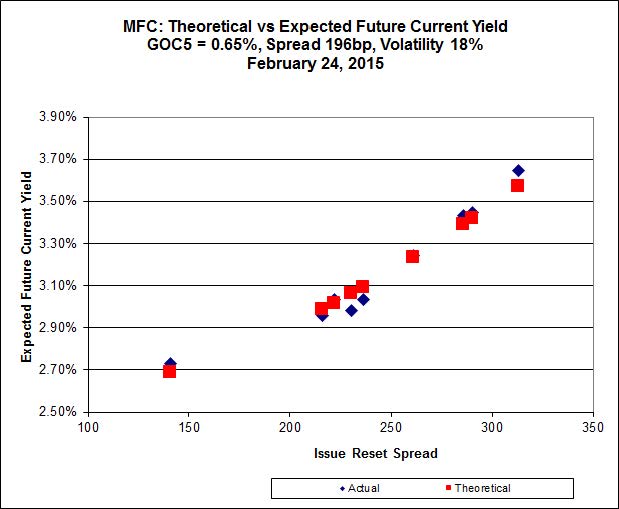
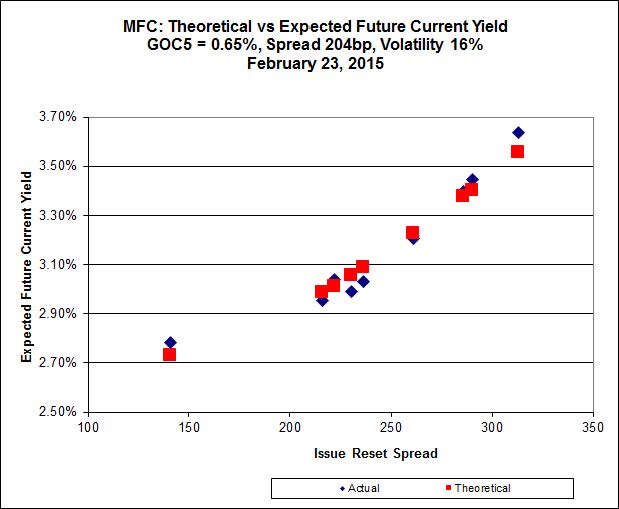
Another excellent fit, but the numbers are perplexing. Implied Volatility for MFC continues to be a conundrum, although it declined substantially today. It is still too high if we consider that NVCC rules will never apply to these issues; it is still too low if we consider them to be NVCC non-compliant issues (and therefore with Deemed Maturities in the call schedule).
Most expensive is MFC.PR.N, resetting at +230 on 2020-3-19, bid at 24.75 to be $0.65 rich, while MFC.PR.H, resetting at +313bp on 2017-3-19, is bid at 25.91 to be $0.57 cheap.
 Click for Big
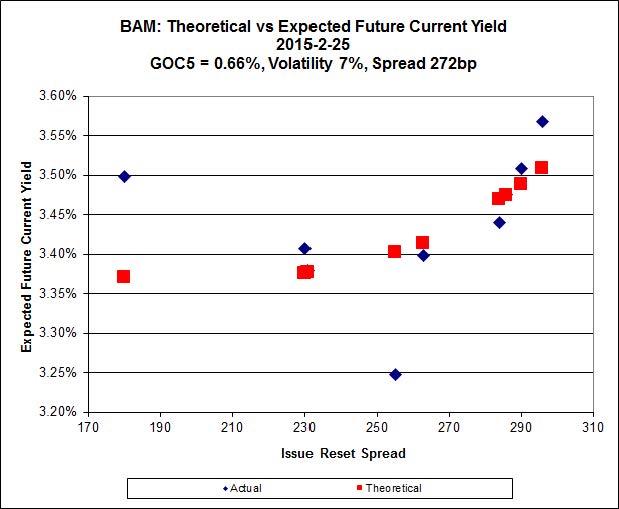
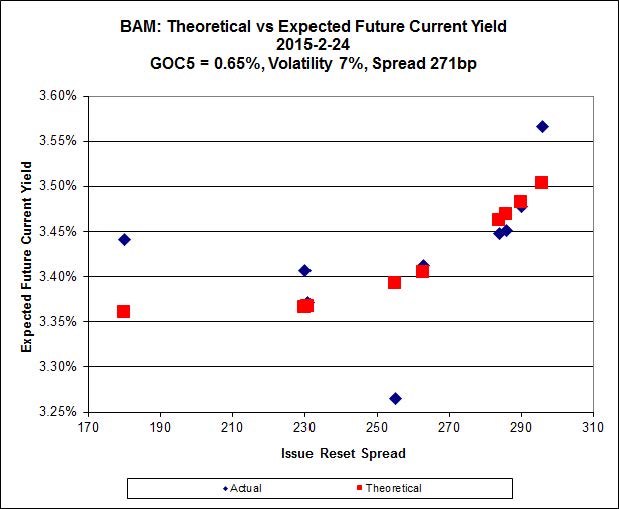
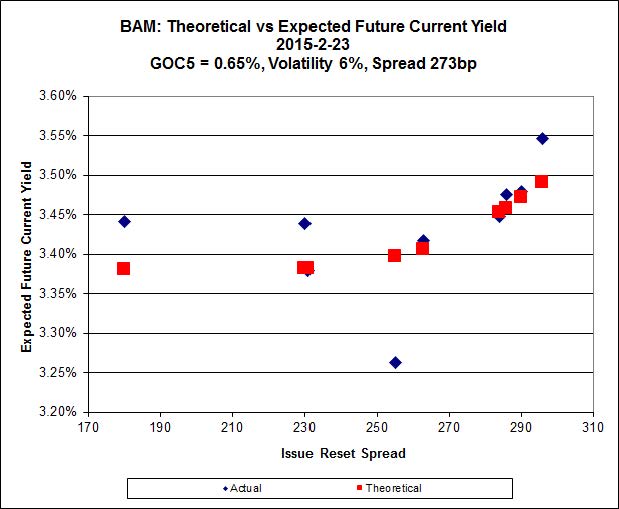
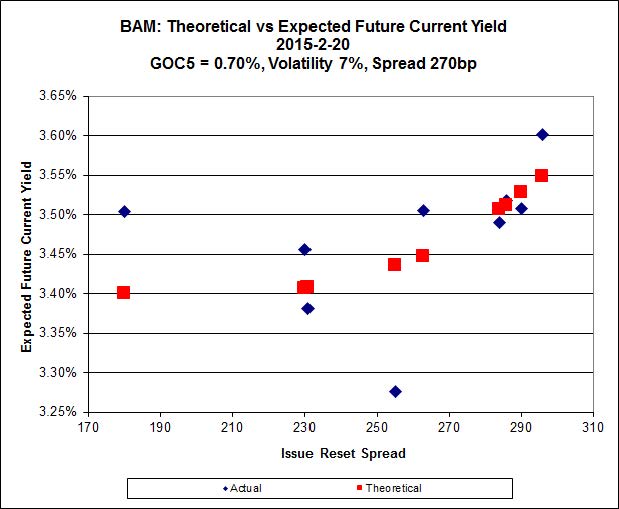
The fit on this series is actually quite reasonable – it’s the scale that makes it look so weird.
The cheapest issue relative to its peers is BAM.PR.Z, resetting at +296bp on 2017-12-31, bid at 25.31 to be $0.46 cheap. BAM.PF.E, resetting at +255bp 2020-3-31 is bid at 24.50 and appears to be $0.92 rich.
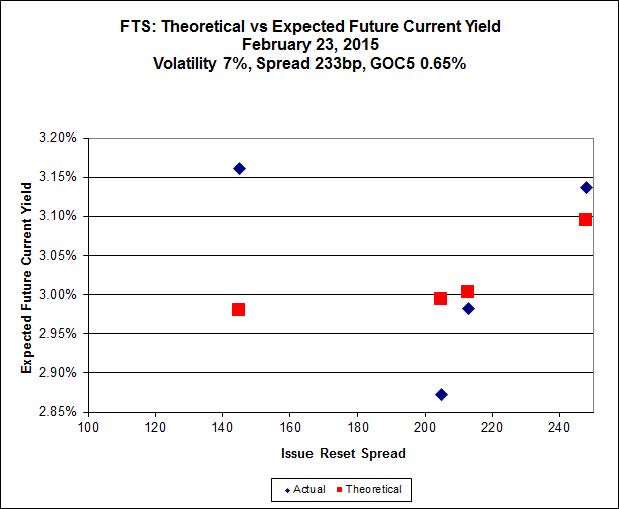
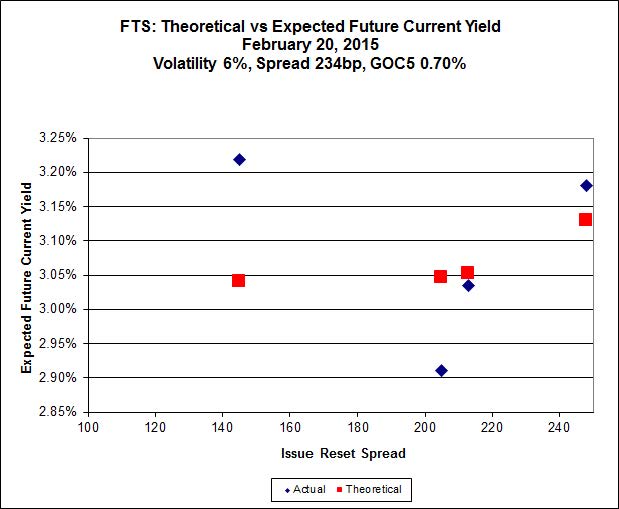
 Click for Big
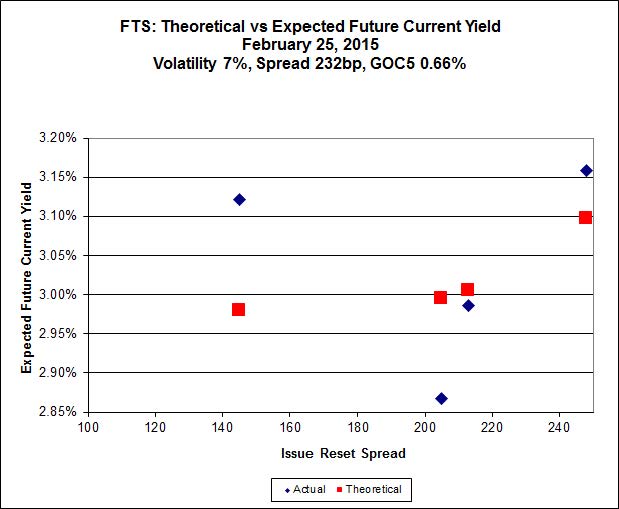
This is just weird because the middle is expensive and the ends are cheap but anyway … FTS.PR.H, with a spread of +145bp, and bid at 16.57, looks $1.05 cheap and resets 2015-6-1. FTS.PR.K, with a spread of +205bp and resetting 2019-3-1, is bid at 23.50 and is $0.96 rich.
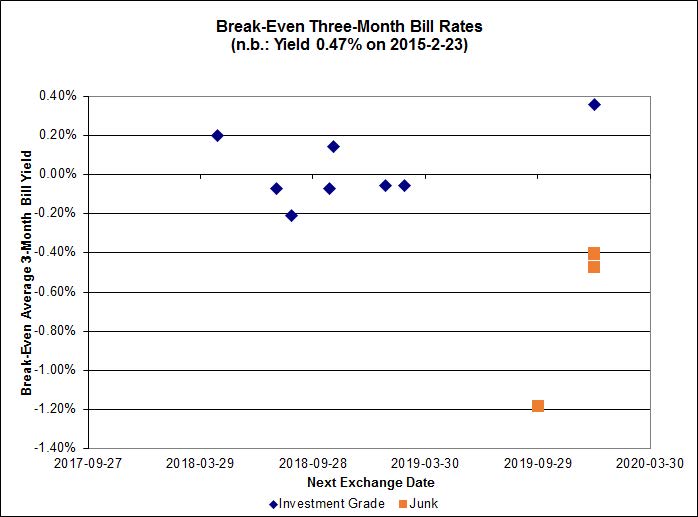
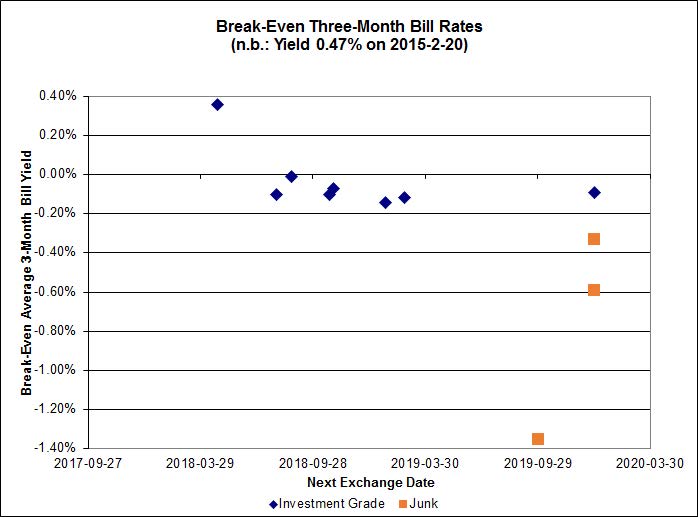
 Click for Big
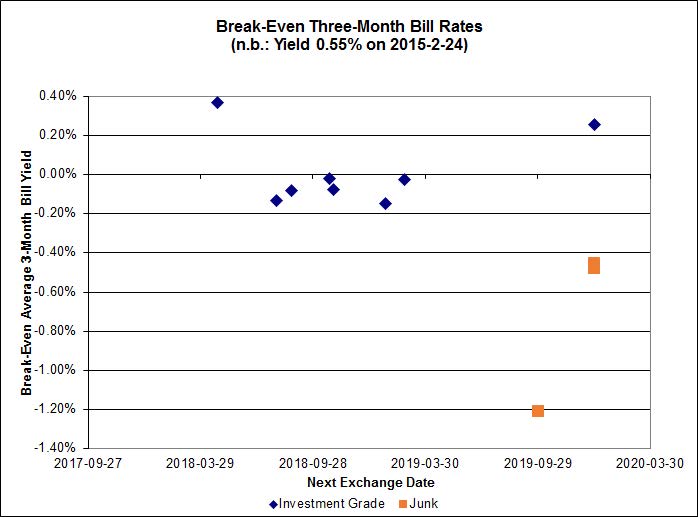
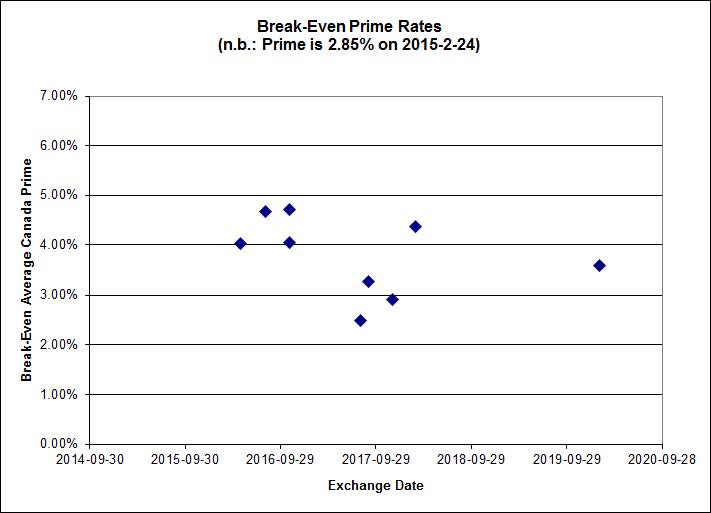
Most of the investment grade break-even rates are a little below zero.
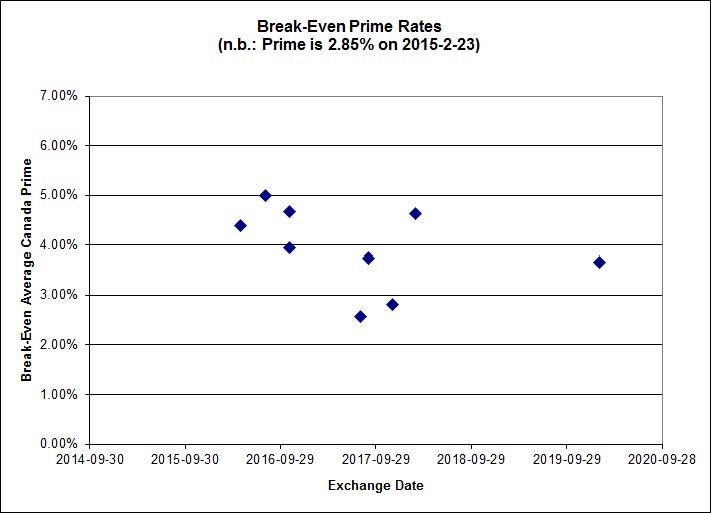
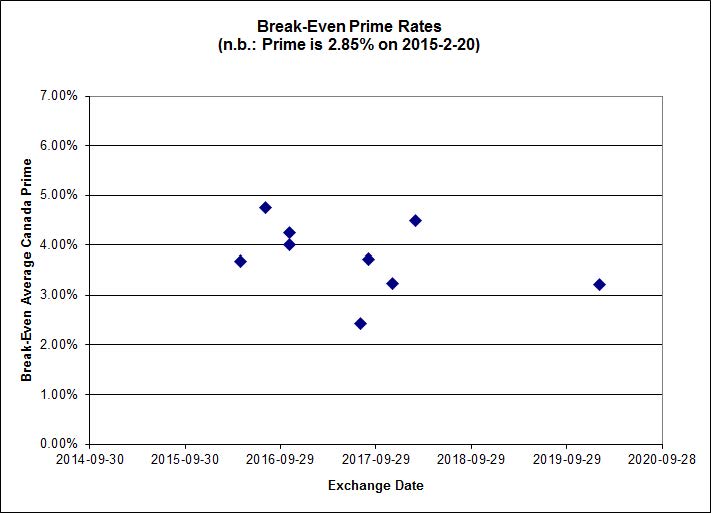
On the other hand, the market’s distaste for product linked to Money Market rates does not extend to prime, as shown by the FixedFloater/RatchetRate pairs:
 Click for Big
Shall we just say that this exhibits a high level of confidence in the continued rapacity of Canadian banks?
HIMIPref™ Preferred Indices
These values reflect the December 2008 revision of the HIMIPref™ Indices
Values are provisional and are finalized monthly |
| Index |
Mean
Current
Yield
(at bid) |
Median
YTW |
Median
Average
Trading
Value |
Median
Mod Dur
(YTW) |
Issues |
Day’s Perf. |
Index Value |
| Ratchet |
0.00 % |
0.00 % |
0 |
0.00 |
0 |
-1.4050 % |
2,333.0 |
| FixedFloater |
4.37 % |
3.51 % |
18,322 |
18.38 |
1 |
0.0000 % |
4,046.5 |
| Floater |
3.09 % |
3.24 % |
66,507 |
19.09 |
4 |
-1.4050 % |
2,480.1 |
| OpRet |
4.08 % |
1.37 % |
111,855 |
0.31 |
1 |
0.1992 % |
2,760.4 |
| SplitShare |
4.42 % |
4.50 % |
28,270 |
3.55 |
6 |
0.4068 % |
3,197.6 |
| Interest-Bearing |
0.00 % |
0.00 % |
0 |
0.00 |
0 |
0.1992 % |
2,524.1 |
| Perpetual-Premium |
5.33 % |
2.11 % |
57,807 |
0.08 |
24 |
-0.0539 % |
2,513.3 |
| Perpetual-Discount |
4.95 % |
4.82 % |
111,101 |
15.29 |
10 |
0.0835 % |
2,797.2 |
| FixedReset |
4.44 % |
3.41 % |
210,354 |
16.87 |
79 |
0.0931 % |
2,412.9 |
| Deemed-Retractible |
4.91 % |
-0.58 % |
106,636 |
0.10 |
39 |
0.1726 % |
2,655.2 |
| FloatingReset |
2.43 % |
2.83 % |
88,016 |
6.39 |
7 |
0.1664 % |
2,326.2 |
| Performance Highlights |
| Issue |
Index |
Change |
Notes |
| ENB.PF.G |
FixedReset |
-3.11 % |
YTW SCENARIO
Maturity Type : Limit Maturity
Maturity Date : 2045-02-24
Maturity Price : 21.69
Evaluated at bid price : 22.10
Bid-YTW : 4.09 % |
| BAM.PR.C |
Floater |
-2.22 % |
YTW SCENARIO
Maturity Type : Limit Maturity
Maturity Date : 2045-02-24
Maturity Price : 15.45
Evaluated at bid price : 15.45
Bid-YTW : 3.26 % |
| BAM.PR.K |
Floater |
-1.86 % |
YTW SCENARIO
Maturity Type : Limit Maturity
Maturity Date : 2045-02-24
Maturity Price : 15.31
Evaluated at bid price : 15.31
Bid-YTW : 3.29 % |
| BAM.PR.B |
Floater |
-1.71 % |
YTW SCENARIO
Maturity Type : Limit Maturity
Maturity Date : 2045-02-24
Maturity Price : 15.55
Evaluated at bid price : 15.55
Bid-YTW : 3.24 % |
| CGI.PR.D |
SplitShare |
-1.36 % |
YTW SCENARIO
Maturity Type : Soft Maturity
Maturity Date : 2023-06-14
Maturity Price : 25.00
Evaluated at bid price : 25.30
Bid-YTW : 3.70 % |
| MFC.PR.I |
FixedReset |
-1.08 % |
YTW SCENARIO
Maturity Type : Call
Maturity Date : 2017-09-19
Maturity Price : 25.00
Evaluated at bid price : 25.56
Bid-YTW : 3.38 % |
| MFC.PR.J |
FixedReset |
-1.06 % |
YTW SCENARIO
Maturity Type : Hard Maturity
Maturity Date : 2025-01-31
Maturity Price : 25.00
Evaluated at bid price : 25.15
Bid-YTW : 3.41 % |
| ENB.PR.N |
FixedReset |
1.03 % |
YTW SCENARIO
Maturity Type : Limit Maturity
Maturity Date : 2045-02-24
Maturity Price : 20.63
Evaluated at bid price : 20.63
Bid-YTW : 4.18 % |
| ENB.PR.D |
FixedReset |
1.08 % |
YTW SCENARIO
Maturity Type : Limit Maturity
Maturity Date : 2045-02-24
Maturity Price : 18.80
Evaluated at bid price : 18.80
Bid-YTW : 4.24 % |
| ENB.PR.B |
FixedReset |
1.14 % |
YTW SCENARIO
Maturity Type : Limit Maturity
Maturity Date : 2045-02-24
Maturity Price : 18.71
Evaluated at bid price : 18.71
Bid-YTW : 4.24 % |
| CU.PR.G |
Perpetual-Discount |
1.31 % |
YTW SCENARIO
Maturity Type : Limit Maturity
Maturity Date : 2045-02-24
Maturity Price : 23.56
Evaluated at bid price : 23.92
Bid-YTW : 4.70 % |
| GWO.PR.G |
Deemed-Retractible |
1.58 % |
YTW SCENARIO
Maturity Type : Call
Maturity Date : 2015-03-26
Maturity Price : 25.00
Evaluated at bid price : 25.75
Bid-YTW : -20.25 % |
| ENB.PR.F |
FixedReset |
1.66 % |
YTW SCENARIO
Maturity Type : Limit Maturity
Maturity Date : 2045-02-24
Maturity Price : 19.60
Evaluated at bid price : 19.60
Bid-YTW : 4.23 % |
| ENB.PR.T |
FixedReset |
1.83 % |
YTW SCENARIO
Maturity Type : Limit Maturity
Maturity Date : 2045-02-24
Maturity Price : 20.08
Evaluated at bid price : 20.08
Bid-YTW : 4.17 % |
| MFC.PR.F |
FixedReset |
1.89 % |
YTW SCENARIO
Maturity Type : Hard Maturity
Maturity Date : 2025-01-31
Maturity Price : 25.00
Evaluated at bid price : 18.85
Bid-YTW : 5.61 % |
| PVS.PR.B |
SplitShare |
2.31 % |
YTW SCENARIO
Maturity Type : Hard Maturity
Maturity Date : 2019-01-10
Maturity Price : 25.00
Evaluated at bid price : 24.85
Bid-YTW : 4.50 % |
| PWF.PR.P |
FixedReset |
2.61 % |
YTW SCENARIO
Maturity Type : Limit Maturity
Maturity Date : 2045-02-24
Maturity Price : 18.50
Evaluated at bid price : 18.50
Bid-YTW : 3.18 % |
| Volume Highlights |
| Issue |
Index |
Shares
Traded |
Notes |
| OSP.PR.A |
SplitShare |
351,334 |
New issue settled today.
YTW SCENARIO
Maturity Type : Hard Maturity
Maturity Date : 2020-03-31
Maturity Price : 10.00
Evaluated at bid price : 10.11
Bid-YTW : 4.78 % |
| ENB.PR.N |
FixedReset |
286,126 |
Nesbitt crossed 250,000 at 20.45.
YTW SCENARIO
Maturity Type : Limit Maturity
Maturity Date : 2045-02-24
Maturity Price : 20.63
Evaluated at bid price : 20.63
Bid-YTW : 4.18 % |
| IFC.PR.A |
FixedReset |
181,890 |
RBC crossed 164,200 at 19.50.
YTW SCENARIO
Maturity Type : Hard Maturity
Maturity Date : 2025-01-31
Maturity Price : 25.00
Evaluated at bid price : 19.85
Bid-YTW : 5.83 % |
| PWF.PR.P |
FixedReset |
68,678 |
RBC crossed 47,100 at 18.15.
YTW SCENARIO
Maturity Type : Limit Maturity
Maturity Date : 2045-02-24
Maturity Price : 18.50
Evaluated at bid price : 18.50
Bid-YTW : 3.18 % |
| NA.PR.W |
FixedReset |
54,825 |
Nesbitt crossed 11,300 at 24.86.
YTW SCENARIO
Maturity Type : Limit Maturity
Maturity Date : 2045-02-24
Maturity Price : 23.11
Evaluated at bid price : 24.85
Bid-YTW : 3.01 % |
| BNS.PR.Y |
FixedReset |
47,949 |
RBC crossed 28,600 at 22.00.
YTW SCENARIO
Maturity Type : Hard Maturity
Maturity Date : 2022-01-31
Maturity Price : 25.00
Evaluated at bid price : 22.00
Bid-YTW : 3.72 % |
| There were 38 other index-included issues trading in excess of 10,000 shares. |
| Wide Spread Highlights |
| Issue |
Index |
Quote Data and Yield Notes |
| ENB.PF.G |
FixedReset |
Quote: 22.10 – 22.79
Spot Rate : 0.6900
Average : 0.4260
YTW SCENARIO
Maturity Type : Limit Maturity
Maturity Date : 2045-02-24
Maturity Price : 21.69
Evaluated at bid price : 22.10
Bid-YTW : 4.09 % |
| HSB.PR.D |
Deemed-Retractible |
Quote: 25.37 – 25.95
Spot Rate : 0.5800
Average : 0.3867
YTW SCENARIO
Maturity Type : Call
Maturity Date : 2015-03-26
Maturity Price : 25.00
Evaluated at bid price : 25.37
Bid-YTW : -3.77 % |
| CGI.PR.D |
SplitShare |
Quote: 25.30 – 26.05
Spot Rate : 0.7500
Average : 0.5644
YTW SCENARIO
Maturity Type : Soft Maturity
Maturity Date : 2023-06-14
Maturity Price : 25.00
Evaluated at bid price : 25.30
Bid-YTW : 3.70 % |
| ENB.PR.J |
FixedReset |
Quote: 21.31 – 21.84
Spot Rate : 0.5300
Average : 0.3812
YTW SCENARIO
Maturity Type : Limit Maturity
Maturity Date : 2045-02-24
Maturity Price : 21.31
Evaluated at bid price : 21.31
Bid-YTW : 4.08 % |
| MFC.PR.I |
FixedReset |
Quote: 25.56 – 25.94
Spot Rate : 0.3800
Average : 0.2370
YTW SCENARIO
Maturity Type : Call
Maturity Date : 2017-09-19
Maturity Price : 25.00
Evaluated at bid price : 25.56
Bid-YTW : 3.38 % |
| VNR.PR.A |
FixedReset |
Quote: 24.90 – 25.40
Spot Rate : 0.5000
Average : 0.3672
YTW SCENARIO
Maturity Type : Limit Maturity
Maturity Date : 2045-02-24
Maturity Price : 23.41
Evaluated at bid price : 24.90
Bid-YTW : 3.51 % |