Archive for March, 2015

March 2, 2015

Tuesday, March 3rd, 2015

The latest hot new financial indicator is: How much European sovereign debt trades at negative yields?:

The European Central Bank’s imminent bond-buying plan has left $1.9 trillion of the euro region’s government securities with negative yields.

Germany sold five-year notes at an average yield of minus 0.08 percent on Wednesday, a euro-area record, meaning investors buying the securities will get less back than they paid when the debt matures in April 2020.

By the next day, German notes with a maturity out to seven years had sub-zero yields, while rates on seven other euro-area nations’ debt were also negative. While some bonds had such yields as far back as 2012, the phenomenon has gathered pace since the ECB’s decision to cut its deposit rate to below zero last year.

And there are more global rate cuts:

The dollar rallied with gold as the yuan slipped to a two-year low after China cut interest rates for the second time in three months. Oil retreated following its first monthly gain since June.

The Bloomberg Dollar Spot Index increased 0.2 percent at 1:22 p.m. in Hong Kong as China’s currency traded at its weakest level since October 2012 and the euro slipped 0.2 percent.

China’s second rate cut in 14 weeks was the latest in a wave of global easing that underscores diverging economic outlooks for the U.S. versus the rest of the world. A private measure of factory activity in Asia’s largest economy showed a faster-than-estimated expansion Monday as lawmakers prepare to meet in Beijing. The euro area updates on consumer prices and U.S. private spending data are due.

The People’s Bank of China announced a benchmark lending and deposit rate cut of a quarter percentage point Saturday. A day later, a government factory gauge for February signaled contraction for a second month, underscoring the scope for looser policy.

The yuan traded at 6.2732 per dollar after the central bank reduced its reference rate to the weakest since November today. Today’s purchasing managers index from HSBC Holdings Plc and Markit Economics came in at 50.7, beating economists’ estimates for it to hold steady from a preliminary reading of 50.1. Readings above 50 denote expansion.

The Bloomberg gauge of dollar strength traded at 1,174.11, less than one point from its highest level in at least 10 years. The greenback was stronger against 13 of 16 major peers, advancing 0.5 percent against the Australian and New Zealand currencies. The euro bought $1.1179.

There are more worries about corporate bond liquidity:

Investors have a fickle relationship with credit mutual funds lately, pouring cash in one year and yanking it out the next.

As a result, the world’s biggest mutual-fund firms are preparing for when sentiment sours for a prolonged period. They’re increasing the amount of cash in their portfolio and boosting their holdings of corporate-bond exchange-traded fund shares — which trade like stocks instead of the antiquated, telephone-based system of buying and selling debt.

Up to 10 percent of some corporate-debt funds’ holdings now consist of ETFs, a proportion that’s been rising for the past two years, according to Tabb Group research.

The potential for big outflows from U.S. bonds is all the scarier now because trading volumes have failed to keep pace with the 21 percent growth in outstanding debt since 2007. While taxable bond funds have received $932 billion of deposits since the end of 2007, Wall Street’s biggest banks have cut holdings of the debt previously used to facilitate trading.

“There has, indeed, been a meaningful deterioration in the ability to trade corporate bonds from the pre- to post-crisis period,” Barclays Plc analysts led by Jeffrey Meli and Bradley Rogoff wrote in a Feb. 27 report. “This has resulted in increased investor reliance on products such as ETFs” to manage liquidity.

Of course, there are some questions about how well ETFs will work as a liquidity tool in a downturn, too. There’s the potential for ETF shares to move away from the underlying market in a time of stress, forcing fire sales of assets that don’t trade as often.

The fragile new equilibrium stems from “liquidity mismatches between the assets themselves and the instruments being used to manage daily liquidity needs,” Barclays analysts wrote. Well-intentioned regulations and “a growing demand for liquidity may have led to increased instability and fire-sale risk in corporate debt markets.”

This has even attracted the attention of one of the well-intentioned regulators:

A lack of liquidity in corporate-bond markets could pose a “systemic risk” to the economy when interest rates rise, U.S. Securities and Exchange Commission member Daniel Gallagher said.

Gallagher, a Republican, warned that the Financial Stability Oversight Council, a group of U.S. regulators that monitors emerging systemic risks, hasn’t paid enough attention to the $7.3 trillion corporate-bond market, which has ballooned over the past seven years amid low interest rates. He made the remarks Monday at a banking conference in Washington.

The SEC last year began testing whether fixed-income mutual funds could withstand a possible sell-off during a period of financial stress, people with knowledge of the matter have said. The agency hasn’t made its findings public, but some large money managers have warned the market is primed for failure when the Federal Reserve starts raising interest rates.

I’ve said it before … I’ll say it again … it’s one thing to say that the banks’ pool of capital may not be used to inventory corporates, but that pool has to be replaced. The logical replacement source is hedge funds, pension funds and insurance companies starting to act as traders but – given that fantasies of creating liquidity through exchange-like electronic marketplaces is nothing more than the psychedelic dream of morons with no knowledge of the market whatsoever – that means they’ll have to have SEC clearance to act as traders. That is, with a Salesforce (that’s expensive!) and no moronic whimpering about fairness to clients. I’m not going to hold my breath. Instead, I’ll continue to be fearful of what will happen when what happened to sub-prime paper during the Credit Crunch happens to corporate debt in the next crisis, which will kill the market for a few years and do massive damage to the economy. There might be a few bargains, though, for those with dry ammunition and permission from our wise masters at the regulatory agencies to invest in fire-sale corporate debt.

Ian McGugan in the Globe writes a piece titled Why decades of inflationary pressure may be ahead of us which drew my attention to a BIS working paper by Mikael Juselius and Elod Takats titled Can Demography Affect Inflation and Monetary Policy?:

Several countries are concurrently experiencing historically low inflation rates and ageing populations. Is there a connection, as recently suggested by some senior central bankers? We undertake a comprehensive test of this hypothesis in a panel of 22 countries over the 1955-2010 period. We find a stable and significant correlation between demography and low-frequency inflation. In particular, a larger share of dependents (ie young and old) is correlated with higher inflation, while a larger share of working age cohorts is correlated with lower inflation. The results are robust to different country samples, time periods, control variables and estimation techniques. We also find a significant, albeit unstable, relationship between demography and monetary policy.

Given these developments, some senior central bankers have suggested an alternative to the “pure mistake” view, arguing that low-frequency inflation may be linked to demographic change. Governor Shirakawa of the Bank of Japan (2011a, 2011b, 2012 and 2013) has argued that population ageing can lead to deflationary pressures by lowering expectations of future economic growth. While people might ignore the implications of an ageing population for a while, they revise their expectations when they recognise the extent of the economic impact. The resulting loss of demand and investment might not be easily offset by monetary policy, especially if inflation is already low and policy rates are close to the zero lower bound. President Bullard of the St Louis Federal Reserve Bank has suggested a different explanation focusing on the political economy of central banking. Bullard et al (2012) argue that the old might prefer lower inflation than the young due to the redistributive effects of inflation. Thus, to the degree their policies reflect voter preference, central banks might engineer lower inflation when populations age.

The potential connection between demography and inflation has also sparked interest from researchers at policy institutions such as the International Monetary Fund. Motivated by the experience of Japan, for example, Anderson et al (2014) find that ageing causes deflationary pressures, mainly via slowing growth. Imam (2013) finds that it can weaken monetary transmission. Yoon et al (2014) find, based on a panel regression, that ageing is deflationary.

According to our estimates, demography accounts for around one-third of the variation in inflation and for the bulk of the deceleration between the late 1970s and early 1990s. Furthermore, our estimates reveal a stable U-shaped pattern: a larger share of dependents (ie young and old) is correlated with higher inflation, and a larger share of working age cohorts is correlated with lower inflation.

It was a mixed day for the Canadian preferred share market, with PerpetualDiscounts off 6bp, FixedResets up 43bp and DeemedRetractibles gaining 1bp. There is a lengthy Performance Highlights table, suitably dominated by winning FixedResets. Volume was very high.

For as long as the FixedReset market is so violently unsettled, I’ll keep publishing updates of the more interesting and meaningful series of FixedResets’ Implied Volatilities. This doesn’t include Enbridge because although Enbridge has a large number of issues outstanding, all of which are quite liquid, the range of Issue Reset Spreads is too small for decent conclusions. The low is 212bp (ENB.PR.H; second-lowest is ENB.PR.D at 237bp) and the high is a mere 268 for ENB.PF.G.

Remember that all rich /cheap assessments are:
» based on Implied Volatility Theory only
» are relative only to other FixedResets from the same issuer
» assume constant GOC-5 yield
» assume constant Implied Volatility
» assume constant spread
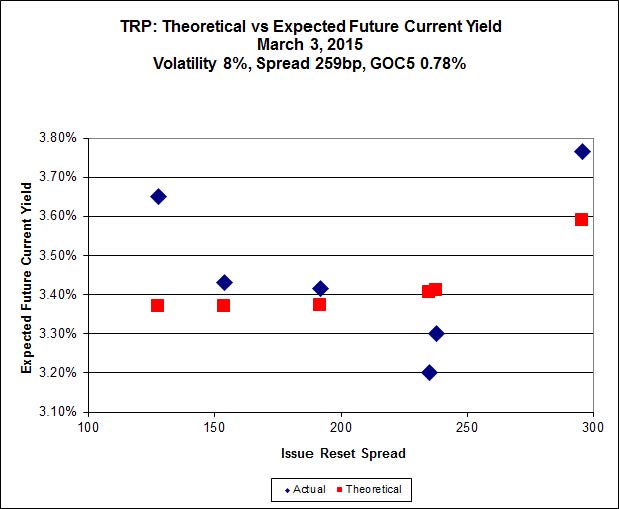
Here’s TRP:

impVol_TRP_150302
Click for Big

The new issue, TRP.PR.G has caused a large change in the curve-fitting for the TRP series of FixedResets. TRP.PR.E, which resets 2019-10-30 at +235, is bid at 24.44 to be $1.47 rich, while TRP.PR.G, resetting 2020-11-30 at +296, is $1.22 cheap at its bid price of 24.83.

impVol_MFC_150302
Click for Big

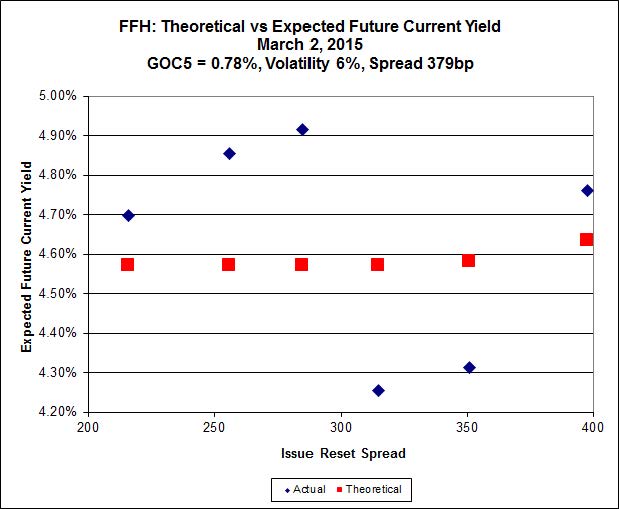
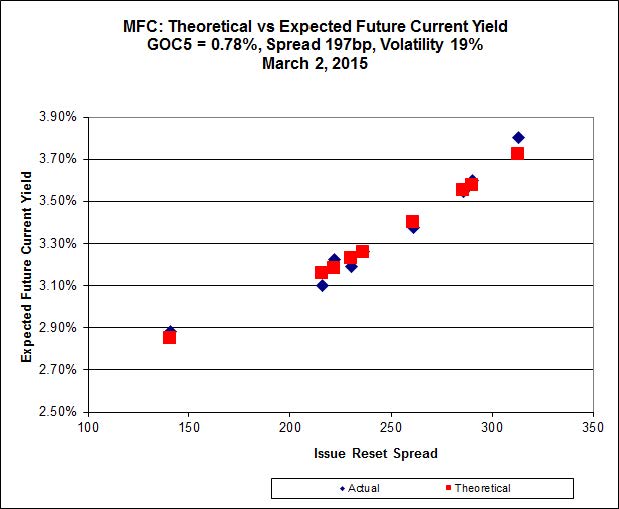
Another excellent fit, but the numbers are perplexing. Implied Volatility for MFC continues to be a conundrum, although it declined substantially today. It is still too high if we consider that NVCC rules will never apply to these issues; it is still too low if we consider them to be NVCC non-compliant issues (and therefore with Deemed Maturities in the call schedule).

Most expensive is MFC.PR.L, resetting at +216 on 2019-6-19, bid at 23.70 to be $0.42 rich, while MFC.PR.H, resetting at +313bp on 2017-3-19, is bid at 25.71 to be $0.56 cheap.

impVol_BAM_150302
Click for Big

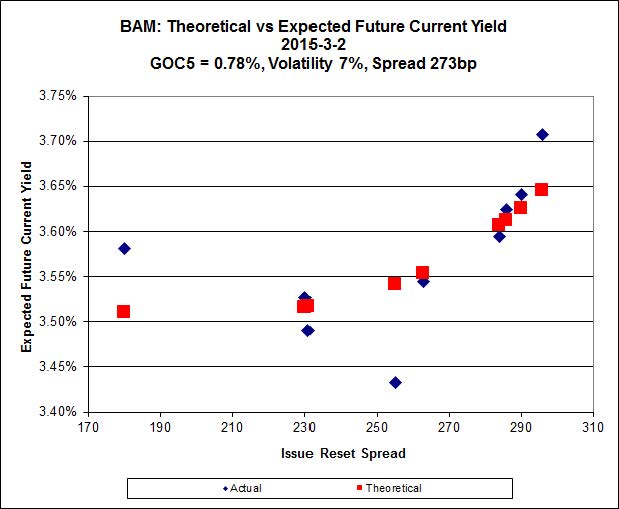
The fit on this series is actually quite reasonable – it’s the scale that makes it look so weird.

The cheapest issue relative to its peers is BAM.PR.Z, resetting at +296bp on 2017-12-31, bid at 25.22 to be $0.43 cheap. BAM.PF.E, resetting at +255bp 2020-3-31 is bid at 24.25 and appears to be $0.74 rich.
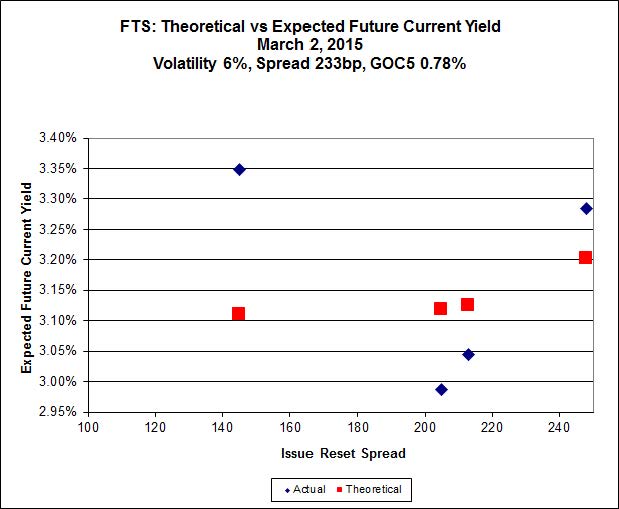
impVol_FTS_150302
Click for Big

This is just weird because the middle is expensive and the ends are cheap but anyway … FTS.PR.H, with a spread of +145bp, and bid at 16.65, looks $1.28 cheap and resets 2015-6-1. FTS.PR.K, with a spread of +205bp and resetting 2019-3-1, is bid at 23.68 and is $0.99 rich.
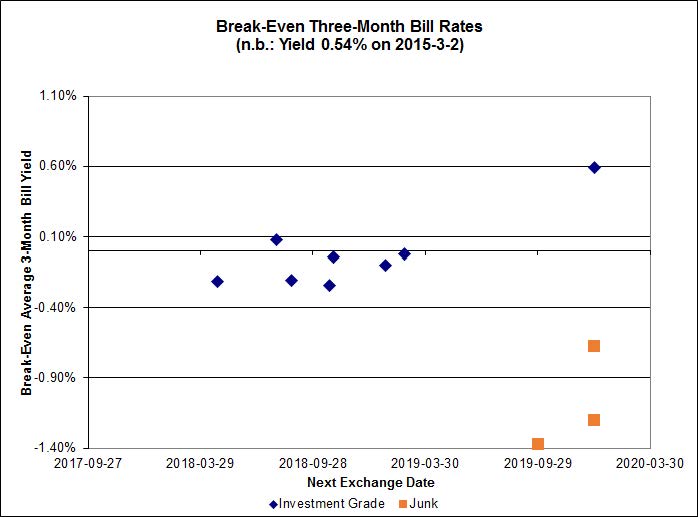
pairs_FR_150302
Click for Big

The investment grade break-even rates average close to zero.

On the other hand, the market’s distaste for product linked to Money Market rates does not extend to prime, as shown by the FixedFloater/RatchetRate pairs:
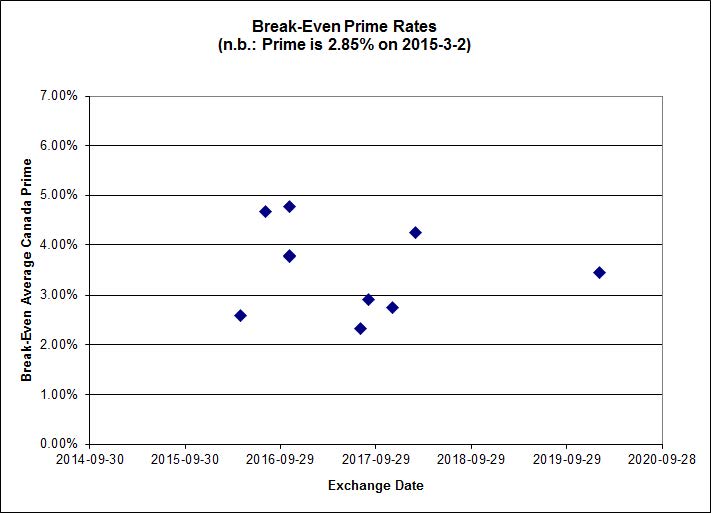
pairs_FF_150302
Click for Big

Shall we just say that this exhibits a high level of confidence in the continued rapacity of Canadian banks?

HIMIPref™ Preferred Indices
These values reflect the December 2008 revision of the HIMIPref™ Indices

Values are provisional and are finalized monthly
Index Mean
Current
Yield
(at bid)
Median
YTW
Median
Average
Trading
Value
Median
Mod Dur
(YTW)
Issues Day’s Perf. Index Value
Ratchet 0.00 % 0.00 % 0 0.00 0 1.9210 % 2,346.9
FixedFloater 0.00 % 0.00 % 0 0.00 0 1.9210 % 4,103.4
Floater 3.20 % 3.25 % 78,183 19.05 3 1.9210 % 2,494.9
OpRet 4.08 % 1.98 % 112,355 0.30 1 -0.0398 % 2,756.0
SplitShare 4.47 % 4.58 % 53,344 4.49 5 -0.0239 % 3,211.0
Interest-Bearing 0.00 % 0.00 % 0 0.00 0 -0.0398 % 2,520.1
Perpetual-Premium 5.30 % -1.19 % 56,512 0.08 25 0.0141 % 2,516.6
Perpetual-Discount 4.97 % 5.06 % 146,066 15.33 9 -0.0558 % 2,801.3
FixedReset 4.44 % 3.53 % 233,061 16.91 80 0.4292 % 2,413.2
Deemed-Retractible 4.93 % 0.07 % 101,561 0.16 39 0.0142 % 2,651.9
FloatingReset 2.50 % 2.90 % 89,933 6.35 8 0.3219 % 2,334.2
Performance Highlights
Issue Index Change Notes
CIU.PR.C FixedReset -5.78 % Not real: this is simply another example either of the Exchange’s shoddy reporting or their inability to enforce market-making responsibilities. The day’s low was 16.78, VWAP was 16.90. Volume was 1,156 shares (consolidated exchanges), which probably overwhelmed the systems, poor little dears, on nine trades including four odd lots. A fine way to welcome CIU.PR.C on the first day of its return from the Scraps index, where it had been relegated on volume concerns!
YTW SCENARIO
Maturity Type : Limit Maturity
Maturity Date : 2045-03-02
Maturity Price : 15.97
Evaluated at bid price : 15.97
Bid-YTW : 3.49 %
VNR.PR.A FixedReset -1.76 % YTW SCENARIO
Maturity Type : Limit Maturity
Maturity Date : 2045-03-02
Maturity Price : 23.04
Evaluated at bid price : 24.01
Bid-YTW : 3.81 %
ENB.PR.D FixedReset 1.05 % YTW SCENARIO
Maturity Type : Limit Maturity
Maturity Date : 2045-03-02
Maturity Price : 19.25
Evaluated at bid price : 19.25
Bid-YTW : 4.27 %
HSE.PR.A FixedReset 1.08 % YTW SCENARIO
Maturity Type : Limit Maturity
Maturity Date : 2045-03-02
Maturity Price : 17.75
Evaluated at bid price : 17.75
Bid-YTW : 3.73 %
TRP.PR.C FixedReset 1.20 % YTW SCENARIO
Maturity Type : Limit Maturity
Maturity Date : 2045-03-02
Maturity Price : 16.90
Evaluated at bid price : 16.90
Bid-YTW : 3.58 %
PWF.PR.T FixedReset 1.21 % YTW SCENARIO
Maturity Type : Limit Maturity
Maturity Date : 2045-03-02
Maturity Price : 23.26
Evaluated at bid price : 25.00
Bid-YTW : 3.22 %
BNS.PR.P FixedReset 1.30 % YTW SCENARIO
Maturity Type : Call
Maturity Date : 2018-04-25
Maturity Price : 25.00
Evaluated at bid price : 25.65
Bid-YTW : 2.58 %
BAM.PR.C Floater 1.37 % YTW SCENARIO
Maturity Type : Limit Maturity
Maturity Date : 2045-03-02
Maturity Price : 15.50
Evaluated at bid price : 15.50
Bid-YTW : 3.25 %
TRP.PR.D FixedReset 1.44 % YTW SCENARIO
Maturity Type : Limit Maturity
Maturity Date : 2045-03-02
Maturity Price : 22.81
Evaluated at bid price : 23.94
Bid-YTW : 3.41 %
FTS.PR.G FixedReset 1.44 % YTW SCENARIO
Maturity Type : Limit Maturity
Maturity Date : 2045-03-02
Maturity Price : 22.86
Evaluated at bid price : 23.89
Bid-YTW : 3.12 %
ENB.PF.C FixedReset 1.47 % YTW SCENARIO
Maturity Type : Limit Maturity
Maturity Date : 2045-03-02
Maturity Price : 22.16
Evaluated at bid price : 22.80
Bid-YTW : 3.98 %
TRP.PR.E FixedReset 1.54 % YTW SCENARIO
Maturity Type : Limit Maturity
Maturity Date : 2045-03-02
Maturity Price : 22.98
Evaluated at bid price : 24.44
Bid-YTW : 3.36 %
ENB.PR.F FixedReset 1.56 % YTW SCENARIO
Maturity Type : Limit Maturity
Maturity Date : 2045-03-02
Maturity Price : 20.12
Evaluated at bid price : 20.12
Bid-YTW : 4.25 %
BNS.PR.Z FixedReset 1.58 % YTW SCENARIO
Maturity Type : Hard Maturity
Maturity Date : 2022-01-31
Maturity Price : 25.00
Evaluated at bid price : 23.16
Bid-YTW : 3.60 %
SLF.PR.H FixedReset 1.60 % YTW SCENARIO
Maturity Type : Hard Maturity
Maturity Date : 2025-01-31
Maturity Price : 25.00
Evaluated at bid price : 22.86
Bid-YTW : 4.14 %
CU.PR.C FixedReset 1.67 % YTW SCENARIO
Maturity Type : Limit Maturity
Maturity Date : 2045-03-02
Maturity Price : 23.29
Evaluated at bid price : 24.40
Bid-YTW : 3.26 %
BNS.PR.Y FixedReset 1.69 % YTW SCENARIO
Maturity Type : Hard Maturity
Maturity Date : 2022-01-31
Maturity Price : 25.00
Evaluated at bid price : 22.22
Bid-YTW : 3.71 %
BAM.PR.B Floater 1.82 % YTW SCENARIO
Maturity Type : Limit Maturity
Maturity Date : 2045-03-02
Maturity Price : 15.69
Evaluated at bid price : 15.69
Bid-YTW : 3.21 %
MFC.PR.F FixedReset 1.88 % YTW SCENARIO
Maturity Type : Hard Maturity
Maturity Date : 2025-01-31
Maturity Price : 25.00
Evaluated at bid price : 19.00
Bid-YTW : 5.65 %
TRP.PR.F FloatingReset 2.15 % YTW SCENARIO
Maturity Type : Limit Maturity
Maturity Date : 2045-03-02
Maturity Price : 19.00
Evaluated at bid price : 19.00
Bid-YTW : 3.23 %
IFC.PR.A FixedReset 2.19 % YTW SCENARIO
Maturity Type : Hard Maturity
Maturity Date : 2025-01-31
Maturity Price : 25.00
Evaluated at bid price : 20.05
Bid-YTW : 5.81 %
IAG.PR.G FixedReset 2.20 % YTW SCENARIO
Maturity Type : Call
Maturity Date : 2017-06-30
Maturity Price : 25.00
Evaluated at bid price : 25.98
Bid-YTW : 2.41 %
ENB.PF.A FixedReset 2.56 % YTW SCENARIO
Maturity Type : Limit Maturity
Maturity Date : 2045-03-02
Maturity Price : 22.19
Evaluated at bid price : 22.82
Bid-YTW : 3.98 %
BAM.PR.K Floater 2.58 % YTW SCENARIO
Maturity Type : Limit Maturity
Maturity Date : 2045-03-02
Maturity Price : 15.50
Evaluated at bid price : 15.50
Bid-YTW : 3.25 %
Volume Highlights
Issue Index Shares
Traded
Notes
TRP.PR.G FixedReset 1,351,456 New issue settled today.
YTW SCENARIO
Maturity Type : Limit Maturity
Maturity Date : 2045-03-02
Maturity Price : 23.06
Evaluated at bid price : 24.83
Bid-YTW : 3.66 %
RY.PR.J FixedReset 182,598 TD crossed 50,000 at 24.98; RBC crossed 49,500 at 24.99.
YTW SCENARIO
Maturity Type : Limit Maturity
Maturity Date : 2045-03-02
Maturity Price : 23.13
Evaluated at bid price : 24.96
Bid-YTW : 3.43 %
CU.PR.C FixedReset 157,914 RBC crossed 150,000 at 23.92.
YTW SCENARIO
Maturity Type : Limit Maturity
Maturity Date : 2045-03-02
Maturity Price : 23.29
Evaluated at bid price : 24.40
Bid-YTW : 3.26 %
ENB.PR.P FixedReset 118,389 TD crossed 10,900 at 20.38; RBC crossed 98,400 at 20.57.
YTW SCENARIO
Maturity Type : Limit Maturity
Maturity Date : 2045-03-02
Maturity Price : 20.42
Evaluated at bid price : 20.42
Bid-YTW : 4.21 %
TRP.PR.E FixedReset 104,106 Scotia crossed 100,000 at 24.25.
YTW SCENARIO
Maturity Type : Limit Maturity
Maturity Date : 2045-03-02
Maturity Price : 22.98
Evaluated at bid price : 24.44
Bid-YTW : 3.36 %
NA.PR.Q FixedReset 83,250 RBC crossed 76,700 at 25.25.
YTW SCENARIO
Maturity Type : Hard Maturity
Maturity Date : 2022-01-31
Maturity Price : 25.00
Evaluated at bid price : 25.25
Bid-YTW : 3.32 %
There were 52 other index-included issues trading in excess of 10,000 shares.
Wide Spread Highlights
Issue Index Quote Data and Yield Notes
IFC.PR.A FixedReset Quote: 20.05 – 20.78
Spot Rate : 0.7300
Average : 0.4651

YTW SCENARIO
Maturity Type : Hard Maturity
Maturity Date : 2025-01-31
Maturity Price : 25.00
Evaluated at bid price : 20.05
Bid-YTW : 5.81 %

CIU.PR.C FixedReset Quote: 15.97 – 17.00
Spot Rate : 1.0300
Average : 0.7693

YTW SCENARIO
Maturity Type : Limit Maturity
Maturity Date : 2045-03-02
Maturity Price : 15.97
Evaluated at bid price : 15.97
Bid-YTW : 3.49 %

MFC.PR.K FixedReset Quote: 23.28 – 23.81
Spot Rate : 0.5300
Average : 0.3282

YTW SCENARIO
Maturity Type : Hard Maturity
Maturity Date : 2025-01-31
Maturity Price : 25.00
Evaluated at bid price : 23.28
Bid-YTW : 4.15 %

MFC.PR.J FixedReset Quote: 25.10 – 25.66
Spot Rate : 0.5600
Average : 0.3676

YTW SCENARIO
Maturity Type : Hard Maturity
Maturity Date : 2025-01-31
Maturity Price : 25.00
Evaluated at bid price : 25.10
Bid-YTW : 3.53 %

MFC.PR.H FixedReset Quote: 25.71 – 26.10
Spot Rate : 0.3900
Average : 0.2356

YTW SCENARIO
Maturity Type : Call
Maturity Date : 2017-03-19
Maturity Price : 25.00
Evaluated at bid price : 25.71
Bid-YTW : 3.06 %

BAM.PF.A FixedReset Quote: 25.27 – 25.65
Spot Rate : 0.3800
Average : 0.2443

YTW SCENARIO
Maturity Type : Limit Maturity
Maturity Date : 2045-03-02
Maturity Price : 23.39
Evaluated at bid price : 25.27
Bid-YTW : 3.70 %

TRP.PR.G Soft On Excellent Volume

Monday, March 2nd, 2015

TransCanada Corporation has announced:

that it has completed its public offering of cumulative redeemable first preferred shares, series 11 (the “Series 11 Preferred Shares”). TransCanada issued 10 million Series 11 Preferred Shares for aggregate gross proceeds of $250 million through a syndicate of underwriters co-led by Scotiabank and RBC Capital Markets.

The net proceeds of the offering will be used for general corporate purposes and to reduce short term indebtedness of TransCanada and its affiliates, which short term indebtedness was used to fund TransCanada’s capital program and for general corporate purposes.

The Series 11 Preferred Shares will begin trading today on the TSX under the symbol TRP.PR.G.

TRP.PR.G is a FixedReset, 3.80%+296, announced February 23. It will be tracked by HIMIPref™ and has been assigned to the FixedReset subindex.

The issue has been rated Pfd-2(low) by DBRS.

TRP.PR.G traded 1,511,656 shares today (consolidated exchanges) in a range of 24.83-93 before closing at 24.83-85. Vital statistics are:

TRP.PR.G FixedReset YTW SCENARIO
Maturity Type : Limit Maturity
Maturity Date : 2045-03-02
Maturity Price : 23.06
Evaluated at bid price : 24.83
Bid-YTW : 3.66 %

Implied Volatility theory suggests that TRP.PR.G is $1.22 cheap:

impVol_TRP_150302
Click for Big

FFH.PR.E To Reset At 2.91%

Monday, March 2nd, 2015

Fairfax Financial Holdings Limited has announced:

that it has determined the fixed dividend rate on its Cumulative 5-Year Rate Reset Preferred Shares, Series E (“Series E Shares”) (TSX: FFH.PR.E) for the five years commencing April 1, 2015 and ending March 31, 2020. The fixed quarterly dividends on the Series E Shares during that period will be paid at an annual rate of 2.91% (Cdn. $0.18188 per share per quarter).

Holders of Series E Shares have the right, at their option, exercisable not later than 5:00pm (Toronto time) on March 16, 2015, to convert all or part of their Series E Shares, on a one-for-one basis, into Cumulative Floating Rate Preferred Shares, Series F (the “Series F Shares”), effective March 31, 2015. The quarterly floating rate dividends on the Series F Shares will be paid at an annual rate, calculated for each quarter, of 2.16% over the annual yield on three month Government of Canada treasury bills. The actual quarterly dividend rate in respect of the April 1, 2015 to June 29, 2015 dividend period for the Series F Shares will be 0.647753% (2.627 % on an annualized basis) and the dividend, if and when declared, for such dividend period will be Cdn. $0.16194 per share, payable on June 29, 2015.

Holders of Series E Shares are not required to elect to convert all or any part of their Series E Shares into Series F Shares.

As provided in the share conditions of the Series E Shares, (i) if Fairfax determines that there would be fewer than 1,000,000 Series E Shares outstanding after March 31, 2015, all remaining Series E Shares will be automatically converted into Series F Shares on a one-for-one basis effective March 31, 2015; and (ii) if Fairfax determines that there would be fewer than 1,000,000 Series F Shares outstanding after March 31, 2015, no Series E Shares will be permitted to be converted into Series F Shares. There are currently 7,915,539 Series E Shares outstanding.

The Toronto Stock Exchange (“TSX”) has conditionally approved the listing of the Series F Shares effective upon conversion. Listing of the Series F Shares is subject to Fairfax fulfilling all the listing requirements of the TSX and, upon approval, the Series F Shares will be listed on the TSX under the trading symbol “FFH.PR.F”.

Fairfax is a financial services holding company which, through its subsidiaries, is engaged in property and casualty insurance and reinsurance and investment management.

FFH.PR.E is a FixedReset that commenced trading 2010-2-1 after being announced 2010-1-21.

The initial dividend rate was 4.75%, so the dividend is being cut by a horrific 39%.

As noted in the release, the deadline for conversion instructions to reach the company is March 16 at 5pm; I will post a note a few days in advance of the deadline with a recommendation regarding whether holders should or should not exchange their shares.

Implied Volatility theory – with tomorrow’s new issue deemed to be bid at par – suggests that FFH.PR.E is currently $0.43 cheap … but the fit is very poor:

impVol_FFH_150302
Click for Big

AIM.PR.A To Reset at 4.50%

Monday, March 2nd, 2015

Aimia has announced:

the applicable dividend rates for its Cumulative Rate Reset Preferred Shares, Series 1 (the “Series 1 Shares”) and its Cumulative Floating Rate Preferred Shares, Series 2 (the “Series 2 Shares”), further to the February 27, 2015 notice that it will not exercise its right to redeem all or any part of the outstanding Series 1 Shares and, as a result of which, subject to certain conditions, the holders of the Series 1 Shares will have the right to convert all or part of their Series 1 Shares into Series 2 Shares on a one-for-one basis.

With respect to any Series 1 Shares that remain outstanding after March 31, 2015, holders of the Series 1 Shares will be entitled to receive quarterly fixed, cumulative, preferential cash dividends, as and when declared by the Board of Directors of Aimia, subject to the provisions of the Canada Business Corporations Act. The dividend rate for the five-year period from and including March 31, 2015 to but excluding March 31, 2020 will be 4.5%, being 3.75% over the five-Year Government of Canada bond yield, as determined in accordance with the terms of the Series 1 Shares.

With respect to any Series 2 Shares that may be issued on March 31, 2015, holders of the Series 2 Shares will be entitled to receive quarterly floating rate, cumulative, preferential cash dividends, calculated on the basis of the actual number of days elapsed in such quarterly period divided by 365, as and when declared by the Board of Directors of Aimia, subject to the provisions of the Canada Business Corporations Act. The dividend rate for the floating rate period from and including March 31, 2015 to but excluding June 30, 2015 will be 4.217%, being 3.75% over the 90-day Government of Canada Treasury Bill yield, as determined in accordance with the terms of the Series 2 Shares.

Beneficial owners of Series 1 Shares who wish to exercise their conversion right should communicate as soon as possible with their broker or other nominee to obtain instructions for exercising such right on or prior to the deadline for exercise, which is 5:00 p.m. (Montreal time) on March 17, 2015.

Inquiries should be directed to Aimia’s Registrar and Transfer Agent, CST Trust Company, at 1-800-387-0825 (toll free in Canada and the United States).

The extension has been previously reported on PrefBlog. AIM.PR.A changed its ticker from AER.PR.A in October, 2011. AER.PR.A commenced trading 2010-1-20 after being announced 2010-1-12.

The initial dividend rate was 6.50%, so the new rate of 4.50% represents a decline of about 31%.

As noted in the release, the deadline for conversion instructions to reach the company is March 17 at 5pm Montreal Time; I will post a note a few days in advance of the deadline with a recommendation regarding whether holders should or should not exchange their shares.

MAPF Performance: February 2015

Monday, March 2nd, 2015

The fund slightly outperformed in February, hurt by holdings in lower quality FixedResets and the surprisingly poorly performing IFC.PR.A, but buoyed by holdings in higher quality FixedResets and DeemedRetractibles.

ZPR, is an ETF comprised of FixedResets and Floating Rate issues and a very high proportion of junk issues, returned +%, +% and +% over the past one-, three- and twelve-month periods, respectively (according to the fund’s data), versus returns for the TXPL index of -1.36%, -9.07% and -5.23% -0.31%, -8.11% and -4.22% respectively. The fund has been able to attract assets of about $1.054-million since inception in November 2012; AUM increased by $2-million in February; given an index return of -1.36% an decrease of about $14-million $3-million was expected, so in February 2015 the fund was able to attract assets, bouncing back from its first outflow in January. I feel that the flows into and out of this fund are very important in determining the performance of its constituents.

TXPR had returns over one-, three- and twelve-months of +0.17%, -4.71% and +0.31% respectively with CPD performance within expectations.

Returns for the HIMIPref™ investment grade sub-indices for January were as follows:

HIMIPref™ Indices
Performance to February 27, 2015
Sub-Index 1-Month 3-month
Ratchet N/A N/A
FixFloat +0.79% N/A
Floater +4.85% %
OpRet +0.22% -0.11%
SplitShare +0.87% +0.40%
Interest N/A N/A
PerpetualPremium +0.22% +1.23%
PerpetualDiscount +1.73% +4.50%
FixedReset +0.39% -7.13%
DeemedRetractible +0.53% +1.30%
FloatingReset +2.02% -8.96%

Malachite Aggressive Preferred Fund’s Net Asset Value per Unit as of the close February 27, 2015, was $9.9758.

Returns to February 27, 2015
Period MAPF BMO-CM “50” Index TXPR
Total Return
CPD – according to Blackrock
One Month +0.24% -0.29% +0.17% N/A
Three Months -5.46% -5.16% -4.71% N/A
One Year +2.79% -1.25% +0.31% -0.11%
Two Years (annualized) +0.40% -1.04% -0.92% N/A
Three Years (annualized) +2.94% +0.92% +1.06% +0.58%
Four Years (annualized) +2.88% +2.35% +2.15% N/A
Five Years (annualized) +6.19% +4.15% +3.65% +3.08%
Six Years (annualized) +12.96% +7.74% +6.82%  
Seven Years (annualized) +10.97% +3.88% +3.05%  
Eight Years (annualized) +0.01% +2.84%    
Nine Years (annualized) +9.64% +3.02%    
Ten Years (annualized) +9.23% +3.11%    
Eleven Years (annualized) +9.23% +3.16%    
Twelve Years (annualized) +10.86% +3.70%    
Thirteen Years (annualized) +10.07% +3.59%    
MAPF returns assume reinvestment of distributions, and are shown after expenses but before fees.
CPD Returns are for the NAV and are after all fees and expenses.
Figures for National Bank Preferred Equity Income Fund (formerly Omega Preferred Equity) (which are after all fees and expenses) for 1-, 3- and 12-months are +0.22%, -2.63% and +2.32%, respectively, according to Morningstar after all fees & expenses. Three year performance is +2.11%; five year is +4.34%
Figures for Jov Leon Frazer Preferred Equity Fund Class I Units (which are after all fees and expenses) for 1-, 3- and 12-months are -0.90%, -5.64% and -4.15% respectively, according to Morningstar. Three Year performance is -1.53%; five-year is +0.87%
Figures for Manulife Preferred Income Class Adv [into which was merged Manulife Preferred Income Fund (formerly AIC Preferred Income Fund)] (which are after all fees and expenses) for 1-, 3- and 12-months are +0.24%, -3.65% & +1.13%, respectively.
Figures for Horizons AlphaPro Preferred Share ETF (which are after all fees and expenses) for 1-, 3- and 12-months are -0.01%, -3.94% & +0.91%, respectively. Three year performance is +1.86%
Figures for National Bank Preferred Equity Fund (formerly Altamira Preferred Equity Fund) are -0.09%, -4.65% and -0.35% for one-, three- and twelve months, respectively.
The figure for BMO S&P/TSX Laddered Preferred Share Index ETF is -0.56%, -8.44% and -4.90% for one-, three- and twelve-months, respectively. Two year performance is -4.27%.
Figures for NexGen Canadian Preferred Share Tax Managed Fund (Dividend Tax Credit Class, the best performing) are +0.5%, N/A% and +7.1% for one-, three- and twelve-months, respectively.
Figures for BMO Preferred Share Fund are -3.77% and -0.74% for the past three- and twelve-months, respectively.
Figures for PowerShares Canadian Preferred Share Index Class, Series Fare -0.31%, -4.50% and -0.37% for the past one, three and twelve months, respectively. The three- and five-year figures are -0.28% and +2.18%, respectively.

MAPF returns assume reinvestment of dividends, and are shown after expenses but before fees. Past performance is not a guarantee of future performance. You can lose money investing in Malachite Aggressive Preferred Fund or any other fund. For more information, see the fund’s main page. The fund is available either directly from Hymas Investment Management or through a brokerage account at Odlum Brown Limited.

A problem that has bedevilled the market over the past two years has been the OSFI decision not to grandfather Straight Perpetuals as Tier 1 bank capital, and their continued foot-dragging regarding a decision on insurer Straight Perpetuals has segmented the market to the point where trading has become much more difficult. The fund occasionally finds an attractive opportunity to trade between GWO issues, which have a good range of annual coupons (but in which trading is now hampered by the fact that the low-coupon issues are trading near par and are callable at par in the near term), but is “stuck” in the MFC and SLF issues, which have a much narrower range of coupon, while the IAG DeemedRetractibles are quite illiquid. Until the market became so grossly segmented, this was not so much of a problem – but now banks are not available to swap into (because they are so expensive) and non-regulated companies are likewise deprecated (because they are not DeemedRetractibles; they should not participate in the increase in value that will follow the OSFI decision I anticipate and, in addition, are analyzed as perpetuals). The fund’s portfolio is, in effect ‘locked in’ to the MFC & SLF issues due to projected gains from a future OSFI decision, to the detriment of trading gains particularly in May, 2013, when the three lowest-coupon SLF DeemedRetractibles (SLF.PR.C, SLF.PR.D and SLF.PR.E) were the worst performing DeemedRetractibles in the sub-index, and in June, 2013, when the insurance-issued DeemedRetractibles behaved like PerpetualDiscounts in a sharply negative market. Nowadays, the fund is ‘locked-in’ to the low-spread FixedResets from these companies: GWO.PR.N, MFC.PR.F, and SLF.PR.G.

In February, insurance DeemedRetractibles outperformed bank DeemedRetractibles:

insBankPerf_150227
Click for Big

… and were about equal to Unregulated Straight Perpetuals.

insUnregPerf_150227
Click for Big

Correlations were a poor 10% for banks, but a very good 52% for insurance and a good 39% for unregulated Straights.

A lingering effect of the downdraft of 2013 has been the return of measurable Implied Volatility but given my recent updates in recent daily market reports, I will not discuss them further in this post.

Sometimes everything works … sometimes it’s 50-50 … sometimes nothing works. The fund seeks to earn incremental return by selling liquidity (that is, taking the other side of trades that other market participants are strongly motivated to execute), which can also be referred to as ‘trading noise’ – although for quite some time, noise trading has taken a distant second place to the sectoral play on insurance DeemedRetractibles; something that dismays me, particularly given that the market does not yet agree with me regarding the insurance issues! There were a lot of strongly motivated market participants during the Panic of 2007, generating a lot of noise! Unfortunately, the conditions of the Panic may never be repeated in my lifetime … but the fund will simply attempt to make trades when swaps seem profitable, without worrying about the level of monthly turnover.

There’s plenty of room for new money left in the fund. I have shown in PrefLetter that market pricing for FixedResets is very often irrational and I have lots of confidence – backed up by my bond portfolio management experience in the markets for Canadas and Treasuries, and equity trading on the NYSE & TSX – that there is enough demand for liquidity in any market to make the effort of providing it worthwhile (although the definition of “worthwhile” in terms of basis points of outperformance changes considerably from market to market!) I will continue to exert utmost efforts to outperform but it should be borne in mind that there will almost inevitably be periods of underperformance in the future.

The yields available on high quality preferred shares remain elevated, which is reflected in the current estimate of sustainable income.

Calculation of MAPF Sustainable Income Per Unit
Month NAVPU Portfolio
Average
YTW
Leverage
Divisor
Securities
Average
YTW
Capital
Gains
Multiplier
Sustainable
Income
per
current
Unit
June, 2007 9.3114 5.16% 1.03 5.01% 1.3240 0.3524
September 9.1489 5.35% 0.98 5.46% 1.3240 0.3773
December, 2007 9.0070 5.53% 0.942 5.87% 1.3240 0.3993
March, 2008 8.8512 6.17% 1.047 5.89% 1.3240 0.3938
June 8.3419 6.034% 0.952 6.338% 1.3240 $0.3993
September 8.1886 7.108% 0.969 7.335% 1.3240 $0.4537
December, 2008 8.0464 9.24% 1.008 9.166% 1.3240 $0.5571
March 2009 $8.8317 8.60% 0.995 8.802% 1.3240 $0.5872
June 10.9846 7.05% 0.999 7.057% 1.3240 $0.5855
September 12.3462 6.03% 0.998 6.042% 1.3240 $0.5634
December 2009 10.5662 5.74% 0.981 5.851% 1.1141 $0.5549
March 2010 10.2497 6.03% 0.992 6.079% 1.1141 $0.5593
June 10.5770 5.96% 0.996 5.984% 1.1141 $0.5681
September 11.3901 5.43% 0.980 5.540% 1.1141 $0.5664
December 2010 10.7659 5.37% 0.993 5.408% 1.0298 $0.5654
March, 2011 11.0560 6.00% 0.994 5.964% 1.0298 $0.6403
June 11.1194 5.87% 1.018 5.976% 1.0298 $0.6453
September 10.2709 6.10%
Note
1.001 6.106% 1.0298 $0.6090
December, 2011 10.0793 5.63%
Note
1.031 5.805% 1.0000 $0.5851
March, 2012 10.3944 5.13%
Note
0.996 5.109% 1.0000 $0.5310
June 10.2151 5.32%
Note
1.012 5.384% 1.0000 $0.5500
September 10.6703 4.61%
Note
0.997 4.624% 1.0000 $0.4934
December, 2012 10.8307 4.24% 0.989 4.287% 1.0000 $0.4643
March, 2013 10.9033 3.87% 0.996 3.886% 1.0000 $0.4237
June 10.3261 4.81% 0.998 4.80% 1.0000 $0.4957
September 10.0296 5.62% 0.996 5.643% 1.0000 $0.5660
December, 2013 9.8717 6.02% 1.008 5.972% 1.0000 $0.5895
March, 2014 10.2233 5.55% 0.998 5.561% 1.0000 $0.5685
June 10.5877 5.09% 0.998 5.100% 1.0000 $0.5395
September 10.4601 5.28% 0.997 5.296% 1.0000 $0.5540
December, 2014 10.5701 4.83% 1.009 4.787% 1.0000 $0.5060
February, 2015 9.9758 4.97% 0.989 5.025% 1.0000 $0.5013
NAVPU is shown after quarterly distributions of dividend income and annual distribution of capital gains.
Portfolio YTW includes cash (or margin borrowing), with an assumed interest rate of 0.00%
The Leverage Divisor indicates the level of cash in the account: if the portfolio is 1% in cash, the Leverage Divisor will be 0.99
Securities YTW divides “Portfolio YTW” by the “Leverage Divisor” to show the average YTW on the securities held; this assumes that the cash is invested in (or raised from) all securities held, in proportion to their holdings.
The Capital Gains Multiplier adjusts for the effects of Capital Gains Dividends. On 2009-12-31, there was a capital gains distribution of $1.989262 which is assumed for this purpose to have been reinvested at the final price of $10.5662. Thus, a holder of one unit pre-distribution would have held 1.1883 units post-distribution; the CG Multiplier reflects this to make the time-series comparable. Note that Dividend Distributions are not assumed to be reinvested.
Sustainable Income is the resultant estimate of the fund’s dividend income per current unit, before fees and expenses. Note that a “current unit” includes reinvestment of prior capital gains; a unitholder would have had the calculated sustainable income with only, say, 0.9 units in the past which, with reinvestment of capital gains, would become 1.0 current units.
DeemedRetractibles are comprised of all Straight Perpetuals (both PerpetualDiscount and PerpetualPremium) issued by BMO, BNS, CM, ELF, GWO, HSB, IAG, MFC, NA, RY, SLF and TD, which are not exchangable into common at the option of the company (definition refined in May, 2011). These issues are analyzed as if their prospectuses included a requirement to redeem at par on or prior to 2022-1-31 (banks) or 2025-1-31 (insurers and insurance holding companies), in addition to the call schedule explicitly defined. See OSFI Does Not Grandfather Extant Tier 1 Capital, CM.PR.D, CM.PR.E, CM.PR.G: Seeking NVCC Status and the January, February, March and June, 2011, editions of PrefLetter for the rationale behind this analysis.
Yields for September, 2011, to January, 2012, were calculated by imposing a cap of 10% on the yields of YLO issues held, in order to avoid their extremely high calculated yields distorting the calculation and to reflect the uncertainty in the marketplace that these yields will be realized. From February to September 2012, yields on these issues have been set to zero. All YLO issues held were sold in October 2012.

Significant positions were held in DeemedRetractible, SplitShare and NVCC non-compliant regulated FixedReset issues on February 27; all of these currently have their yields calculated with the presumption that they will be called by the issuers at par prior to 2022-1-31 (banks) or 2025-1-31 (insurers and insurance holding companies) or on a different date (SplitShares) This presents another complication in the calculation of sustainable yield, which also assumes that redemption proceeds will be reinvested at the same rate.

In addition, sustainable yields on FixedResets are based on these issues being reset according to a GOC-5 yield of 0.78%; while this does not reflect the recent drop to a stunning 0.72% as of the close on Friday, I anticipate that this yield will rise gradually over time as the economy recovers. Mind you, I’ve been saying for the past several years that I don’t think government rates can go down much further and have been wrong every single time, so take it as you will.

I no longer show calculations that assume the conversion of the entire portfolio into PerpetualDiscounts, as the fund has only a small position in these issues.

I will also note that the sustainable yield calculated above is not directly comparable with any yield calculation currently reported by any other preferred share fund as far as I am aware. The Sustainable Yield depends on:
i) Calculating Yield-to-Worst for each instrument and using this yield for reporting purposes;
ii) Using the contemporary value of Five-Year Canadas (set at 1.40% for the December 31 calculation) to estimate dividends after reset for FixedResets.

Most funds report Current Yield. For instance, ZPR reports a “Dividend Yield” of 4.5% as of August 29, 2014, but this is the Current Yield, a meaningless number. The Current Yield of MAPF was 4.89% as of August 29, but I will neither report that with any degree of prominence nor take any great pleasure in the fact that it’s a little higher than the ZPR number. It’s meaningless; to discuss it in the context of portfolio reporting is misleading.

However, BMO has taken a significant step forward in that they are no longer reporting the “Portfolio Yield” directly on their website; the information is taken from the “Enhanced Fund Profile” which is available only as a PDF link. CPD doesn’t report this metric on the CPD fact sheet or on their website. I may have one less thing to mock the fundcos about!

It should be noted that the concept of this Sustainable Income calculation was developed when the fund’s holdings were overwhelmingly PerpetualDiscounts – see, for instance, the bottom of the market in November 2008. It is easy to understand that for a PerpetualDiscount, the technique of multiplying yield by price will indeed result in the coupon – a PerpetualDiscount paying $1 annually will show a Sustainable Income of $1, regardless of whether the price is $24 or $17.

Things are not quite so neat when maturity dates and maturity prices that are different from the current price are thrown into the mix. If we take a notional Straight Perpetual paying $5 annually, the price is $100 when the yield is 5% (all this ignores option effects). As the yield increases to 6%, the price declines to 83.33; and 83.33 x 6% is the same $5. Good enough.

But a ten year bond, priced at 100 when the yield is equal to its coupon of 5%, will decline in price to 92.56; and 92.56 x 6% is 5.55; thus, the calculated Sustainable Income has increased as the price has declined as shown in the graph:


Click for Big

The difference is because the bond’s yield calculation includes the amortization of the discount; therefore, so does the Sustainable Income estimate.

Different assumptions lead to different results from the calculation, but the overall positive trend is apparent. I’m very pleased with the long-term results! It will be noted that if there was no trading in the portfolio, one would expect the sustainable yield to be constant (before fees and expenses). The success of the fund’s trading is showing up in

  • the very good performance against the index
  • the long term increases in sustainable income per unit

As has been noted, the fund has maintained a credit quality equal to or better than the index; outperformance has generally been due to exploitation of trading anomalies.

Again, there are no predictions for the future! The fund will continue to trade between issues in an attempt to exploit market gaps in liquidity, in an effort to outperform the index and keep the sustainable income per unit – however calculated! – growing.

Low-Spread FixedResets: February, 2015

Sunday, March 1st, 2015

As noted in MAPF Portfolio Composition: February 2015, the fund now has a fairly large allocation to FixedResets, although this segment remains below index weight.

As these were largely purchased with proceeds of sales of DeemedRetractibles from the same issuer, it is interesting to look at the price trend of some of the Straight/FixedReset pairs. We’ll start with GWO.PR.N / GWO.PR.I; the fund sold the latter to buy the former at a takeout of about $1.00 in mid-June, 2014; relative prices over the past year are plotted as:

GWOPRN_GWOPRI_bidDiff_150227
Click for Big

Given that the February month-end take-out was $6.25, this is clearly a trade that has not worked out very well.

In July, 2014, I reported sales of SLF.PR.D to purchase SLF.PR.G at a take-out of about $0.15:

SLFPRG_SLFPRD_bidDiff_150227
Click for Big

There were similar trades in August, 2014 (from SLF.PR.C) at a take-out of $0.35. The February month-end take-out (bid price SLF.PR.D less bid price SLF.PR.G) was $6.45, so that hasn’t worked very well either.

The trend paused in September, 2014 and, indeed, can be said to have reversed, with the fund selling SplitShares (PVS.PR.B at 25.25-30) to purchase PerpetualDiscounts (BAM.PR.M / BAM.PR.N at about 21.25), a trade which worked out favourably and has been sort-of reversed (into PVS.PR.D) in November 2014.

In October 2014 there was another bit of counterflow, as the fund sold more SplitShares (CGI.PR.D at about 25.25) to purchase more PerpetualDiscounts (CU.PR.F and CU.PR.G, at about 21.25) which again worked out well and was reversed in November, selling the CU issues at about 22.45 to purchase low-spread FixedResets (TRP.PR.A and TRP.PR.B) at about 21.50 and 18.75 (post dividend equivalent), which was basically down by transaction costs at November month-end, but a significant loser by December month-end.

And November saw the third insurer-based sector swap, as the fund sold MFC.PR.C to buy the FixedReset MFC.PR.F at a post-dividend-adjusted take-out of about $0.85 … given a February month-end take-out of about $5.29, that’s another regrettable trade, although another piece executed in December at a take-out of $1.57 has less badly.

MFCPRF_MFCPRC_bidDiff_150227
Click for Big

This trend is not restricted to the insurance sector, which I expect will become subject to NVCC rules in the relatively near future and are thus subject to the same redemption assumptions I make for DeemedRetractibles. Other pairs of interest are BAM.PR.X / BAM.PR.N:

BAMPRX_BAMPRN_bidDiff_140227
Click for Big

… and FTS.PR.H / FTS.PR.J:

FTSPRH_FTSPRJ_bidDiff_150227
Click for Big

… and PWF.PR.P / PWF.PR.S:

PWFPRP_PWFPRS_bidDiff_150227
Click for Big

I will agree that the fund’s trades highlighted in this post may be decried as cases of monumental bad timing, but I should point out that in May, 2014, the fund was 63.9% Straight / 9.5% FixedReset
while in February 2015 the fund was 35% Straight / 50% FixedReset & FloatingReset (The latter figures include allocations from those usually grouped as ‘Scraps’). Given that the indices are roughly 30% Straight / 60% FixedReset & FloatingReset, it is apparent that the fund was extremely overweighted in Straights / underweighted in FixedResets in May 2014 and that this qualitative tilt remains, but is no longer extreme. However, HIMIPref™ analytics have been heavily favouring low-spread issues and the fund’s holdings are overwhelmingly of this type.

Summarizing the charts above in tabular form, we see:

FixedReset Straight Take-out
December 2013
Take-out
MAPF Trade
Take-out
December 2014
Take-out
January 2014
Take-out
February 2014
GWO.PR.N
3.65%+130
GWO.PR.I
4.5%
($0.04) $1.00 $2.95 $5.80 $6.25
SLF.PR.G
4.35%+141
SLF.PR.D
4.45%
($1.29) $0.25 $2.16 $6.12 $6.45
MFC.PR.F
4.20%+141
MFC.PR.C
4.50%
($1.29) $0.86 $1.20 $5.15 $5.29
BAM.PR.X
4.60%+180
BAM.PR.N
4.75%
($2.06)   $0.17 $4.11 $5.39
FTS.PR.H
4.25%+145
FTS.PR.J
4.75%
$0.60   $5.68 $7.36 $8.47
PWF.PR.P
4.40%+160
PWF.PR.S
4.80%
($0.67)   $3.00 $6.28 $6.63
The ‘Take-Out’ is the bid price of the Straight less the bid price of the FixedReset; approximate execution prices are used for the “MAPF Trade” column. Bracketted figures in the ‘Take-Out’ columns indicate a ‘Pay-Up’

So why is all this happening? One should take care in explaining market movements, but it is my belief that in the latter half of 2013 we were dealing with the ‘taper tantrum’ – the market’s fears that Fed tapering and subsequent tapering would lead to massive spikes in yields; this led to a great preference for FixedResets over Straights. Now, with the economic news getting less inflationary with every news story and Europe and Japan desperately trying to reflate their sluggish economies, the market seems to think that these rate increases are still a long way off … leading to a great preference for Straights over FixedResets.

In addition, the graphs show a sharp spike in early December, during which the low-spread FixedResets were very badly hurt; I believe this to be due to a combination of tax-loss selling and a panicky response to the 29% reduction in the TRP.PR.A dividend.

And in January it just got worse with Canada yields plummeting after the Bank of Canada rate cut with speculation rife about future cuts although this has recently become less emphatic.

There was some good discussion about what is going on in the comments to the January 29 market action report. I take the view that we’ve seen this show before: during the Credit Crunch, Floaters got hit extremely badly (to the point at which their fifteen year total return was negative) because (as far as I can make out) their dividend rate was dropping (as it was linked to Prime) while the yields on other perpetual preferred instruments were skyrocketing (due to credit concerns). Thus, at least some investors insisted on getting long term corporate yields from rates based on short-term government policy rates. And it’s happening again!

Here’s the February performance for FixedResets that had a YTW Scenario of ‘To Perptuity’ at mid-month. The correlations for both the Pfd-2 Group and the Pfd-3 Group are both so poor that the regression lines are essentially meaningless: 7% and 1%, respectively:

FR_1MoPerf_150227_IRS
Click for Big

However, the chart for the same data showing performance against term-to-reset is significantly better, with correlations of 23% and 7%:

FR_1MoPerf_150227_term
Click for Big