I got curious about this.
The averageTradingValue for an individual issue is calculated as volume-average * flatBidPrice-Average
where
volume – average Report Summary
The volume-average attribute is calculated from volume-spot and the instrumentVolumeInfoDecay parameter using an adjusted exponential moving average. First, if the spot data exceeds the existing average by a factor of more than volumeAveragingCap then the calculation is performed as if the new data was equal to the product of the existing average and the cap factor. This ensures that volume spikes will not affect the system’s perception of the issue’s liquidity – spikes may occur, for instance, when a major shareholder sells a major block. Secondly, if existing average exceeds the spot data by a factor of more than this same volumeAveragingCap, then the damping factor used in the calculation will not be instrumentVolumeInfoDecay, but rather the square of this number. This helps avoid the system assuming greater liquidity in an issue than will otherwise be the case when volume is declining precipituously – immediately after issue, for instance, or after accumulation of a significant block by a “buy-and-hold” investor.
The volume figures for the HIMIPref™ indices are reported as the median averageTradingVolume for the index, where the median is calculated by ordering the constituent issues by averageTradingVolume and taking the median by constituent issue weight; e.g., half the index by weight will have a greater averageTradingValue, half will have less.
The reported volume for the FixedReset index has been boosted by the flood of new issues; a new issue’s AverageTradingValue is set by default to $2.5-million, which will usually increase a bit in the period immediately after issue and then decay until it reaches an equilibrium figure. These new issues, with the large AverageTradingValues, have influenced the reported average greatly by two mechanisms:
- the median issue has almost always not reached equilibrium on calculation date
- the issue chosen as the median has generally been in the middle of a gap, resulting in jumps when the weight of new issues changes the median
So, anyway, I thought I’d plot the reported figures and compare them with a mature market, PerpetualDiscounts. The influence of the tax-loss-selling-end-of-the-universe frenzy can be clearly seen in the latter plot.
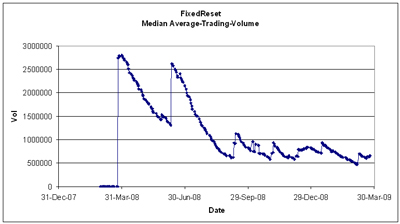
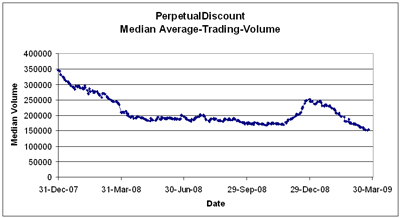
It sure looks like the fixed reset pref has stolen some of the trading volume from discount prefs. Your median fixed reset has 4X the liquidity of the median perpetual discount, and perpetuals volume is drying up to new record lows as the issues get so old people forget what they were all about!
For a perpetual with 0.1% (or less) volume per trading day, they are turning over at only 15-25% per year. I fear that like BCE, which has many series of fixed-floater prefs and seems to have abandoned perpetuals, everybody else might abandon them too! Maybe they were all just sold in an environment of unsustainably low pref yields (a perpetual pref bubble) and we have to wait for another similar bubble to come around to see any more. [Who knows, maybe we are having a fixed reset bubble right now….]
To the extent there is an illiquidity premium, it is one explanation for higher yields on perpetuals than fixed resets, and it will probably get worse. I wonder if it will get worse faster than we accumulate our higher yields.
To the extent there is an illiquidity premium, it is one explanation for higher yields on perpetuals than fixed resets, and it will probably get worse.
All I can say is that my analysis is not showing an illiquidity premium; I haven’t seen such a thing since 2007 – although that might have been a proxy for a new issue premium.
There may well be an illiquidity premium that is being masked by the floating rate premium that I apply to both FixedResets & FixedFloaters; all I can say is that I don’t see it.
[…] 4.26% on the month, while FixedResets are up 2.40%. Average Trading Volume of the former continues its gradual decline, but I see no reason to panic as yet. Who knows, maybe some people simply gave up trading for […]
[…] lower and issues with an Average Trading Value (calculated with HIMIPref™ methodology, which is relatively complex) of less than $25,000. The issues considered “Scraps” are subdivided into indices which […]
[…] lower and issues with an Average Trading Value (calculated with HIMIPref™ methodology, which is relatively complex) of less than $25,000. The issues considered “Scraps” are subdivided into indices which […]
[…] lower and issues with an Average Trading Value (calculated with HIMIPref™ methodology, which is relatively complex) of less than $25,000. The issues considered “Scraps” are subdivided into indices which […]
[…] lower and issues with an Average Trading Value (calculated with HIMIPref™ methodology, which is relatively complex) of less than $25,000. The issues considered “Scraps” are subdivided into indices which […]
[…] lower and issues with an Average Trading Value (calculated with HIMIPref™ methodology, which is relatively complex) of less than $25,000. The issues considered “Scraps” are subdivided into indices which […]
[…] and issues with an Average Trading Value (calculated with HIMIPref™ methodology, which is relatively complex) of less than $25,000. The issues considered “Scraps” are subdivided into indices which […]
[…] lower and issues with an Average Trading Value (calculated with HIMIPref™ methodology, which is relatively complex) of less than $25,000. The issues considered “Scraps” are subdivided into indices which […]
[…] lower and issues with an Average Trading Value (calculated with HIMIPref™ methodology, which is relatively complex) of less than $25,000. The issues considered “Scraps” are subdivided into indices which […]
[…] lower and issues with an Average Trading Value (calculated with HIMIPref™ methodology, which is relatively complex) of less than $25,000. The issues considered “Scraps” are subdivided into indices which […]