Performance of the HIMIPref™ Indices for Performance, 2009, was:
| Total Return | ||
| Index | Performance August 2009 |
Three Months to August 31, 2009 |
| Ratchet | +19.52% * | +12.73% * |
| FixFloat | +24.66% | +28.42% |
| Floater | +19.52% | +12.73% |
| OpRet | +1.31% | +5.23% |
| SplitShare | +4.32% | +13.37% |
| Interest | +1.31%**** | +5.34%**** |
| PerpetualPremium | +2.09% | +9.74%*** |
| PerpetualDiscount | +6.42% | +14.39% |
| FixedReset | +0.47% | +6.31% |
| * The last member of the RatchetRate index was transferred to Scraps at the February, 2009, rebalancing; subsequent performance figures are set equal to the Floater index | ||
| *** The last member of the PerpetualPremium index was transferred to PerpetualDiscount at the October, 2008, rebalancing; subsequent performance figures are set equal to the PerpetualDiscount index. The PerpetualPremium index acquired four new members at the July, 2009, rebalancing. | ||
| **** The last member of the InterestBearing index was transferred to Scraps at the June, 2009, rebalancing; subsequent performance figures are set equal to the OperatingRetractible index | ||
| Passive Funds (see below for calculations) | ||
| CPD | +3.11% | +8.03% |
| DPS.UN | +5.71% | +12.93% |
| Index | ||
| BMO-CM 50 | +4.76% | +11.19% |
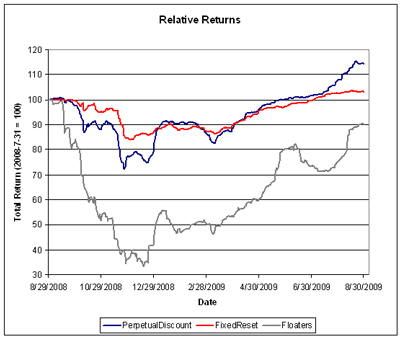
PerpetualDiscounts had a very good month, moving their trailing one-year performance decisively into the black, while the weaknesses of the FixedReset asset class (relatively recently issued at their call price with a near-term call for the issuer) started to make themselves apparent. At the median YTW of about 4%, expected monthly return is about 0.33% and they did better than that this month. I suspect that any significant future gains in index value will result from capture of new-issue concessions … but with forty member in the index that won’t amount to much, and the recent new issue announcements (BPO 6.75%+417, DC, 6.75%+410, WES Convertible, ETC, 7.25%+453) have been of relatively low credit quality.
I won’t make any bets on where the next preferred share market unhappiness is going to come from … but I’ll make a guess!
Meanwhile, Floaters continued their wild ride.
Update Oopsy! I forgot to change the label for the y-axis in the above graph … total returns are normalized to 2008-08-29 = 100.0.
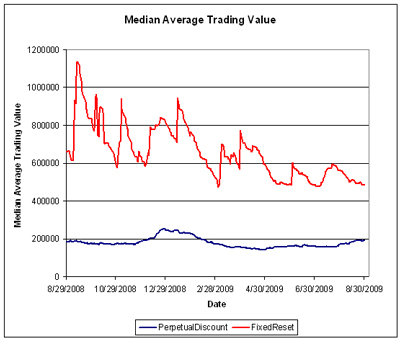
The calculation of the Median Average Trading Value for the FixedReset index is plagued by technical factors and cannot be considered the most reliable statistic in the world – but a downward trend as prior issues become seasoned and the flood of new issues turns to a trickle (which has both a technical effect and a real effect: a constant stream of new issues can keep an entire market liquid) is quite apparent. When they first appeared, I suspected that they would eventually become significantly less liquid than PerpetualDiscounts … not there yet, not even close, but we will see!
Claymore has published NAV and distribution data (problems with the page in IE8 can be kludged by using compatibility view) for its exchange traded fund (CPD) and I have derived the following table:
| CPD Return, 1- & 3-month, to August, 2009 | ||||
| Date | NAV | Distribution | Return for Sub-Period | Monthly Return |
| May 29, 2009 | 15.88 | 0.00 | ||
| June 25 | 15.88 | 0.2100 | +1.32% | +1.38% |
| June 30, 2009 | 15.89 | +0.06% | ||
| July 31, 2009 | 16.42 | +3.35% | ||
| August 31, 2009 | 16.93 | 0.00 | +3.11% | |
| Quarterly Return | +8.03% | |||
Claymore currently holds $275,986,648 (advisor & common combined) in CPD assets, a stunning increase from the $84,005,161 reported in the Dec 31/08 Annual Report.
The DPS.UN NAV for August 26 has been published so we may calculate the approximate August returns.
| DPS.UN NAV Return, August-ish 2009 | |||
| Date | NAV | Distribution | Return for period |
| Estimated July Ending Stub | -0.61% * | ||
| July 29, 2009 | 19.03 | ||
| August 26, 2009 | 20.30 | +6.67% | |
| Estimated August Ending Stub | -0.29% ** | ||
| Estimated August Return | +5.71% | ||
| * CPD had a NAV of $16.32 on July 29 and a NAV of $16.42 on July 31. The return for the period was therefore +0.61%. This figure is subtracted from the DPS.UN period return to arrive at an estimate for the calendar month. | |||
| ** CPD had a NAV of $16.98 on August 26 and a NAV of $16.93 on August 31. The return for the period was therefore -0.29%. This figure is added to the DPS.UN period return to arrive at an estimate for the calendar month. | |||
| The August return for DPS.UN’s NAV is therefore the product of three period returns, -0.61%, +6.67% and -0.29% to arrive at an estimate for the calendar month of +5.71% | |||
Now, to see the DPS.UN quarterly NAV approximate return, we refer to the calculations for June and July:
| DPS.UN NAV Returns, three-month-ish to end-August-ish, 2009 | |
| June-ish | +2.28% |
| July-ish | +4.45% |
| August-ish | +5.71% |
| Three-months-ish | +12.93% |


[…] performed well as the preferred share recovery now looks pretty solid. As noted in the report of Index Performance, August 2009, PerpetualDiscounts posted very strong gains over the month, while FixedResets managed to […]
[…] Now, to see the DPS.UN quarterly NAV approximate return, we refer to the calculations for July and August: […]
[…] to see the DPS.UN quarterly NAV approximate return, we refer to the calculations for August and […]