AER.PR.A: Ticker Change to AIM.PR.A

October 6th, 2011

Aimia, formerly known as Groupe Aeroplan, has announced:

Groupe Aeroplan Inc., now carrying on business as Aimia today reconfirmed that, effective October 7, 2011, the company’s ticker symbols on Toronto Stock Exchange will be changed and its common shares and cumulative rate reset preferred shares, Series 1 will begin trading under the symbols AIM and AIM.PR.A, respectively.

The ticker symbol changes follow the announcement earlier this week of the company’s new name and global brand identity.

“As announced earlier this week, we selected our new name, Aimia, to represent the full-suite, global loyalty business that we have become,” said Rupert Duchesne, President and CEO of Aimia. “It encompasses our straightforward passion to build long term, profitable relationships and our goal to become the recognized global leader in loyalty management.”

The proxy circular for the next Annual Meeting of Shareholders will include a proposal to amend the company’s articles of incorporation to change its corporate name to Aimia Inc.

DPS.UN to Reduce Distribution to $1 / year

October 6th, 2011

Sentry Select has announced:

Diversified Preferred Share Trust (the “Trust”) (TSX:DPS.UN) announces a change to its quarterly distribution rate from $0.30 per unit to $0.25 per unit, effective with the fourth-quarter distribution, payable on January 13, 2012 to unitholders of record on December 30, 2011.

The fundamental reason for the change in the quarterly distribution rate is the significant downward movement in Canadian interest rates over the last several years. This low interest rate environment has resulted in a decline in the average yield of the Trust’s portfolio. Consequently, the Trust’s Board of Directors has deemed it reasonable to change the Trust’s distribution rate to a more sustainable level

DBRS has maintained its rating at STA-3:

DBRS has today confirmed the stability rating of STA-3 (high) on the retractable units (the Units) issued by Diversified Preferred Share Trust (the Trust).

Proceeds from the Trust’s offerings have been used to invest in a diversified portfolio (the Portfolio) of preferred shares and securities. The Portfolio is passively managed by Sentry Investment Inc. (the Administrator).

The current weighted average yield of the Portfolio is approximately 4.95%. The Trust has been making quarterly distributions to the Unitholders equal to $0.30 per unit, yielding 4.80% per annum on the unit issue price of $25. The amount of the distribution and the net asset value (NAV) of the Portfolio may vary in accordance with the credit profile of each of the Portfolio’s underlying securities, prevailing interest rates and rate change expectations, and any losses or gains on rebalancing the Portfolio. On September 26, 2011, the Trust announced a change in the quarterly distribution rate from $0.30 per unit to $0.25 per unit, effective with the fourth-quarter distribution, payable on January 13, 2012, to unitholders of record on December 30, 2011. The change in the dividend amount will remain as such until further guidance is provided by the Trust. The Trust’s net income can currently cover approximately 77% of the distributions paid out to the unitholders. The reduction in the distribution rate will be of benefit to the shortfall in portfolio income relative to the distribution paid out to the Trust’s unitholder. The distribution coverage would increase from 77% to 92% if the new distribution rate is applied. The rating of STA-3 (high) is considered sufficient based on the change in distribution rate and other factors such as asset composition, credit quality and diversification of the Trust’s Portfolio, among others.

October 5, 2011

October 5th, 2011

Either nothing happened today, or I was busy. One or the other.

Well, I noticed one thing:

The University of Toronto is the lone Canadian school to crack the top 20 in the Times Higher Education World University Rankings, which many consider higher education’s most influential global rating system.

Two other flagship Canadian schools made noteworthy gains, with the University of British Columbia jumping to 22nd place from 30th, and McGill University rising to 28th from 35th.

McMaster University (65), the University of Alberta (100) and the University of Montreal (104) all improved their standing, while the University of Victoria slipped from 130th to 177th after entering the top 200 for the first time last year.

Queen’s University, which had refused to submit data in past years, chose to participate and placed 173rd. The University of Ottawa was Canada’s other new entrant, at 185th. Dalhousie University and Simon Fraser University both fell out of the top 200 after coming in 193rd and 199th respectively last year.

It was a mixed day for the Canadian preferred share market, with PerpetualDiscounts up 13bp, FixedResets winning 28bp, while DeemedRetractibles were down 11bp – the last being heavily influenced by SLF issues which dominated the downside of the Performance Table. Volatility was quite good, but volume continued to be below average.

PerpetualDiscounts now yield 5.53%, equivalent to 7.19% interest at the standard equivalency factor of 1.3x. Long Corporates continue to yield about 4.8% (maybe a little under) so the pre-tax interest-equivalent spread (also called the Seniority Spread) is now about 240bp, a sharp rise from the 215bp recorded on September 30, due entirely to weakness in PerpetualDiscounts.

HIMIPref™ Preferred Indices
These values reflect the December 2008 revision of the HIMIPref™ Indices

Values are provisional and are finalized monthly
Index Mean
Current
Yield
(at bid)
Median
YTW
Median
Average
Trading
Value
Median
Mod Dur
(YTW)
Issues Day’s Perf. Index Value
Ratchet 0.00 % 0.00 % 0 0.00 0 -1.3282 % 1,934.4
FixedFloater 0.00 % 0.00 % 0 0.00 0 -1.3282 % 2,909.3
Floater 3.72 % 3.73 % 53,090 18.04 2 -1.3282 % 2,088.6
OpRet 4.86 % 4.11 % 57,129 1.58 8 -0.0146 % 2,435.8
SplitShare 5.46 % 1.79 % 52,890 0.40 4 -0.3157 % 2,453.9
Interest-Bearing 0.00 % 0.00 % 0 0.00 0 -0.0146 % 2,227.3
Perpetual-Premium 5.73 % 5.23 % 110,508 1.92 13 0.2489 % 2,109.2
Perpetual-Discount 5.45 % 5.53 % 110,067 14.64 17 0.1321 % 2,214.6
FixedReset 5.18 % 3.42 % 204,884 2.63 61 0.2821 % 2,309.9
Deemed-Retractible 5.13 % 4.65 % 228,749 6.04 46 -0.1139 % 2,168.0
Performance Highlights
Issue Index Change Notes
SLF.PR.D Deemed-Retractible -2.48 % YTW SCENARIO
Maturity Type : Hard Maturity
Maturity Date : 2022-01-31
Maturity Price : 25.00
Evaluated at bid price : 20.04
Bid-YTW : 7.26 %
BAM.PR.B Floater -2.29 % YTW SCENARIO
Maturity Type : Limit Maturity
Maturity Date : 2041-10-05
Maturity Price : 14.07
Evaluated at bid price : 14.07
Bid-YTW : 3.75 %
SLF.PR.B Deemed-Retractible -2.00 % YTW SCENARIO
Maturity Type : Hard Maturity
Maturity Date : 2022-01-31
Maturity Price : 25.00
Evaluated at bid price : 21.61
Bid-YTW : 6.69 %
SLF.PR.E Deemed-Retractible -1.94 % YTW SCENARIO
Maturity Type : Hard Maturity
Maturity Date : 2022-01-31
Maturity Price : 25.00
Evaluated at bid price : 20.20
Bid-YTW : 7.22 %
BAM.PR.N Perpetual-Discount -1.87 % YTW SCENARIO
Maturity Type : Limit Maturity
Maturity Date : 2041-10-05
Maturity Price : 21.02
Evaluated at bid price : 21.02
Bid-YTW : 5.69 %
SLF.PR.C Deemed-Retractible -1.81 % YTW SCENARIO
Maturity Type : Hard Maturity
Maturity Date : 2022-01-31
Maturity Price : 25.00
Evaluated at bid price : 20.10
Bid-YTW : 7.22 %
SLF.PR.A Deemed-Retractible -1.36 % YTW SCENARIO
Maturity Type : Hard Maturity
Maturity Date : 2022-01-31
Maturity Price : 25.00
Evaluated at bid price : 21.80
Bid-YTW : 6.52 %
BNA.PR.E SplitShare -1.10 % YTW SCENARIO
Maturity Type : Hard Maturity
Maturity Date : 2017-12-10
Maturity Price : 25.00
Evaluated at bid price : 22.50
Bid-YTW : 6.99 %
CIU.PR.A Perpetual-Discount -1.05 % YTW SCENARIO
Maturity Type : Limit Maturity
Maturity Date : 2041-10-05
Maturity Price : 22.26
Evaluated at bid price : 22.56
Bid-YTW : 5.14 %
PWF.PR.E Perpetual-Discount 1.03 % YTW SCENARIO
Maturity Type : Limit Maturity
Maturity Date : 2041-10-05
Maturity Price : 24.31
Evaluated at bid price : 24.60
Bid-YTW : 5.58 %
ELF.PR.F Perpetual-Discount 1.12 % YTW SCENARIO
Maturity Type : Limit Maturity
Maturity Date : 2041-10-05
Maturity Price : 21.75
Evaluated at bid price : 21.75
Bid-YTW : 6.12 %
TD.PR.R Deemed-Retractible 1.18 % YTW SCENARIO
Maturity Type : Call
Maturity Date : 2013-04-30
Maturity Price : 26.00
Evaluated at bid price : 26.60
Bid-YTW : 4.49 %
TRP.PR.C FixedReset 1.20 % YTW SCENARIO
Maturity Type : Limit Maturity
Maturity Date : 2041-10-05
Maturity Price : 23.34
Evaluated at bid price : 25.40
Bid-YTW : 2.96 %
PWF.PR.K Perpetual-Discount 1.20 % YTW SCENARIO
Maturity Type : Limit Maturity
Maturity Date : 2041-10-05
Maturity Price : 23.71
Evaluated at bid price : 24.00
Bid-YTW : 5.15 %
BMO.PR.J Deemed-Retractible 1.25 % YTW SCENARIO
Maturity Type : Call
Maturity Date : 2016-02-25
Maturity Price : 25.00
Evaluated at bid price : 25.17
Bid-YTW : 4.48 %
GWO.PR.J FixedReset 1.35 % YTW SCENARIO
Maturity Type : Call
Maturity Date : 2013-12-31
Maturity Price : 25.00
Evaluated at bid price : 26.20
Bid-YTW : 3.81 %
MFC.PR.D FixedReset 1.59 % YTW SCENARIO
Maturity Type : Call
Maturity Date : 2014-06-19
Maturity Price : 25.00
Evaluated at bid price : 26.22
Bid-YTW : 4.82 %
IAG.PR.C FixedReset 2.63 % YTW SCENARIO
Maturity Type : Call
Maturity Date : 2013-12-31
Maturity Price : 25.00
Evaluated at bid price : 26.18
Bid-YTW : 4.04 %
BAM.PR.X FixedReset 2.85 % YTW SCENARIO
Maturity Type : Limit Maturity
Maturity Date : 2041-10-05
Maturity Price : 22.48
Evaluated at bid price : 23.45
Bid-YTW : 3.73 %
BAM.PR.T FixedReset 3.15 % YTW SCENARIO
Maturity Type : Limit Maturity
Maturity Date : 2041-10-05
Maturity Price : 22.97
Evaluated at bid price : 24.55
Bid-YTW : 3.87 %
GWO.PR.N FixedReset 3.61 % YTW SCENARIO
Maturity Type : Hard Maturity
Maturity Date : 2022-01-31
Maturity Price : 25.00
Evaluated at bid price : 23.84
Bid-YTW : 3.68 %
Volume Highlights
Issue Index Shares
Traded
Notes
ENB.PR.B FixedReset 172,424 Recent new issue.
YTW SCENARIO
Maturity Type : Limit Maturity
Maturity Date : 2041-10-05
Maturity Price : 23.18
Evaluated at bid price : 25.17
Bid-YTW : 3.66 %
TRP.PR.B FixedReset 99,344 Scotio bought 10,000 from RBC at 25.00, then another 10,000 from TD at the same price. RBC crossed 14,900 at 25.00; Scotia crossed 10,700 at the same price.
YTW SCENARIO
Maturity Type : Limit Maturity
Maturity Date : 2041-10-05
Maturity Price : 23.29
Evaluated at bid price : 25.05
Bid-YTW : 2.71 %
TD.PR.K FixedReset 80,021 RBC bought blocks of 10,000 and 20,000 from anonymous at 27.05; also crossed 30,000 at the same price.
YTW SCENARIO
Maturity Type : Call
Maturity Date : 2014-07-31
Maturity Price : 25.00
Evaluated at bid price : 27.15
Bid-YTW : 3.47 %
CM.PR.J Deemed-Retractible 78,672 National crossed 65,000 at 25.05.
YTW SCENARIO
Maturity Type : Call
Maturity Date : 2016-04-30
Maturity Price : 25.00
Evaluated at bid price : 24.92
Bid-YTW : 4.52 %
RY.PR.X FixedReset 61,270 TD crossed 35,000 at 27.05; RBC crossed 25,000 at the same price.
YTW SCENARIO
Maturity Type : Call
Maturity Date : 2014-08-24
Maturity Price : 25.00
Evaluated at bid price : 27.10
Bid-YTW : 3.46 %
MFC.PR.B Deemed-Retractible 60,431 TD bought blocks of 11,600 and 13,400 from Nesbitt, both at 21.00.
YTW SCENARIO
Maturity Type : Hard Maturity
Maturity Date : 2022-01-31
Maturity Price : 25.00
Evaluated at bid price : 21.55
Bid-YTW : 6.58 %
There were 28 other index-included issues trading in excess of 10,000 shares.
Wide Spread Highlights
Issue Index Quote Data and Yield Notes
MFC.PR.B Deemed-Retractible Quote: 21.55 – 22.21
Spot Rate : 0.6600
Average : 0.4013

YTW SCENARIO
Maturity Type : Hard Maturity
Maturity Date : 2022-01-31
Maturity Price : 25.00
Evaluated at bid price : 21.55
Bid-YTW : 6.58 %

BAM.PR.O OpRet Quote: 25.40 – 26.18
Spot Rate : 0.7800
Average : 0.5315

YTW SCENARIO
Maturity Type : Option Certainty
Maturity Date : 2013-06-30
Maturity Price : 25.00
Evaluated at bid price : 25.40
Bid-YTW : 4.11 %

PWF.PR.P FixedReset Quote: 25.10 – 25.59
Spot Rate : 0.4900
Average : 0.3148

YTW SCENARIO
Maturity Type : Limit Maturity
Maturity Date : 2041-10-05
Maturity Price : 23.25
Evaluated at bid price : 25.10
Bid-YTW : 3.07 %

NA.PR.P FixedReset Quote: 26.41 – 26.93
Spot Rate : 0.5200
Average : 0.3583

YTW SCENARIO
Maturity Type : Call
Maturity Date : 2014-02-15
Maturity Price : 25.00
Evaluated at bid price : 26.41
Bid-YTW : 3.78 %

TD.PR.P Deemed-Retractible Quote: 26.05 – 26.61
Spot Rate : 0.5600
Average : 0.4003

YTW SCENARIO
Maturity Type : Call
Maturity Date : 2016-11-01
Maturity Price : 25.00
Evaluated at bid price : 26.05
Bid-YTW : 4.55 %

MFC.PR.E FixedReset Quote: 25.30 – 25.69
Spot Rate : 0.3900
Average : 0.2589

YTW SCENARIO
Maturity Type : Hard Maturity
Maturity Date : 2022-01-31
Maturity Price : 25.00
Evaluated at bid price : 25.30
Bid-YTW : 4.82 %

Who's Selling All the SLF Preferreds?

October 5th, 2011

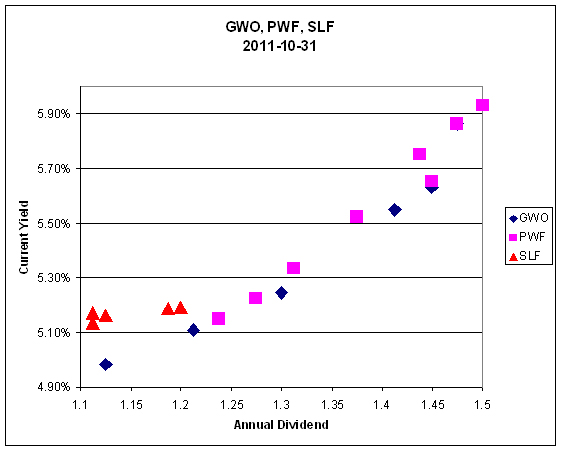
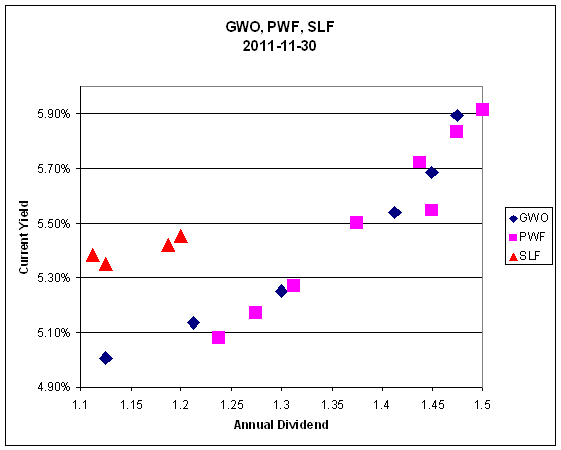
I got a call today from an investor concerned about the recent performance of the SLF preferreds. This poor performance is well illustrated by the following three graphs, which plot Current Yield against Annual Dividend.


Click for big


Click for Big


Click for Big

As may be seen, the prices of the SLF preferreds have changed so that their Current Yields are now significantly higher than what they would be if they had maintained their relationship (shown on the 9/9 chart) with the GWO and PWF preferreds (note that GWO and SLF issues plotted are DeemedRetractibles; the PWFs are Straight Perpetuals and should have current yields greater than the other two issuers’ preferreds, but don’t. The market hasn’t been pricing in any possibility of regulatory redemption in 2022-1-31!

So what’s the problem? The only news of note lately has been the SLF purchase of McLean Budden, which doesn’t sound like a big deal. SLF common hit a new 52-week low on the NYSE recently, but a comparison of common prices for the three dates doesn’t really provide any clues:

Comparitive Common Prices
Date SLF GWO PWF
9/9 24.68 20.70 25.47
9/30 25.03 20.61 25.66
10/5 24.93 20.88 25.55

In the absence of news or a confirming signal from the common I have to conclude that the variance from the relationship with the other two series of preferreds examined is due to liquidity pressures – in other words, I think somebody’s selling a whack of these things and is taking a big market impact cost in order to do so.

October 4, 2011

October 4th, 2011

Shades of ’08!

The cost to protect the debt of Morgan Stanley (MS) and Goldman Sachs Group Inc. (GS) surged to the highest levels since the weeks after Lehman Brothers Holdings Inc.’s bankruptcy as concern intensified that Europe’s debt crisis will infect the global banking system.

Contracts on Morgan Stanley, the New York-based owner of the world’s largest retail brokerage, soared 92 basis points to a mid-price of 583 basis points as of 4:30 p.m. in New York, the highest since October 2008, according to London-based data provider CMA. Those on Goldman Sachs increased 65 basis points to a mid-price of 395.

Traders pushed the cost of protecting banks and U.S. companies higher after German Finance Minister Wolfgang Schaeuble opposed moves to increase the scale of the euro rescue fund, complicating efforts to prevent a Greek default. Swaps on Bank of America Corp. (BAC) jumped to a record and a measure of U.S. corporate credit risk rose to the most since May 2009.

Knock-on effects are everywhere!

Real estate investment trusts that buy U.S. mortgage debt tumbled to the steepest losses since December 2008, on concern that their main source of financing will be roiled by European bank woes.

Mortgage REITs including Annaly Capital Management Inc. (NLY) and American Capital Agency Corp. (AGNC) dropped as much as 6 percent today, according to a Bloomberg index tracking 33 shares. Losses over the past two days reached as much as 11.1 percent, the biggest fall in almost three years. The shares pared today’s declines to 2.6 percent at 1:50 p.m. in New York.

France and Belgium pledged today to support Dexia SA after the bank’s board met to discuss a possible break-up as Europe’s sovereign-debt crisis reduced its ability to obtain funding. While the repurchase-agreement, or repo, market for government- backed mortgage bonds that many REITS rely on for funding is in “good” shape, it may face pressure if European banks need to retrench, American Capital President Gary Kain said.

Moody’s slashed Italy’s rating three notches:

Italy’s credit rating was cut by Moody’s Investors Service for the first time in almost two decades on concern that Prime Minister Silvio Berlusconi’s government will struggle to reduce the region’s second-largest debt amid chronically weak growth.

Moody’s lowered Italy’s rating three levels to A2 from Aa2, with a negative outlook, the New York-based company said in a statement yesterday. The action comes after Standard & Poor’s downgraded Italy on Sept. 20 for the first time in five years. Italy was last cut by Moody’s in May 1993.

Italy gave final approval last month to a 54 billion-euro ($72 billion) austerity plan aimed at balancing the budget in 2013 that convinced the European Central Bank to buy the nation’s bonds. While the purchases initially brought down bond yields by about 100 basis points, Italy’s borrowing costs remain near record highs because of euro-area debt crisis contagion.

DBRS confirmed ALA.PR.A at Pfd-3:

DBRS has today confirmed the rating on the Medium-Term Notes (MTNs) and Preferred Shares – Cumulative of AltaGas Ltd. (AltaGas or the Company) at BBB and Pfd-3, respectively, both with Stable trends. The confirmation reflects: (1) continuing progress on the Company’s goal to grow and diversify earnings and cash flow while reducing its relative business risk; (2) proactive mitigation of cost overrun risks on its major growth projects; and (3) a prudent financing plan for the 2011 to 2014 growth phase supported by a strong liquidity position. However, DBRS expects some deterioration in the Company’s key credit metrics during the above-noted construction period, with recovery toward the end of the period as expected cash shortfalls are to be primarily funded by debt.

First National, proud issuer of FN.PR.A, has a timing problem:

First National Financial Corporation (TSX: FN) (the “Company” or “FNFC”) today announced its revenue and income before income taxes for the quarter ended September 30, 2011 will both be decreased by approximately $18 million due to realized and unrealized losses on financial instruments. The losses pertain to instruments used for interest rate hedging purposes on mortgages pending securitization. From an economic perspective, to the extent the value of these hedges was unfavourable at September 30, 2011, the value of the hedged mortgages has increased; however, unlike the hedge losses that have been accounted for fully in the third quarter of 2011, the increased value of the mortgages will be recognized as earned over the five- and 10-year terms of the mortgages.

DBRS is unconcerned:

DBRS has today reviewed the announcement by First National Financial Corporation (FNF; rated BBB and Pfd-3 with Stable trends) that third-quarter revenue and pre-tax income would be reduced by approximately $18 million as a result of realized and unrealized losses on financial instruments. There are no rating implications at this time.

While the reduction in pre-tax income is material (it suggests Q3 2011 earnings will be approximately one-third of Q2 2011 earnings), DBRS views the reduction as an accounting timing issue only. Specifically, the value of the vehicle used to hedge interest-rate risk declined (which under International Financial Reporting Standards (IFRS) is reported in the current period), offset by an equivalent increase in the value of the underlying mortgage assets (which will be recognized in earnings over the life of the asset).

The unusually large size of the unrealized loss is related to the reduction in long-term interest rates during the quarter. There are no regulatory capital implications because FNF is not regulated by the Office of the Superintendent of Financial Institutions (OSFI).

Thomson Reuters, proud issuer of TRI.PR.B is locking in current rates for a while:

Standard & Poor’s Ratings Services today said it assigned its ‘A-‘ debt rating to New York-based information solutions provider Thomson Reuters Corp.’s US$350 million 3.95% senior unsecured notes due 2021. We understand that Thomson Reuters will use the proceeds to repay borrowings under its commercial paper program.

It was a very nasty day for the Canadian preferred share market, with PerpetualDiscounts losing 104bp, FixedResets down 59bp and DeemedRetractibles off a mere 53bp. Naturally, the volatility table is quite long today! On a brighter note, one of these entries was a gain! Volume improved from “practically non-existent” to “lousy”.

HIMIPref™ Preferred Indices
These values reflect the December 2008 revision of the HIMIPref™ Indices

Values are provisional and are finalized monthly
Index Mean
Current
Yield
(at bid)
Median
YTW
Median
Average
Trading
Value
Median
Mod Dur
(YTW)
Issues Day’s Perf. Index Value
Ratchet 0.00 % 0.00 % 0 0.00 0 -3.6051 % 1,960.4
FixedFloater 0.00 % 0.00 % 0 0.00 0 -3.6051 % 2,948.5
Floater 3.67 % 3.66 % 163,632 18.18 2 -3.6051 % 2,116.8
OpRet 4.86 % 4.06 % 57,506 1.59 8 -0.3159 % 2,436.2
SplitShare 5.45 % 1.78 % 51,288 0.40 4 -0.7203 % 2,461.7
Interest-Bearing 0.00 % 0.00 % 0 0.00 0 -0.3159 % 2,227.6
Perpetual-Premium 5.72 % 5.54 % 111,962 5.73 13 -0.5010 % 2,103.9
Perpetual-Discount 5.44 % 5.55 % 109,832 14.61 17 -1.0413 % 2,211.7
FixedReset 5.19 % 3.43 % 207,409 2.85 61 -0.5897 % 2,303.4
Deemed-Retractible 5.12 % 4.68 % 227,506 7.90 46 -0.5302 % 2,170.5
Performance Highlights
Issue Index Change Notes
GWO.PR.N FixedReset -5.31 % Not real. The issue traded 7,514 shares in a range of 23.85-19 before closing (or “lasting”?) at 23.01-85, 2×14.
YTW SCENARIO
Maturity Type : Hard Maturity
Maturity Date : 2022-01-31
Maturity Price : 25.00
Evaluated at bid price : 23.01
Bid-YTW : 4.09 %
BAM.PR.K Floater -4.31 % YTW SCENARIO
Maturity Type : Limit Maturity
Maturity Date : 2041-10-04
Maturity Price : 14.21
Evaluated at bid price : 14.21
Bid-YTW : 3.71 %
BAM.PR.X FixedReset -3.72 % YTW SCENARIO
Maturity Type : Limit Maturity
Maturity Date : 2041-10-04
Maturity Price : 22.13
Evaluated at bid price : 22.80
Bid-YTW : 3.86 %
ELF.PR.F Perpetual-Discount -3.54 % YTW SCENARIO
Maturity Type : Limit Maturity
Maturity Date : 2041-10-04
Maturity Price : 21.51
Evaluated at bid price : 21.51
Bid-YTW : 6.19 %
ELF.PR.G Perpetual-Discount -3.43 % YTW SCENARIO
Maturity Type : Limit Maturity
Maturity Date : 2041-10-04
Maturity Price : 20.26
Evaluated at bid price : 20.26
Bid-YTW : 5.89 %
MFC.PR.C Deemed-Retractible -3.24 % YTW SCENARIO
Maturity Type : Hard Maturity
Maturity Date : 2022-01-31
Maturity Price : 25.00
Evaluated at bid price : 20.34
Bid-YTW : 7.15 %
BAM.PR.T FixedReset -3.09 % YTW SCENARIO
Maturity Type : Limit Maturity
Maturity Date : 2041-10-04
Maturity Price : 22.66
Evaluated at bid price : 23.80
Bid-YTW : 4.03 %
BAM.PR.B Floater -2.90 % YTW SCENARIO
Maturity Type : Limit Maturity
Maturity Date : 2041-10-04
Maturity Price : 14.40
Evaluated at bid price : 14.40
Bid-YTW : 3.66 %
CIU.PR.A Perpetual-Discount -2.73 % YTW SCENARIO
Maturity Type : Limit Maturity
Maturity Date : 2041-10-04
Maturity Price : 22.47
Evaluated at bid price : 22.80
Bid-YTW : 5.08 %
MFC.PR.E FixedReset -2.28 % YTW SCENARIO
Maturity Type : Hard Maturity
Maturity Date : 2022-01-31
Maturity Price : 25.00
Evaluated at bid price : 25.25
Bid-YTW : 4.84 %
SLF.PR.E Deemed-Retractible -2.28 % YTW SCENARIO
Maturity Type : Hard Maturity
Maturity Date : 2022-01-31
Maturity Price : 25.00
Evaluated at bid price : 20.60
Bid-YTW : 6.96 %
IAG.PR.C FixedReset -2.26 % YTW SCENARIO
Maturity Type : Hard Maturity
Maturity Date : 2022-01-31
Maturity Price : 25.00
Evaluated at bid price : 25.51
Bid-YTW : 4.91 %
BNA.PR.C SplitShare -2.24 % YTW SCENARIO
Maturity Type : Hard Maturity
Maturity Date : 2019-01-10
Maturity Price : 25.00
Evaluated at bid price : 20.55
Bid-YTW : 7.69 %
NA.PR.O FixedReset -1.94 % YTW SCENARIO
Maturity Type : Call
Maturity Date : 2014-02-15
Maturity Price : 25.00
Evaluated at bid price : 27.26
Bid-YTW : 3.03 %
SLF.PR.C Deemed-Retractible -1.82 % YTW SCENARIO
Maturity Type : Hard Maturity
Maturity Date : 2022-01-31
Maturity Price : 25.00
Evaluated at bid price : 20.47
Bid-YTW : 6.99 %
TD.PR.R Deemed-Retractible -1.72 % YTW SCENARIO
Maturity Type : Call
Maturity Date : 2015-04-30
Maturity Price : 25.50
Evaluated at bid price : 26.29
Bid-YTW : 4.86 %
GWO.PR.M Deemed-Retractible -1.49 % YTW SCENARIO
Maturity Type : Call
Maturity Date : 2019-03-31
Maturity Price : 25.00
Evaluated at bid price : 25.12
Bid-YTW : 5.77 %
BAM.PR.J OpRet -1.47 % YTW SCENARIO
Maturity Type : Soft Maturity
Maturity Date : 2018-03-30
Maturity Price : 25.00
Evaluated at bid price : 26.11
Bid-YTW : 4.64 %
PWF.PR.F Perpetual-Discount -1.40 % YTW SCENARIO
Maturity Type : Limit Maturity
Maturity Date : 2041-10-04
Maturity Price : 24.34
Evaluated at bid price : 24.65
Bid-YTW : 5.41 %
HSB.PR.E FixedReset -1.40 % YTW SCENARIO
Maturity Type : Call
Maturity Date : 2014-06-30
Maturity Price : 25.00
Evaluated at bid price : 26.10
Bid-YTW : 4.94 %
IGM.PR.B Perpetual-Premium -1.37 % YTW SCENARIO
Maturity Type : Call
Maturity Date : 2018-12-31
Maturity Price : 25.00
Evaluated at bid price : 25.15
Bid-YTW : 5.76 %
SLF.PR.F FixedReset -1.32 % YTW SCENARIO
Maturity Type : Call
Maturity Date : 2014-06-30
Maturity Price : 25.00
Evaluated at bid price : 26.25
Bid-YTW : 4.11 %
SLF.PR.D Deemed-Retractible -1.30 % YTW SCENARIO
Maturity Type : Hard Maturity
Maturity Date : 2022-01-31
Maturity Price : 25.00
Evaluated at bid price : 20.55
Bid-YTW : 6.94 %
MFC.PR.F FixedReset -1.21 % YTW SCENARIO
Maturity Type : Hard Maturity
Maturity Date : 2022-01-31
Maturity Price : 25.00
Evaluated at bid price : 24.51
Bid-YTW : 3.73 %
FTS.PR.F Perpetual-Discount -1.18 % YTW SCENARIO
Maturity Type : Limit Maturity
Maturity Date : 2041-10-04
Maturity Price : 24.07
Evaluated at bid price : 24.36
Bid-YTW : 5.07 %
BMO.PR.Q FixedReset -1.15 % YTW SCENARIO
Maturity Type : Hard Maturity
Maturity Date : 2022-01-31
Maturity Price : 25.00
Evaluated at bid price : 24.90
Bid-YTW : 3.32 %
RY.PR.A Deemed-Retractible -1.12 % YTW SCENARIO
Maturity Type : Hard Maturity
Maturity Date : 2022-01-31
Maturity Price : 25.00
Evaluated at bid price : 24.79
Bid-YTW : 4.64 %
BAM.PR.N Perpetual-Discount -1.11 % YTW SCENARIO
Maturity Type : Limit Maturity
Maturity Date : 2041-10-04
Maturity Price : 21.42
Evaluated at bid price : 21.42
Bid-YTW : 5.59 %
MFC.PR.D FixedReset -1.07 % YTW SCENARIO
Maturity Type : Call
Maturity Date : 2014-06-19
Maturity Price : 25.00
Evaluated at bid price : 25.81
Bid-YTW : 5.46 %
PWF.PR.E Perpetual-Discount -1.04 % YTW SCENARIO
Maturity Type : Limit Maturity
Maturity Date : 2041-10-04
Maturity Price : 24.39
Evaluated at bid price : 24.69
Bid-YTW : 5.66 %
BMO.PR.J Deemed-Retractible -1.04 % YTW SCENARIO
Maturity Type : Hard Maturity
Maturity Date : 2022-01-31
Maturity Price : 25.00
Evaluated at bid price : 24.86
Bid-YTW : 4.65 %
SLF.PR.A Deemed-Retractible -1.03 % YTW SCENARIO
Maturity Type : Hard Maturity
Maturity Date : 2022-01-31
Maturity Price : 25.00
Evaluated at bid price : 22.10
Bid-YTW : 6.34 %
SLF.PR.H FixedReset -1.02 % YTW SCENARIO
Maturity Type : Hard Maturity
Maturity Date : 2022-01-31
Maturity Price : 25.00
Evaluated at bid price : 24.30
Bid-YTW : 4.14 %
RY.PR.F Deemed-Retractible -1.00 % YTW SCENARIO
Maturity Type : Hard Maturity
Maturity Date : 2022-01-31
Maturity Price : 25.00
Evaluated at bid price : 24.70
Bid-YTW : 4.68 %
BNS.PR.O Deemed-Retractible 1.54 % YTW SCENARIO
Maturity Type : Call
Maturity Date : 2013-04-26
Maturity Price : 26.00
Evaluated at bid price : 26.40
Bid-YTW : 4.10 %
Volume Highlights
Issue Index Shares
Traded
Notes
ENB.PR.B FixedReset 121,775 Recent new issue.
YTW SCENARIO
Maturity Type : Limit Maturity
Maturity Date : 2041-10-04
Maturity Price : 23.16
Evaluated at bid price : 25.10
Bid-YTW : 3.68 %
TRP.PR.B FixedReset 61,987 RBC crossed 40,000 at 25.00.
YTW SCENARIO
Maturity Type : Limit Maturity
Maturity Date : 2041-10-04
Maturity Price : 23.27
Evaluated at bid price : 24.99
Bid-YTW : 2.72 %
TRP.PR.C FixedReset 44,479 RBC crossed 40,000 at 25.20.
YTW SCENARIO
Maturity Type : Limit Maturity
Maturity Date : 2041-10-04
Maturity Price : 23.25
Evaluated at bid price : 25.10
Bid-YTW : 3.02 %
RY.PR.W Perpetual-Discount 34,978 YTW SCENARIO
Maturity Type : Limit Maturity
Maturity Date : 2041-10-04
Maturity Price : 24.38
Evaluated at bid price : 24.72
Bid-YTW : 5.00 %
NA.PR.O FixedReset 34,225 Nesbitt crossed 28,700 at 27.50.
YTW SCENARIO
Maturity Type : Call
Maturity Date : 2014-02-15
Maturity Price : 25.00
Evaluated at bid price : 27.26
Bid-YTW : 3.03 %
RY.PR.D Deemed-Retractible 33,460 YTW SCENARIO
Maturity Type : Hard Maturity
Maturity Date : 2022-01-31
Maturity Price : 25.00
Evaluated at bid price : 24.87
Bid-YTW : 4.65 %
There were 24 other index-included issues trading in excess of 10,000 shares.
Wide Spread Highlights
Issue Index Quote Data and Yield Notes
GWO.PR.N FixedReset Quote: 23.01 – 23.85
Spot Rate : 0.8400
Average : 0.4832

YTW SCENARIO
Maturity Type : Hard Maturity
Maturity Date : 2022-01-31
Maturity Price : 25.00
Evaluated at bid price : 23.01
Bid-YTW : 4.09 %

TCA.PR.Y Perpetual-Premium Quote: 50.97 – 51.69
Spot Rate : 0.7200
Average : 0.4876

YTW SCENARIO
Maturity Type : Call
Maturity Date : 2014-03-05
Maturity Price : 50.00
Evaluated at bid price : 50.97
Bid-YTW : 4.58 %

TD.PR.R Deemed-Retractible Quote: 26.29 – 26.76
Spot Rate : 0.4700
Average : 0.2870

YTW SCENARIO
Maturity Type : Call
Maturity Date : 2015-04-30
Maturity Price : 25.50
Evaluated at bid price : 26.29
Bid-YTW : 4.86 %

GWO.PR.M Deemed-Retractible Quote: 25.12 – 25.79
Spot Rate : 0.6700
Average : 0.5131

YTW SCENARIO
Maturity Type : Call
Maturity Date : 2019-03-31
Maturity Price : 25.00
Evaluated at bid price : 25.12
Bid-YTW : 5.77 %

PWF.PR.E Perpetual-Discount Quote: 24.69 – 25.10
Spot Rate : 0.4100
Average : 0.2645

YTW SCENARIO
Maturity Type : Limit Maturity
Maturity Date : 2041-10-04
Maturity Price : 24.39
Evaluated at bid price : 24.69
Bid-YTW : 5.66 %

FTS.PR.F Perpetual-Discount Quote: 24.36 – 25.00
Spot Rate : 0.6400
Average : 0.4980

YTW SCENARIO
Maturity Type : Limit Maturity
Maturity Date : 2041-10-04
Maturity Price : 24.07
Evaluated at bid price : 24.36
Bid-YTW : 5.07 %

October 3, 2011

October 3rd, 2011

There is word of a crackdown on “algorithmic” traders:

Algorithmic traders and quant funds are under close scrutiny from a U.S. Securities and Exchange Commission enforcement team responsible for policing hedge funds, the unit’s co-chief said at securities law forum.

The SEC is “very much focused” on possible misconduct by traders who primarily use computer models to execute investment strategies, and more cases in those areas are likely, Bruce Karpati said today during a Practising Law Institute panel discussion in New York. Investigators are zeroing in on firms with “aberrational performance,” he said, without giving details on practices that are under scrutiny.

The February case in which Karpati’s asset-management team accused Axa Rosenberg Group LLC of causing $217 million in customer losses by concealing a coding error was “wake-up a call for all quant managers” to be fully forthcoming about the risks of their strategies, he said at the time. Axa paid $242 million to resolve the claims.

But the quoted example is about quantitative analysis:

In late June 2009, a BRRC employee discovered an error in the Model’s computer code that had been introduced in 2007 and that effectively eliminated one of the key components in the Model for controlling for certain types of risk. This employee later discussed his finding in a meeting with Rosenberg, BRRC’s Director, and a small group of BRRC employees who were working under Rosenberg’s guidance on an enhancement to the Model. Rosenberg directed the others to keep quiet about the error and to not inform others about it, and he directed that the error not be fixed at that time. Before and after discovery of the error, ARIM’s clients were expressing dissatisfaction with their portfolios’ underperformance. During the several months that Rosenberg and the BRRC employees concealed the error, ARG, ARIM, and BRRC failed to disclose the error, misrepresented the Model’s ability to control risk, and ascribed underperformance to market volatility and factors having nothing to do with the error. Due to Rosenberg’s directive, ARG’s Global CEO did not learn of the error as soon as he should have. The error was disclosed to the Global CEO in November 2009. The error impacted more than 600 client portfolios and caused approximately $217 million in losses. ARG disclosed the error to clients on April 15, 2010.

So it’s not all that clear whether the crackdown is on algorithms or quantitative analysis. Reporters generally don’t know the difference.

Carney has assiduously promoted the government line for the past three years – maybe he’ll be rewarded:

The Harper government is pushing for the Bank of Canada Governor to be the next chief of the Financial Stability Board (FSB), the group charged with co-ordinating the overhaul of international banking regulations on behalf of the Group of 20 nations.

It was a grisly day for the Canadian preferred share market, with PerpetualDiscounts off 15bp, FixedResets down 14bp and DeemedRetractibles losing 48bp. Volatility was relatively high, with a big tilt towards the downside. Volume was anemic – more like Christmas than the start of a new quarter.

HIMIPref™ Preferred Indices
These values reflect the December 2008 revision of the HIMIPref™ Indices

Values are provisional and are finalized monthly
Index Mean
Current
Yield
(at bid)
Median
YTW
Median
Average
Trading
Value
Median
Mod Dur
(YTW)
Issues Day’s Perf. Index Value
Ratchet 0.00 % 0.00 % 0 0.00 0 -2.0785 % 2,033.8
FixedFloater 0.00 % 0.00 % 0 0.00 0 -2.0785 % 3,058.7
Floater 3.54 % 3.55 % 54,309 18.44 2 -2.0785 % 2,195.9
OpRet 4.85 % 3.20 % 57,947 1.59 8 0.0389 % 2,443.9
SplitShare 5.41 % -0.47 % 53,080 0.40 4 -0.2813 % 2,479.6
Interest-Bearing 0.00 % 0.00 % 0 0.00 0 0.0389 % 2,234.7
Perpetual-Premium 5.69 % 4.95 % 110,309 0.58 13 -0.2756 % 2,114.5
Perpetual-Discount 5.38 % 5.51 % 110,210 14.66 17 -0.1478 % 2,234.9
FixedReset 5.16 % 3.33 % 208,234 2.71 61 -0.1406 % 2,317.0
Deemed-Retractible 5.09 % 4.60 % 230,334 7.73 46 -0.4838 % 2,182.0
Performance Highlights
Issue Index Change Notes
IAG.PR.A Deemed-Retractible -2.95 % YTW SCENARIO
Maturity Type : Hard Maturity
Maturity Date : 2022-01-31
Maturity Price : 25.00
Evaluated at bid price : 21.72
Bid-YTW : 6.40 %
BAM.PR.K Floater -2.30 % YTW SCENARIO
Maturity Type : Limit Maturity
Maturity Date : 2041-10-03
Maturity Price : 14.85
Evaluated at bid price : 14.85
Bid-YTW : 3.55 %
SLF.PR.B Deemed-Retractible -1.90 % YTW SCENARIO
Maturity Type : Hard Maturity
Maturity Date : 2022-01-31
Maturity Price : 25.00
Evaluated at bid price : 22.25
Bid-YTW : 6.31 %
BAM.PR.B Floater -1.85 % YTW SCENARIO
Maturity Type : Limit Maturity
Maturity Date : 2041-10-03
Maturity Price : 14.83
Evaluated at bid price : 14.83
Bid-YTW : 3.56 %
MFC.PR.D FixedReset -1.62 % YTW SCENARIO
Maturity Type : Call
Maturity Date : 2014-06-19
Maturity Price : 25.00
Evaluated at bid price : 26.09
Bid-YTW : 5.01 %
BNS.PR.O Deemed-Retractible -1.52 % YTW SCENARIO
Maturity Type : Call
Maturity Date : 2015-04-28
Maturity Price : 25.50
Evaluated at bid price : 26.00
Bid-YTW : 4.78 %
BAM.PR.M Perpetual-Discount -1.33 % YTW SCENARIO
Maturity Type : Limit Maturity
Maturity Date : 2041-10-03
Maturity Price : 21.58
Evaluated at bid price : 21.58
Bid-YTW : 5.54 %
PWF.PR.P FixedReset -1.32 % YTW SCENARIO
Maturity Type : Limit Maturity
Maturity Date : 2041-10-03
Maturity Price : 23.34
Evaluated at bid price : 25.38
Bid-YTW : 3.07 %
W.PR.H Perpetual-Discount -1.24 % YTW SCENARIO
Maturity Type : Limit Maturity
Maturity Date : 2041-10-03
Maturity Price : 24.30
Evaluated at bid price : 24.59
Bid-YTW : 5.60 %
BNA.PR.E SplitShare -1.22 % YTW SCENARIO
Maturity Type : Hard Maturity
Maturity Date : 2017-12-10
Maturity Price : 25.00
Evaluated at bid price : 22.69
Bid-YTW : 6.82 %
PWF.PR.G Perpetual-Premium -1.15 % YTW SCENARIO
Maturity Type : Limit Maturity
Maturity Date : 2041-10-03
Maturity Price : 24.69
Evaluated at bid price : 25.01
Bid-YTW : 6.00 %
GWO.PR.H Deemed-Retractible -1.14 % YTW SCENARIO
Maturity Type : Hard Maturity
Maturity Date : 2022-01-31
Maturity Price : 25.00
Evaluated at bid price : 23.43
Bid-YTW : 5.70 %
TCA.PR.X Perpetual-Premium -1.10 % YTW SCENARIO
Maturity Type : Call
Maturity Date : 2013-10-15
Maturity Price : 50.00
Evaluated at bid price : 50.44
Bid-YTW : 4.95 %
BNS.PR.J Deemed-Retractible -1.05 % YTW SCENARIO
Maturity Type : Call
Maturity Date : 2013-10-29
Maturity Price : 25.00
Evaluated at bid price : 25.50
Bid-YTW : 4.05 %
GWO.PR.I Deemed-Retractible -1.02 % YTW SCENARIO
Maturity Type : Hard Maturity
Maturity Date : 2022-01-31
Maturity Price : 25.00
Evaluated at bid price : 22.23
Bid-YTW : 5.99 %
SLF.PR.H FixedReset -1.01 % YTW SCENARIO
Maturity Type : Hard Maturity
Maturity Date : 2022-01-31
Maturity Price : 25.00
Evaluated at bid price : 24.55
Bid-YTW : 4.01 %
IAG.PR.F Deemed-Retractible -1.01 % YTW SCENARIO
Maturity Type : Hard Maturity
Maturity Date : 2022-01-31
Maturity Price : 25.00
Evaluated at bid price : 25.55
Bid-YTW : 5.66 %
BAM.PR.J OpRet 1.11 % YTW SCENARIO
Maturity Type : Soft Maturity
Maturity Date : 2018-03-30
Maturity Price : 25.00
Evaluated at bid price : 26.50
Bid-YTW : 4.37 %
CIU.PR.A Perpetual-Discount 1.25 % YTW SCENARIO
Maturity Type : Limit Maturity
Maturity Date : 2041-10-03
Maturity Price : 23.00
Evaluated at bid price : 23.44
Bid-YTW : 4.94 %
NA.PR.O FixedReset 1.79 % YTW SCENARIO
Maturity Type : Call
Maturity Date : 2014-02-15
Maturity Price : 25.00
Evaluated at bid price : 27.80
Bid-YTW : 2.12 %
Volume Highlights
Issue Index Shares
Traded
Notes
ENB.PR.B FixedReset 321,190 Recent new issue.
YTW SCENARIO
Maturity Type : Limit Maturity
Maturity Date : 2041-10-03
Maturity Price : 23.17
Evaluated at bid price : 25.15
Bid-YTW : 3.67 %
RY.PR.N FixedReset 28,300 RBC crossed 24,200 at 26.90.
YTW SCENARIO
Maturity Type : Call
Maturity Date : 2014-02-24
Maturity Price : 25.00
Evaluated at bid price : 26.90
Bid-YTW : 3.24 %
CM.PR.G Perpetual-Discount 18,265 YTW SCENARIO
Maturity Type : Limit Maturity
Maturity Date : 2041-10-03
Maturity Price : 24.55
Evaluated at bid price : 24.87
Bid-YTW : 5.42 %
TD.PR.M OpRet 15,900 Called for redemption.
YTW SCENARIO
Maturity Type : Call
Maturity Date : 2012-04-30
Maturity Price : 25.25
Evaluated at bid price : 25.73
Bid-YTW : 2.70 %
TD.PR.I FixedReset 15,431 YTW SCENARIO
Maturity Type : Call
Maturity Date : 2014-07-31
Maturity Price : 25.00
Evaluated at bid price : 27.22
Bid-YTW : 3.36 %
BNS.PR.L Deemed-Retractible 14,539 YTW SCENARIO
Maturity Type : Call
Maturity Date : 2016-04-27
Maturity Price : 25.00
Evaluated at bid price : 24.95
Bid-YTW : 4.49 %
There were 10 other index-included issues trading in excess of 10,000 shares.
Wide Spread Highlights
Issue Index Quote Data and Yield Notes
TCA.PR.X Perpetual-Premium Quote: 50.44 – 51.24
Spot Rate : 0.8000
Average : 0.5261

YTW SCENARIO
Maturity Type : Call
Maturity Date : 2013-10-15
Maturity Price : 50.00
Evaluated at bid price : 50.44
Bid-YTW : 4.95 %

BNS.PR.O Deemed-Retractible Quote: 26.00 – 26.79
Spot Rate : 0.7900
Average : 0.5419

YTW SCENARIO
Maturity Type : Call
Maturity Date : 2015-04-28
Maturity Price : 25.50
Evaluated at bid price : 26.00
Bid-YTW : 4.78 %

IAG.PR.A Deemed-Retractible Quote: 21.72 – 22.34
Spot Rate : 0.6200
Average : 0.3847

YTW SCENARIO
Maturity Type : Hard Maturity
Maturity Date : 2022-01-31
Maturity Price : 25.00
Evaluated at bid price : 21.72
Bid-YTW : 6.40 %

BNA.PR.E SplitShare Quote: 22.69 – 23.30
Spot Rate : 0.6100
Average : 0.4536

YTW SCENARIO
Maturity Type : Hard Maturity
Maturity Date : 2017-12-10
Maturity Price : 25.00
Evaluated at bid price : 22.69
Bid-YTW : 6.82 %

SLF.PR.B Deemed-Retractible Quote: 22.25 – 22.67
Spot Rate : 0.4200
Average : 0.2659

YTW SCENARIO
Maturity Type : Hard Maturity
Maturity Date : 2022-01-31
Maturity Price : 25.00
Evaluated at bid price : 22.25
Bid-YTW : 6.31 %

BNS.PR.K Deemed-Retractible Quote: 25.11 – 25.53
Spot Rate : 0.4200
Average : 0.2683

YTW SCENARIO
Maturity Type : Call
Maturity Date : 2014-04-28
Maturity Price : 25.00
Evaluated at bid price : 25.11
Bid-YTW : 4.48 %

Mulvihill Changes Name to Strathbridge

October 3rd, 2011

Mulvihill Capital Management has announced:

our new name, Strathbridge Asset Management Inc, reflecting our revitalized focus and commitment to our closed-end fund business. Strathbridge Asset Management (“Strathbridge”) builds on Mulvihill’s 15 years of experience managing closed-end investment funds. Strathbridge utilizes a dedicated team of investment professionals powered by a revised proprietary investment process.

The change in our name is the culmination of a process that began in 2008 with the spin-off of two divisions. Since that time, the firm has undergone an extensive review and improvement of all facets of the organization, ultimately leading to our rebranding as Strathbridge Asset Management.

Building on our experience, we have developed a revised proprietary investment process using quantitative algorithms that facilitate a more selective option writing strategy, which together with the appropriate use of protective puts, is expected to lead to better risk-adjusted returns for investors. The Strathbridge team will utilize their vast experience to identify unique investment opportunities for investors that provide income and exposure to selected asset classes or features that investors could not replicate cost effectively. We are dedicated to providing timely investor information and services to assist your investment decisions. Our new website at www.strathbridge.com provides detailed information regarding each Strathbridge investment
fund, regular commentary and analysis from our portfolio managers and other educational material helpful to investors.

Strathbridge is now the manager of: CDD.UN, GPF.UN, GSB.UN, PCU.UN, PIC.A, PIC.PR.A, SBN, SBN.PR.A, TCT.UN, TXT.PR.A, TXT.UN, UTE.UN, WFS, WFS.PR.A.

Sadly, the Strathbridge website does not appear to show any performance data for their “more selective option writing strategy”.

GFV.PR.A Redeemed on Schedule

October 3rd, 2011

First Asset Management has announced:

that the Company completed the redemption of all of its outstanding Class A Shares and Preferred Shares on September 30, 2011.

Class A Shares were redeemed for $4.4827 per share. Preferred Shares were redeemed for $10 per share plus the previously announced quarterly distribution of $0.13125 per Preferred Share.

Payment will be made on or about October 5, 2011 to the beneficial holders of such shares through CDS Clearing and Depository Services Inc. Shareholders need not take any action to receive the final redemption proceeds.

DBRS has discontinued coverage of the no-longer-extant issue.

GFV.PR.A was not tracked by HIMIPref™.

MAPF Performance: September 2011

October 3rd, 2011

Well, there’s no sense trying to put a gloss on it: the fund had a horrible month in September.

The fund’s Net Asset Value per Unit as of the close September 30 was $10.2709 after a dividend distribution of $0.151168.

Returns to September 30, 2011
Period MAPF Index CPD
according to
Claymore
One Month -6.52% -0.29% -0.82%
Three Months -6.27% -0.13% -0.72%
One Year +2.81% +7.94% +4.56%
Two Years (annualized) +8.96% +8.92% N/A
Three Years (annualized) +24.33% +9.35% +6.95%
Four Years (annualized) +16.63% +5.12%  
Five Years (annualized) +13.36% +3.65%  
Six Years (annualized) +12.09% +3.71%  
Seven Years (annualized) +11.36% +3.93%  
Eight Years (annualized) +11.87% +4.06%  
Nine Years (annualized) +13.94% +4.41%  
Ten Years (annualized) +11.91% +4.30%  
The Index is the BMO-CM “50”
MAPF returns assume reinvestment of distributions, and are shown after expenses but before fees.
CPD Returns are for the NAV and are after all fees and expenses.
* CPD does not directly report its two-year returns.
Figures for Omega Preferred Equity (which are after all fees and expenses) for 1-, 3- and 12-months are -0.63%, -0.63% and +5.29%, respectively, according to Morningstar after all fees & expenses. Three year performance is +7.73%.
Figures for Jov Leon Frazer Preferred Equity Fund Class I Units (which are after all fees and expenses) for 1-, 3- and 12-months are -0.40%, -0.18% and +2.40% respectively, according to Morningstar
Figures for Manulife Preferred Income Fund (formerly AIC Preferred Income Fund) (which are after all fees and expenses) for 1-, 3- and 12-months are -0.29%, -0.03% & +4.34%, respectively
Figures for Horizons AlphaPro Preferred Share ETF are not yet available (inception date 2010-11-23)

MAPF returns assume reinvestment of dividends, and are shown after expenses but before fees. Past performance is not a guarantee of future performance. You can lose money investing in Malachite Aggressive Preferred Fund or any other fund. For more information, see the fund’s main page. The fund is available either directly from Hymas Investment Management or through a brokerage account at Odlum Brown Limited.

The fund’s poor return for the month is basically due to the following:

MAPF Performance Attribution
September, 2011
(Approximate)
Factor Contribution Note
YLO Preferreds -5.0% Topped up during month.
YLO.PR.A -90%
YLO.PR.B -85%
YLO.PR.C -84%
YLO.PR.D -82%
Overall Market -0.8% TXPR Total Return -0.77%
Other
(Mainly underperformance of
Insurance Preferreds)
-0.7% e.g., CM.PR.J +1.20%
GWO.PR.I -0.22%
MFC.PR.C -2.79%
SLF.PR.C -4.20%
Total -6.52%  

The precipituous decline in YLO preferreds may in turn be attributed to their September 28 Press Release (discussed on PrefBlog) in which they announced, among other things:

  • Elimination of the common dividend
  • Stringent new rules for their sharply reduced bank credit line

Reaction from the rating agencies was mixed: DBRS went into hysterics, slashing the preferred rating four notches to Pfd-4(low); S&P merely yawned, maintaining their rating at P-4(high) and stating that they’d be looking forward to the next quarterly report with more interest than usual.

The price of the common and the preferreds, which had been sharply declining, promptly cratered.


Click for Big

I don’t get it. The company still has about $1.5-billion in revenue and estimated free cash flow in excess of $200-million per year. Yes, of course both these figures are going to decline somewhat in the future, and yes, you at the back of the room, I know you haven’t looked at the Yellow Pages in three years, but the question is – how fast?

In the August edition of PrefLetter I made a spreadsheet available at http://www.prefblog.com/xls/YellowMediaProjection.xls which attempted to quantify the effects on cash-flow and debt of various user-specified assumptions regarding the rate of print revenue decline and digital substitution; you have to make some assumptions that I consider quite extreme before you start getting seriously scared. The baseline assumptions – which I consider a little on the gloomy side, if anything – indicate that the targetted Debt:EBITDA ratio falls to 2:1 in about six years. Interestingly, reflecting the elimination of common dividends in the spreadsheet and applying these savings to debt reduction reduces the time for this target to be met to three years.

Is this a guarantee? No, of course, not. Ain’t nothing guaranteed. But my point is that awfully severe assumptions have to be made in order to show a bankrupt company and it is my judgement that these awfully severe assumptions have a low probability.

I had an illuminating conversation over dinner with another investment manager recently. We don’t really talk about investments much, but this time I was bemoaning the horror of the YLO carnage, while he said with satisfaction that he’d just sold his last YLO bonds at forty cents on the dollar. So I said (his paraphrased comments in brackets) something like … “Look, when I look at the company’s financials and apply a 15% annual rate of decline in print revenue forever (‘Could be more.’) and assume a 50% digital substitution rate (‘Could be less.’) at a 40% profit margin (‘Could be less.’), I just don’t understand the hysteria.”

But his comments illustrate, boys and girls, how investment management is usually done. You can project bankruptcy for any company in the world by making your assumptions severe enough – there’s no skill in that. Investment management involves making judgements about the future while at all times remembering that you might be wrong – which is why the fund will no longer top up its YLO holdings (the new credit agreement carries with it a partial loss of access to capital markets). Whatever your “gut reaction”, it can be justified. When I look at YLO, I see a company that is in decline, certainly, but I also see it spinning off cash like crazy in the meantime – much like one of those gold mines that is the latest Big Investment Idea around now – and becoming a smaller digital media company. The company has always made more sense as private equity rather than a public company; and at current prices I wouldn’t be surprised if Google, Microsoft and Yahoo! weren’t wondering if it would be cheaper to buy than build.

We have seen something like this before: in September 2002 the fund underperformed by a stunning 8.01%. Why? Much the same reason – the fund held Bombardier preferreds, which were engulfed by a wave of market sentiment very similar qualitatively to the sentiment which now surrounds Yellow Media. The relative price drop of the BBD preferreds was smaller, but the fund’s holdings were larger.

In the end, BBD recovered and the fund eventually exited its position with a small profit. I can’t, of course, guarantee that the same thing will happen in this episode – but I can’t, at this point, see why not. In the meantime, we will remember one of the ways in which the liquidity premium can be captured:

The spread on corporate bonds over the liquid risk-free rate (for example, government bonds) represents compensation for several different factors:

A Expected default losses
B Unexpected default risk, such as default and recovery rate risk
C Mark-to-market risk, such as the risk of a fall in the market price of the bond
D Liquidity risk, such as the risk of not finding a ready buyer at the theoretical market price.

Investors concerned with the realisable value of their investment in the short-term require compensation for all these risks.

However, investors who can hold bonds to maturity need compensation only for A and B. Such investors can enjoy the premiums for C and D, and we refer to these collectively as a ‘liquidity premium’

Right now we’re seeing mark-to-market risk with a vengeance!

Sometimes everything works … sometimes the trading works, but sectoral shifts overwhelm the increment … sometimes nothing works. The fund seeks to earn incremental return by selling liquidity (that is, taking the other side of trades that other market participants are strongly motivated to execute), which can also be referred to as ‘trading noise’. There were a lot of strongly motivated market participants during the Panic of 2007, generating a lot of noise! Unfortunately, the conditions of the Panic may never be repeated in my lifetime … but the fund will simply attempt to make trades when swaps seem profitable, without worrying about the level of monthly turnover.

There’s plenty of room for new money left in the fund. I have shown in recent issues of PrefLetter that market pricing for FixedResets is demonstrably stupid and I have lots of confidence – backed up by my bond portfolio management experience in the markets for Canadas and Treasuries, and equity trading on the NYSE & TSX – that there is enough demand for liquidity in any market to make the effort of providing it worthwhile (although the definition of “worthwhile” in terms of basis points of outperformance changes considerably from market to market!) I will continue to exert utmost efforts to outperform but it should be borne in mind that there will almost inevitably be periods of underperformance in the future.

The yields available on high quality preferred shares remain elevated, which is reflected in the current estimate of sustainable income.

Calculation of MAPF Sustainable Income Per Unit
Month NAVPU Portfolio
Average
YTW
Leverage
Divisor
Securities
Average
YTW
Capital
Gains
Multiplier
Sustainable
Income
per
current
Unit
June, 2007 9.3114 5.16% 1.03 5.01% 1.2857 0.3628
September 9.1489 5.35% 0.98 5.46% 1.2857 0.3885
December, 2007 9.0070 5.53% 0.942 5.87% 1.2857 0.4112
March, 2008 8.8512 6.17% 1.047 5.89% 1.2857 0.4672
June 8.3419 6.034% 0.952 6.338% 1.2857 $0.4112
September 8.1886 7.108% 0.969 7.335% 1.2857 $0.4672
December, 2008 8.0464 9.24% 1.008 9.166% 1.2857 $0.5737
March 2009 $8.8317 8.60% 0.995 8.802% 1.2857 $0.6046
June 10.9846 7.05% 0.999 7.057% 1.2857 $0.6029
September 12.3462 6.03% 0.998 6.042% 1.2857 $0.5802
December 2009 10.5662 5.74% 0.981 5.851% 1.0819 $0.5714
March 2010 10.2497 6.03% 0.992 6.079% 1.0819 $0.5759
June 10.5770 5.96% 0.996 5.984% 1.0819 $0.5850
September 11.3901 5.43% 0.980 5.540% 1.0819 $0.5832
December 2010 10.7659 5.37% 0.993 5.408% 1.0000 $0.5822
March, 2011 11.0560 6.00% 0.994 5.964% 1.0000 $0.6594
June 11.1194 5.87% 1.018 5.976% 1.0000 $0.6645
September, 2011 10.2709 6.10%
Note
1.001 6.106% 1.0000 $0.6271
NAVPU is shown after quarterly distributions of dividend income and annual distribution of capital gains.
Portfolio YTW includes cash (or margin borrowing), with an assumed interest rate of 0.00%
The Leverage Divisor indicates the level of cash in the account: if the portfolio is 1% in cash, the Leverage Divisor will be 0.99
Securities YTW divides “Portfolio YTW” by the “Leverage Divisor” to show the average YTW on the securities held; this assumes that the cash is invested in (or raised from) all securities held, in proportion to their holdings.
The Capital Gains Multiplier adjusts for the effects of Capital Gains Dividends. On 2009-12-31, there was a capital gains distribution of $1.989262 which is assumed for this purpose to have been reinvested at the final price of $10.5662. Thus, a holder of one unit pre-distribution would have held 1.1883 units post-distribution; the CG Multiplier reflects this to make the time-series comparable. Note that Dividend Distributions are not assumed to be reinvested.
Sustainable Income is the resultant estimate of the fund’s dividend income per current unit, before fees and expenses. Note that a “current unit” includes reinvestment of prior capital gains; a unitholder would have had the calculated sustainable income with only, say, 0.9 units in the past which, with reinvestment of capital gains, would become 1.0 current units.
DeemedRetractibles are comprised of all Straight Perpetuals (both PerpetualDiscount and PerpetualPremium) issued by BMO, BNS, CM, ELF, GWO, HSB, IAG, MFC, NA, RY, SLF and TD, which are not exchangable into common at the option of the company (definition refined in May). These issues are analyzed as if their prospectuses included a requirement to redeem at par on or prior to 2022-1-31, in addition to the call schedule explicitly defined. See OSFI Does Not Grandfather Extant Tier 1 Capital, CM.PR.D, CM.PR.E, CM.PR.G: Seeking NVCC Status and the January, February, March and June, 2011, editions of PrefLetter for the rationale behind this analysis.
Yields for September 30, 2011, were calculated by imposing a cap of 10% on the yields of YLO issues held, in order to avoid their extremely high calculated yields distorting the calculation and to reflect the uncertainty in the marketplace that these yields will be realized.

Significant positions were held in DeemedRetractible and FixedReset issues on August 31; all of the former and most of the latter currently have their yields calculated with the presumption that they will be called by the issuers at par prior to 2022-1-31. This presents another complication in the calculation of sustainable yield. The fund also holds a position in a SplitShare (BNA.PR.C) and an OperatingRetractible Scrap (YLO.PR.B) which also have their yields calculated with the expectation of a maturity at par, a somewhat dubious assumption in the latter case.

However, if the entire portfolio except for the PerpetualDiscounts were to be sold and reinvested in these issues, the yield of the portfolio would be the 5.84% shown in the MAPF Portfolio Composition: September 2011 analysis (which is greater than the 5.35% index yield on September 30). Given such reinvestment, the sustainable yield would be $10.2709 * 0.0584 = $0.5998 a decrease from the $11.1492 * 0.0580 = $0.6467 reported in August.

Different assumptions lead to different results from the calculation, but the overall positive trend is apparent. I’m very pleased with the results! It will be noted that if there was no trading in the portfolio, one would expect the sustainable yield to be constant (before fees and expenses). The success of the fund’s trading is showing up in

  • the very good performance against the index
  • the long term increases in sustainable income per unit

As has been noted, the fund has maintained a credit quality equal to or better than the index; outperformance is due to constant exploitation of trading anomalies.

Again, there are no predictions for the future! The fund will continue to trade between issues in an attempt to exploit market gaps in liquidity, in an effort to outperform the index and keep the sustainable income per unit – however calculated! – growing.
MAPF Portfolio Composition: September, 2011

October 2nd, 2011

Turnover was virutually non-existent in September, at about 1%.

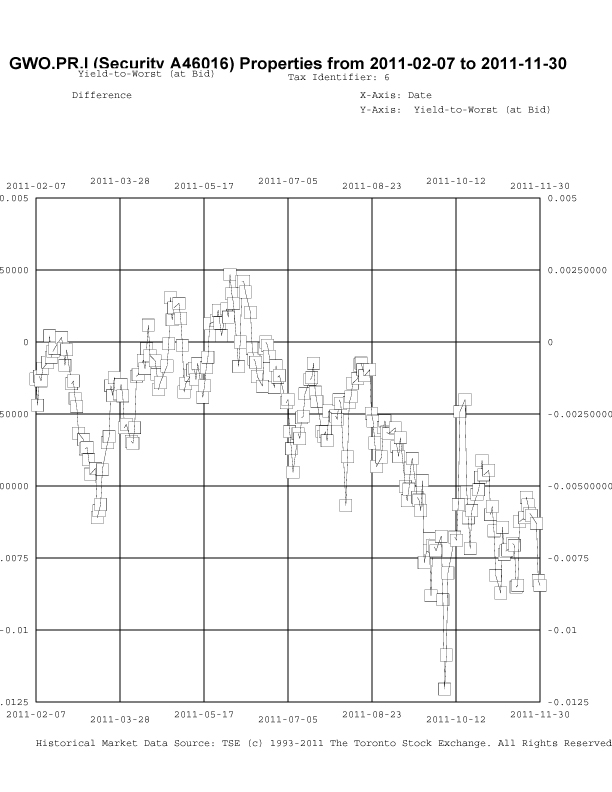
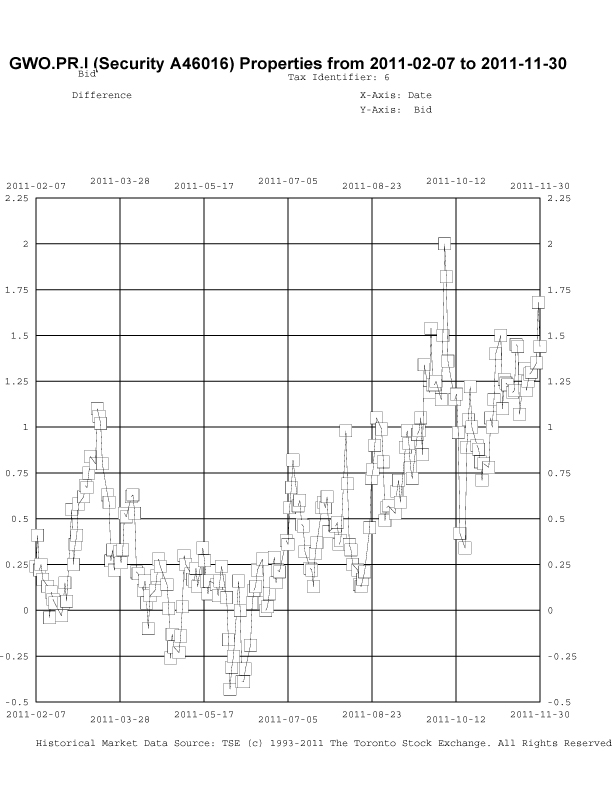
I lay a lot of the blame for lack of turnover on OSFI, and will illustrate my argument with a graph of the price difference between CM.PR.J and GWO.PR.I, which pay the same annual dividend; the differences in structure of the instruments are negligible, other than the fact that, of course, the issuer is different. However, while the market appears to have incorporated OSFI’s advisory on Non-Viability Contingent Capital to banks, it does not appear to have extrapolated this advisory to insurers and insurance holding companies, which is something I expect to happen in the relatively near future.


Click for big

It will be recalled that OSFI has announced that CM.PR.J (and all other issues of its ilk) will not be eligible for inclusion in Tier 1 Capital to any degree whatsoever after 2022-1-31; that this implies the company will cease to regard it as “cheap equity” and instead consider it “expensive debt”, and that therefore redemption at par is anticipated by 2022 at the latest. My expectation, given the laudable objective of harmonizing insurance and banking regulation to the extent possible, is that this precept will apply, sooner or later, to GWO.PR.I and all other regulated financial issues which do not have an NVCC clause. See my definition of “DeemedRetractibles” for more discussion of this matter.

As I remarked in the September PrefLetter:

Most obvious is the very high price spread between the two issues, but it is also apparent that there is a high degree of volatility in this spread; this spread cannot be explained by fundamental factors, it is a market artifact arising from random fluctuations in supply and demand.

One might think, therefore, that my fund8 would have been frantically trading throughout the year, seeking to exploit these transient pricing differences – that is, after all, what my proprietary valuation software, HIMIPref™, is designed to indicate. This has not been the case and in fact, trading has been significantly lower than usual since the OFSI-derived activity in the first quarter.

The reason for this is the high degree of stratification in the market; while the difference in prices has fluctuated in a very wide range (a variance of about $1.00), taking advantage of these fluctuations implies giving up a great deal of valuation (since the assumption is that two issues are directly comparable). In order to take advantage of the low difference in price (in hopes of making $1 on the trade when the difference is high) it is necessary to sell GWO.PR.I and buy CM.PR.J, giving up $2 in “permanent valuation”.

The software is designed to correct for factors such as this; while one factor assumes that the price difference will return to zero (given that the issues are virtually identical in terms of characteristics), another factor assumes that the price difference will return to its average of about $2.50. In this case, though, the predicted effect from the first factor overwhelms the contribution from the second; GWO.PR.I is always calculated to be cheap relative to CM.PR.J; and the portfolio’s position in the former is maintained. In other words, there would be considerable risk in executing the swap since the probability of losing $2 (if the price difference returns to zero) outweighs the probability of gaining $1 (if the price difference returns to its upper limit).

As I remarked in the February, 2010, edition of this newsletter, the preferred share market has, to a certain extent, become OSFI’s casino, with valuation far more dependent upon potential regulatory decisions and their timing than it should be, with consequent loss of market efficiency – and the trading profits of investors similar to Hymas Investment Management, who seek to eke out excess returns by supplying that efficiency.

Trades were, as ever, triggered by a desire to exploit transient mispricing in the preferred share market (which may be thought of as “selling liquidity”), rather than any particular view being taken on market direction, sectoral performance or credit anticipation.

We can only hope that OSFI makes an announcement regarding the status of Straight Preferreds issued by insurers and insurance holding companies at some point in the near future, one war or the other.

Be that as it may, sectoral distribution of the MAPF portfolio on September 30 was as follows:

MAPF Sectoral Analysis 2011-9-30
HIMI Indices Sector Weighting YTW ModDur
Ratchet 0% N/A N/A
FixFloat 0% N/A N/A
Floater 0% N/A N/A
OpRet 0% N/A N/A
SplitShare 10.2% (+0.4) 7.29% 6.03
Interest Rearing 0% N/A N/A
PerpetualPremium 0.0% (0) N/A N/A
PerpetualDiscount 10.0% (+0.5) 5.84% 14.18
Fixed-Reset 9.3% (+0.5%) 3.45% 2.40
Deemed-Retractible 62.2% 59.4% (+2.8) 6.20% 7.98
Scraps (Various) 8.3% (-3.3) 7.25% (see note) 9.76 (see note)
Cash +0.1% (-0.8) 0.00% 0.00
Total 100% 6.10% 8.02
Yields for the YLO preferreds have been set at 10% for calculation purposes, and their durations at 5.00. The extraordinarily low price of these issues has resulted in extremely high calculated yields; I feel that substitution of these values results in a more prudent total indication.
Totals and changes will not add precisely due to rounding. Bracketted figures represent change from August month-end. Cash is included in totals with duration and yield both equal to zero.
DeemedRetractibles are comprised of all Straight Perpetuals (both PerpetualDiscount and PerpetualPremium) issued by BMO, BNS, CM, ELF, GWO, HSB, IAG, MFC, NA, RY, SLF and TD, which are not exchangable into common at the option of the company. These issues are analyzed as if their prospectuses included a requirement to redeem at par on or prior to 2022-1-31, in addition to the call schedule explicitly defined. See OSFI Does Not Grandfather Extant Tier 1 Capital, CM.PR.D, CM.PR.E, CM.PR.G: Seeking NVCC Status and the January, February, March and June, 2011, editions of PrefLetter for the rationale behind this analysis.

The “total” reflects the un-leveraged total portfolio (i.e., cash is included in the portfolio calculations and is deemed to have a duration and yield of 0.00.). MAPF will often have relatively large cash balances, both credit and debit, to facilitate trading. Figures presented in the table have been rounded to the indicated precision.

Credit distribution is:

MAPF Credit Analysis 2011-8-31
DBRS Rating Weighting
Pfd-1 0 (0)
Pfd-1(low) 50.1% (+2.4)
Pfd-2(high) 21.4% (+1.0)
Pfd-2 0 (0)
Pfd-2(low) 20.1% (+0.3)
Pfd-3(high) 2.9% (+0.2)
Pfd-3 4.1% (-4.3)
Pfd-4(low) 1.3% (+1.3)
Cash +0.1% (-0.8)
Totals will not add precisely due to rounding. Bracketted figures represent change from August month-end.
A position held in ELF preferreds has been assigned to Pfd-2(low)
A position held in CSE preferreds has been assigned to Pfd-3

The increase in Pfd-4(low) holdings at the expense of Pfd-3 is due to the downgrade of YLO.

Liquidity Distribution is:

MAPF Liquidity Analysis 2011-9-30
Average Daily Trading Weighting
<$50,000 12.8% (+6.9)
$50,000 – $100,000 16.0% (-5.2)
$100,000 – $200,000 20.4% (+1.9)
$200,000 – $300,000 42.3% (+17.1)
>$300,000 8.4% (-19.8)
Cash +0.1% (-0.8)
Totals will not add precisely due to rounding. Bracketted figures represent change from August month-end.

The increase in the proportion of issues with an Average Daily Trading Value less than $50,000 is mainly due to the migration of CCS.PR.C and ELF.PR.G. The decrease in those with more than $300,000 is mainly due to the migration of SLF.PR.E, MFC.PR.C and BNS.PR.X.

MAPF is, of course, Malachite Aggressive Preferred Fund, a “unit trust” managed by Hymas Investment Management Inc. Further information and links to performance, audited financials and subscription information are available the fund’s web page. The fund may be purchased either directly from Hymas Investment Management or through a brokerage account at Odlum Brown Limited. A “unit trust” is like a regular mutual fund, but is sold by offering memorandum rather than prospectus. This is cheaper, but means subscription is restricted to “accredited investors” (as defined by the Ontario Securities Commission) or those who subscribe for $150,000+. Fund past performances are not a guarantee of future performance. You can lose money investing in MAPF or any other fund.

A similar portfolio composition analysis has been performed on the Claymore Preferred Share ETF (symbol CPD) as of August 31, 2010, and published in the September, 2010, PrefLetter. While direct comparisons are difficult due to the introduction of the DeemedRetractible class of preferred share (see above) it is fair to say:

  • MAPF credit quality is better
  • MAPF liquidity is a higher
  • MAPF Yield is higher
  • Weightings in
    • MAPF is much more exposed to DeemedRetractibles
    • MAPF is much less exposed to Operating Retractibles
    • MAPF is slightly more exposed to SplitShares
    • MAPF is less exposed to FixFloat / Floater / Ratchet
    • MAPF weighting in FixedResets is much lower