Archive for November, 2012

November 6, 2012

Wednesday, November 7th, 2012

It’s not a preferred share issuer – but it’s a sign of the times:

DBRS has today downgraded the Issuer Rating of Torstar Corporation (Torstar or the Company) to BBB (low) from BBB. The trend is Stable and the rating is no longer Under Review with Negative Implications. The downgrade reflects DBRS’s view that Torstar’s earnings profile has been structurally affected by a consumer shift to digital forms of media as the Company has struggled to sustain organic revenues and profitability. The new rating also reflects DBRS’s view that weakening demand will continue to place pressure on the Company’s revenues, margins and cash flow generation going forward. DBRS’s concern is not based primarily on the Company’s debt level, as Torstar has remained prudent in terms of financial management, but rather the Company’s income and cash-generating prospects.

There’s an interesting conflict of trends in consumer borrowing:

Overall non-mortgage debt loads continued to increase during the third quarter, up 1.8 per cent from the same quarter of last year, the credit-monitoring firm [Equifax Canada] said in its latest Quarterly Credit Trends Report released Tuesday. However, only 1.22 per cent of debts were unpaid after 90 days or more in the July-September quarter.

That’s down sharply from 1.37 per cent in the previous quarter and the lowest delinquency rate on record going back to early 2007, before the recession began.

It was a mixed day for the Canadian preferred share market, with PerpetualPremiums gaining 13bp, FixedResets off 1bp and DeemedRetractibles winning 15bp. Volatility was average. Volume was average.

HIMIPref™ Preferred Indices
These values reflect the December 2008 revision of the HIMIPref™ Indices

Values are provisional and are finalized monthly
Index Mean
Current
Yield
(at bid)
Median
YTW
Median
Average
Trading
Value
Median
Mod Dur
(YTW)
Issues Day’s Perf. Index Value
Ratchet 0.00 % 0.00 % 0 0.00 0 0.4277 % 2,471.7
FixedFloater 4.13 % 3.46 % 34,929 18.39 1 0.0000 % 3,895.7
Floater 2.79 % 3.00 % 57,603 19.71 4 0.4277 % 2,668.8
OpRet 4.64 % 3.26 % 72,244 1.34 4 -0.5703 % 2,562.2
SplitShare 5.35 % 4.43 % 62,302 4.46 3 0.3261 % 2,869.4
Interest-Bearing 0.00 % 0.00 % 0 0.00 0 -0.5703 % 2,342.9
Perpetual-Premium 5.27 % 1.29 % 72,743 0.30 29 0.1262 % 2,316.4
Perpetual-Discount 4.90 % 4.91 % 100,969 15.56 3 0.0964 % 2,595.6
FixedReset 4.99 % 3.00 % 208,507 3.93 74 -0.0055 % 2,446.0
Deemed-Retractible 4.91 % 3.50 % 132,208 1.11 46 0.1500 % 2,396.4
Performance Highlights
Issue Index Change Notes
BAM.PR.O OpRet -2.58 % YTW SCENARIO
Maturity Type : Option Certainty
Maturity Date : 2013-06-30
Maturity Price : 25.00
Evaluated at bid price : 25.31
Bid-YTW : 3.90 %
GWO.PR.F Deemed-Retractible 1.10 % YTW SCENARIO
Maturity Type : Call
Maturity Date : 2012-12-06
Maturity Price : 25.00
Evaluated at bid price : 25.79
Bid-YTW : -23.30 %
TRI.PR.B Floater 1.27 % YTW SCENARIO
Maturity Type : Limit Maturity
Maturity Date : 2042-11-06
Maturity Price : 22.05
Evaluated at bid price : 22.28
Bid-YTW : 2.34 %
ENB.PR.N FixedReset 1.47 % YTW SCENARIO
Maturity Type : Call
Maturity Date : 2018-12-01
Maturity Price : 25.00
Evaluated at bid price : 25.53
Bid-YTW : 3.58 %
Volume Highlights
Issue Index Shares
Traded
Notes
CU.PR.C FixedReset 44,035 Scotia crossed 29,900 at 26.10.
YTW SCENARIO
Maturity Type : Call
Maturity Date : 2017-06-01
Maturity Price : 25.00
Evaluated at bid price : 26.10
Bid-YTW : 3.15 %
BAM.PR.J OpRet 42,907 RBC crossed 38,900 at 26.80.
YTW SCENARIO
Maturity Type : Call
Maturity Date : 2014-03-31
Maturity Price : 26.00
Evaluated at bid price : 26.83
Bid-YTW : 3.26 %
BNS.PR.Y FixedReset 42,188 TD bought 15,400 from Nesbitt at 24.94.
YTW SCENARIO
Maturity Type : Hard Maturity
Maturity Date : 2022-01-31
Maturity Price : 25.00
Evaluated at bid price : 24.85
Bid-YTW : 2.83 %
TD.PR.A FixedReset 41,389 National crossed 25,000 at 25.72.
YTW SCENARIO
Maturity Type : Call
Maturity Date : 2014-01-31
Maturity Price : 25.00
Evaluated at bid price : 25.65
Bid-YTW : 2.92 %
PWF.PR.E Perpetual-Premium 38,040 Nesbitt crossed 31,200 at 25.38.
YTW SCENARIO
Maturity Type : Call
Maturity Date : 2013-01-31
Maturity Price : 25.00
Evaluated at bid price : 25.36
Bid-YTW : -0.23 %
BNS.PR.P FixedReset 34,800 National crossed 24,300 at 25.15.
YTW SCENARIO
Maturity Type : Hard Maturity
Maturity Date : 2022-01-31
Maturity Price : 25.00
Evaluated at bid price : 25.10
Bid-YTW : 3.39 %
There were 29 other index-included issues trading in excess of 10,000 shares.
Wide Spread Highlights
Issue Index Quote Data and Yield Notes
BAM.PR.O OpRet Quote: 25.31 – 26.04
Spot Rate : 0.7300
Average : 0.4413

YTW SCENARIO
Maturity Type : Option Certainty
Maturity Date : 2013-06-30
Maturity Price : 25.00
Evaluated at bid price : 25.31
Bid-YTW : 3.90 %

CIU.PR.B FixedReset Quote: 27.20 – 27.50
Spot Rate : 0.3000
Average : 0.1838

YTW SCENARIO
Maturity Type : Call
Maturity Date : 2014-06-01
Maturity Price : 25.00
Evaluated at bid price : 27.20
Bid-YTW : 1.80 %

IAG.PR.A Deemed-Retractible Quote: 24.65 – 24.95
Spot Rate : 0.3000
Average : 0.2026

YTW SCENARIO
Maturity Type : Hard Maturity
Maturity Date : 2022-01-31
Maturity Price : 25.00
Evaluated at bid price : 24.65
Bid-YTW : 4.88 %

GWO.PR.J FixedReset Quote: 26.00 – 26.30
Spot Rate : 0.3000
Average : 0.2140

YTW SCENARIO
Maturity Type : Call
Maturity Date : 2013-12-31
Maturity Price : 25.00
Evaluated at bid price : 26.00
Bid-YTW : 3.01 %

FTS.PR.E OpRet Quote: 26.87 – 27.15
Spot Rate : 0.2800
Average : 0.1969

YTW SCENARIO
Maturity Type : Call
Maturity Date : 2013-06-01
Maturity Price : 25.75
Evaluated at bid price : 26.87
Bid-YTW : -1.33 %

PWF.PR.R Perpetual-Premium Quote: 26.61 – 26.89
Spot Rate : 0.2800
Average : 0.2011

YTW SCENARIO
Maturity Type : Call
Maturity Date : 2021-04-30
Maturity Price : 25.00
Evaluated at bid price : 26.61
Bid-YTW : 4.62 %

November 5, 2012

Tuesday, November 6th, 2012

The US Treasury’s divestment of AIG is proceeding rapidly:

American International Group (AIG), the bailed-out insurer/ex-pyromaniac at the epicenter of the global financial meltdown, just posted a $1.86 billion quarterly profit, compared with the $4 billion loss it registered last year. The stat that most matters: Uncle Sam now owns just 16 percent of the company, with a complete disposal of its stake likely by the end of the year. The U.S. Treasury Department has recently been offloading hundreds of millions of shares—it sold $20.7 billion worth in September—after having owned as much as 92 percent of AIG in the wake of a government bailout that ballooned to $182 billion, including aid from the Federal Reserve Bank of New York.

If you’re to believe Treasury’s math—no small controversy there—taxpayers actually are in the black from the bailout. The U.S. profits off anything sold above its stated bailout per-share cost basis of $28.73, according to bank Drexel Hamilton. AIG stock now changes hands at $33, having surged 43 percent this year. That is less than half its book value (a measure of its assets minus liabilities) of just under $70 a share. The more of itself AIG repurchases from the government—and the more its business evolves back into bread-and-butter property-casualty, life insurance, and investing—the more it is thought its stock will approximate that book value. “The government ownership has been a real overhang for the company,” said Josh Stirling of Sanford Bernstein (AB), ahead of the quarterly earnings report.

Mind you, there are significant gimmicks in the numbers:

One point of contention is Treasury’s decision to allow AIG—along with TARP recipients Citigroup (C) and Ally Financial—to use operating losses from previous years to eliminate taxes on current income. The allowance, which typically does not apply to bankrupt or acquired companies, added $17.7 billion to AIG’s fourth-quarter earnings and will allow the company to shield profits from taxes for many years to come. “It’s important to remember that a substantial portion of AIG’s recent earnings were attributable to Treasury’s unilateral decision to preserve AIG’s net operating losses,” says J. Mark McWatters, a law professor at Southern Methodist University who was a Republican appointee to the TARP oversight committee.

Barofsky calls the price [that Treasury quotes as its acquisition cost] “a political manipulation of numbers.” He argues the calculation shouldn’t include 563 million AIG shares that Treasury received from the Federal Reserve in January 2011 because the shares were not acquired as part of the TARP program. Removing those shares from the calculation would lift Treasury’s per-share cost to $43.53, which means TARP would show a $16 billion loss if Treasury sold the rest of its holdings at $29.

Still, even if we give full weight to the carping, the AIG bailout has been much less expensive than Government Motors:

U.S. taxpayers kept the nation’s largest auto maker by sales afloat with a $50 billion bailout in 2009 and now own 26.5% of the Detroit company.

Earlier this summer, GM floated a plan with Treasury officials to repurchase 200 million of the roughly 500 million shares the U.S. holds in the auto maker, according to people familiar with the discussions. Under the plan, Treasury would sell the remaining shares through a public stock offering.

But Treasury officials aren’t interested in GM’s offer at the current price and aren’t in a rush to offload shares, according to people familiar with the matter. The biggest reason: A sale now would leave the government with a hefty loss on its investment.

At GM’s Friday share price of $24.14, the U.S. would lose about $15 billion on the GM bailout if it sold its entire stake. While GM stock would need to reach $53 a share for the U.S. to break even, Treasury officials would consider selling at a price in the $30s, people familiar with the government’s thinking have said.

Last month, the Obama administration increased the estimated loss on the $85 billion auto industry bailout, which also included aid to crosstown rival Chrysler Group LLC and auto parts suppliers, by $3 billion to more than $25 billion. That amount is still smaller than the government’s initial estimate of a $44 billion loss. Chrysler is already free and clear from its government bailout after taking out a loan to pay back what it owed.

The U.S. is still in the red on its investments in Fannie Mae and Freddie Mac, which have received $188 billion in taxpayer support.

How’s this for bad management? Rochdale Securities levered up 300:1 on Apple common:

Rochdale Securities LLC, the brokerage that employs bank analyst Dick Bove, is in advanced talks to save the firm after unauthorized trades in Apple Inc. (AAPL) went sour, said two people with knowledge of the negotiations

The potential deal to recapitalize Stamford, Connecticut- based Rochdale would be a merger or investment and may be announced as early as today, said the people, who requested anonymity because the talks are private. The deal for the 37- year-old firm could still fall apart, one of the people said.

Rochdale, led by President Daniel J. Crowley, has told potential investors that a trader made an unauthorized purchase last month of $750 million to $1 billion in Apple shares, which dropped in value and depleted capital at closely held Rochdale, the people said.

The firm had $3.44 million of capital at the end of last year, according to a filing with the U.S. Securities and Exchange Commission. Crowley didn’t immediately return phone calls seeking comment on the firm’s status.

There are rumours of naughtiness:

A person familiar with the thinking of Rochdale executives said a trader at the firm received an order for stock in Apple Inc. … but bought 1,000 times the number of shares requested. The trader is saying the extra shares were ordered by mistake, the person said, but the firm is alleging the actions were intentional. The company suspects the trader was working with an outside party to execute the trade and profit at the firm’s expense, according to this person.

Despite all the sound and fury over credit ratings, it looks like the ECB doesn’t do its own credit analysis. What a surprise.

The European Central Bank is investigating claims that it used a high credit rating from a Canadian ratings agency to grant loans to Spanish banks at a sweetheart rate that was not offered to another struggling euro zone country.

An ECB spokesman on Frankfurt, Philippe Rispal, said the bank is “currently investigating this matter” and that the probe would determine whether “the correct haircut has been applied” to the Spanish sovereign bonds that were used as collateral for ECB loans.

The term “haircut” refers to varying discounts applied to the collateral based on its credit quality. On the weekend, the German newspaper Die Welt am Sonntag said that about €80-billion ($102.3-billion U.S.) of Spanish treasury bills posted as collateral received only a 0.5 per cent haircut when a 5.5 per cent haircut would have been more appropriate, given Spain’s rising sovereign risks.

The newspaper said the ECB relied on the relatively high Spanish rating produced by Toronto’s DBRS in determining its collateral requirements. DBRS has assigned an A-low rating, with “negative trend” on all of Spain’s public sovereign debt. The other three ratings agencies – Fitch, Standard & Poor’s and Moody’s – have a lower single-B rating on the 18-month T-bills that were posted as collateral by the Spanish banks (DBRS rates the country, not the individual securities).

DBRS’s rating for Ireland is the same as its rating for Spain. Yet Die Welt said the Irish bonds used as ECB collateral were subject to a 5.5 per cent haircut, meaning the ECB apparently considered them much riskier than the Spanish collateral in spite of the identical country rating.

DBRS has released a new methodology titled DBRS Criteria: Preferred Share and Hybrid Criteria for Corporate Issuers (Excluding Financial Institutions). Not much of interest, but there are a few nuggets:

Rate Reset Preferred Shares
Cumulative redeemable preferred shares featuring rate reset provisions are prevalent in Canada. While having no stated maturity, these securities feature a rate reset mechanism, combined with the option to redeem (both typically occurring every fifth year). The redemption option and rate reset are not viewed as impediments to garnering high levels of equity treatment if (1) the reset spread, set at the time of initial issuance, is not viewed as onerous on a basis relative to market, and would therefore not be expected to be a major incentive to redeem (while this is subjective, as an issuer’s credit spread will change over time due to both market- and company-specific factors, DBRS will compare an issuer’s reset spread to its peer group to assess its potential to impact future actions) and (2) DBRS has a high degree of confidence that the securities will remain a permanent part of the issuer’s capital structure.

Preferred Share Default
A preferred share is only assigned a “D” rating (for default) when the security is in default according to the legal documents. As such, the non-payment of a dividend does not necessarily give rise to the assignment of a default rating. When preferred dividends are not declared, the preferred share rating will likely be downgraded by a minimum of one notch to refl ect the non-payment situation. Further downgrades may occur, should the overall ratings for the organization be downgraded as a result of a negative situation that relates to the decision not to pay preferred share dividends. In addition, DBRS may consider additional downward notching of the preferred share rating to refl ect concerns related to either (1) the expectation that non- payment of dividends may continue for several more quarters or (2) the probability of a future default, as defined in the legal documents, which could occur without any defaults of higher rated securities, including coercive exchange offers.

Cumulative vs. Non-Cumulative
Whether a security is cumulative or non-cumulative does not generally have a large impact on treatment and has no impact on ratings. While a non-cumulative security is more beneficial for an issuer, in that missed payments to do not have to be made up in the future, DBRS views this as a modest factor for equity treatment, as an issuer may be more hesitant to miss a payment on a non cumulative security given potential consequences, as already noted.

Additionally, the rating itself is generally rather indifferent to cumulative vs. non-cumulative, given the minimal difference in expected recovery.

It was a mixed day for the Canadian preferred share market, with PerpetualPremiums off 3bp, FixedResets up 6bp and DeemedRetractibles gaining 1bp. Volatility was minimal. Volume was very low.

HIMIPref™ Preferred Indices
These values reflect the December 2008 revision of the HIMIPref™ Indices

Values are provisional and are finalized monthly
Index Mean
Current
Yield
(at bid)
Median
YTW
Median
Average
Trading
Value
Median
Mod Dur
(YTW)
Issues Day’s Perf. Index Value
Ratchet 0.00 % 0.00 % 0 0.00 0 -0.4126 % 2,461.2
FixedFloater 4.13 % 3.46 % 35,366 18.39 1 -0.4329 % 3,895.7
Floater 2.81 % 2.99 % 58,051 19.73 4 -0.4126 % 2,657.4
OpRet 4.61 % -0.24 % 43,476 0.64 4 -0.0095 % 2,576.9
SplitShare 5.36 % 4.59 % 63,077 4.46 3 0.0914 % 2,860.0
Interest-Bearing 0.00 % 0.00 % 0 0.00 0 -0.0095 % 2,356.3
Perpetual-Premium 5.28 % 1.02 % 72,869 0.24 29 -0.0334 % 2,313.5
Perpetual-Discount 4.91 % 4.93 % 104,809 15.55 3 0.0000 % 2,593.1
FixedReset 4.99 % 2.98 % 211,094 3.93 74 0.0580 % 2,446.1
Deemed-Retractible 4.92 % 3.55 % 134,878 1.11 46 0.0051 % 2,392.8
Performance Highlights
Issue Index Change Notes
TRI.PR.B Floater -1.03 % YTW SCENARIO
Maturity Type : Limit Maturity
Maturity Date : 2042-11-05
Maturity Price : 21.75
Evaluated at bid price : 22.00
Bid-YTW : 2.37 %
Volume Highlights
Issue Index Shares
Traded
Notes
BMO.PR.Q FixedReset 212,494 Scotia crossed blocks of 100,000 and 50,000, both at 25.15. RBC crossed 50,000 at the same price.
YTW SCENARIO
Maturity Type : Hard Maturity
Maturity Date : 2022-01-31
Maturity Price : 25.00
Evaluated at bid price : 25.12
Bid-YTW : 2.99 %
SLF.PR.F FixedReset 45,604 National crossed 45,500 at 26.50.
YTW SCENARIO
Maturity Type : Call
Maturity Date : 2014-06-30
Maturity Price : 25.00
Evaluated at bid price : 26.47
Bid-YTW : 2.73 %
TD.PR.A FixedReset 33,991 National crossed 30,000 at 25.70.
YTW SCENARIO
Maturity Type : Call
Maturity Date : 2014-01-31
Maturity Price : 25.00
Evaluated at bid price : 25.70
Bid-YTW : 2.75 %
TD.PR.K FixedReset 31,546 National crossed 30,000 at 26.83.
YTW SCENARIO
Maturity Type : Call
Maturity Date : 2014-07-31
Maturity Price : 25.00
Evaluated at bid price : 26.73
Bid-YTW : 2.23 %
IGM.PR.B Perpetual-Premium 17,512 YTW SCENARIO
Maturity Type : Call
Maturity Date : 2014-12-31
Maturity Price : 26.00
Evaluated at bid price : 27.17
Bid-YTW : 3.54 %
BMO.PR.J Deemed-Retractible 17,416 YTW SCENARIO
Maturity Type : Call
Maturity Date : 2016-02-25
Maturity Price : 25.00
Evaluated at bid price : 25.50
Bid-YTW : 3.79 %
There were 14 other index-included issues trading in excess of 10,000 shares.
Wide Spread Highlights
Issue Index Quote Data and Yield Notes
W.PR.J Perpetual-Premium Quote: 25.40 – 25.73
Spot Rate : 0.3300
Average : 0.2056

YTW SCENARIO
Maturity Type : Call
Maturity Date : 2012-12-05
Maturity Price : 25.00
Evaluated at bid price : 25.40
Bid-YTW : -9.60 %

ELF.PR.G Perpetual-Discount Quote: 24.01 – 24.25
Spot Rate : 0.2400
Average : 0.1556

YTW SCENARIO
Maturity Type : Limit Maturity
Maturity Date : 2042-11-05
Maturity Price : 23.59
Evaluated at bid price : 24.01
Bid-YTW : 4.97 %

BMO.PR.J Deemed-Retractible Quote: 25.50 – 25.73
Spot Rate : 0.2300
Average : 0.1467

YTW SCENARIO
Maturity Type : Call
Maturity Date : 2016-02-25
Maturity Price : 25.00
Evaluated at bid price : 25.50
Bid-YTW : 3.79 %

TD.PR.P Deemed-Retractible Quote: 26.17 – 26.45
Spot Rate : 0.2800
Average : 0.1978

YTW SCENARIO
Maturity Type : Call
Maturity Date : 2012-12-05
Maturity Price : 26.00
Evaluated at bid price : 26.17
Bid-YTW : -2.05 %

GWO.PR.P Deemed-Retractible Quote: 26.43 – 26.74
Spot Rate : 0.3100
Average : 0.2334

YTW SCENARIO
Maturity Type : Hard Maturity
Maturity Date : 2022-01-31
Maturity Price : 25.00
Evaluated at bid price : 26.43
Bid-YTW : 4.73 %

IGM.PR.B Perpetual-Premium Quote: 27.17 – 27.47
Spot Rate : 0.3000
Average : 0.2247

YTW SCENARIO
Maturity Type : Call
Maturity Date : 2014-12-31
Maturity Price : 26.00
Evaluated at bid price : 27.17
Bid-YTW : 3.54 %

MAPF Performance: October 2012

Saturday, November 3rd, 2012

The fund outperformed in September, due largely to stellar performance by the SLF DeemedRetractibles, BNA.PR.C and several lower-rated issues. In contrast to the last few months, GWO, MFC & IAG DeemedRetractibles merely kept pace with the overall market – but DeemedRetractibles as a group outperformed FixedResets, +61bp vs. +35bp respectively.

The fund’s Net Asset Value per Unit as of the close October 31, 2012, was 10.7577.

Returns to October 31, 2012
Period MAPF BMO-CM “50” Index TXPR
Total Return
CPD
according to
Blackrock
One Month +0.82% +0.39% +0.25% +0.15%
Three Months +4.00% +1.28% +1.05% +0.85%
One Year +11.19% +6.23% +5.96% N/A
Market Price: +5.44%
Two Years (annualized) +6.69% +6.33% +5.20% N/A
Three Years (annualized) +11.33% +8.92% +7.44% +6.67%
Four Years (annualized) +23.34% +11.06% +9.53% N/A
Five Years (annualized) +16.90% +5.97% +4.65% +4.00%
Six Years (annualized) +13.31% +4.06%    
Seven Years (annualized) +12.28% +4.21%    
Eight Years (annualized) +11.53% +4.18%    
Nine Years (annualized) +11.96% +4.34%    
Ten Years (annualized) +13.33% +4.64%    
Eleven Years (annualized) +11.93% +4.53%    
MAPF returns assume reinvestment of distributions, and are shown after expenses but before fees.
CPD Returns are for the NAV and are after all fees and expenses.
* CPD does not directly report its two- or four-year returns.
Figures for Omega Preferred Equity (which are after all fees and expenses) for 1-, 3- and 12-months are +0.47%, +1.38% and +5.94%, respectively, according to Morningstar after all fees & expenses. Three year performance is +7.68%.
Figures for Jov Leon Frazer Preferred Equity Fund Class I Units (which are after all fees and expenses) for 1-, 3- and 12-months are +0.24%, +0.60% and +3.00% respectively, according to Morningstar. Three Year performance is +4.78%
Figures for Manulife Preferred Income Fund (formerly AIC Preferred Income Fund) (which are after all fees and expenses) for 1-, 3- and 12-months are +0.39%, +1.12% & +5.27%, respectively. Three Year performance is +5.66%
Figures for Horizons AlphaPro Preferred Share ETF (which are after all fees and expenses) for 1-, 3- and 12-months are +0.56%, +1.86% & +7.67%, respectively.

MAPF returns assume reinvestment of dividends, and are shown after expenses but before fees. Past performance is not a guarantee of future performance. You can lose money investing in Malachite Aggressive Preferred Fund or any other fund. For more information, see the fund’s main page. The fund is available either directly from Hymas Investment Management or through a brokerage account at Odlum Brown Limited.

A problem that has bedevilled the market over the past year has been the OSFI decision not to grandfather Straight Perpetuals as Tier 1 bank capital, and their continued foot-dragging regarding a decision on insurer Straight Perpetuals has segmented the market to the point where trading has become much more difficult. The fund has done well by trading between GWO issues, which have a good range of annual coupons, but is “stuck” in the MFC and SLF issues, which have a much narrower range of coupon, while the IAG DeemedRetractibles are quite illiquid. Until the market became so grossly segmented, this was not so much of a problem – but now banks are not available to swap into (because they are so expensive) and non-regulated companies are likewise deprecated (because they are not DeemedRetractibles; they should not participate in the increase in value that will follow the OSFI decision I anticipate). The fund’s portfolio is, in effect ‘locked in’ to the MFC & SLF issues due to projected gains from a future OSFI decision, to the detriment of trading gains.

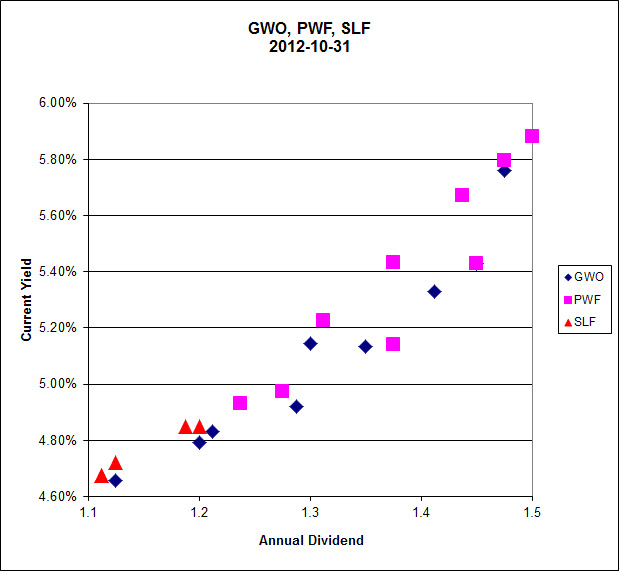
SLF DeemedRetractibles may be compared with PWF and GWO:

Click for Big

It is quite apparent that that the market continues to treat regulated insurance issues (SLF, GWO) no differently from unregulated issues (PWF) – despite the fact that the PWF issues are much more subject to unfavourable calls in the near term and should, logically, be deprecated on those grounds alone without any fancy-pants arguments about imposition of the NVCC rule!

Those of you who have been paying attention will remember that in a “normal” market (which we have not seen in well over a year) the slope of this line is related to the implied volatility of yields in Black-Scholes theory, as discussed in the January, 2010, edition of PrefLetter. The relationship is still far too large to be explained by Implied Volatility – the numbers still indicate an overwhelming degree of directionality in the market’s price expectations.

Sometimes everything works … sometimes it’s 50-50 … sometimes nothing works. The fund seeks to earn incremental return by selling liquidity (that is, taking the other side of trades that other market participants are strongly motivated to execute), which can also be referred to as ‘trading noise’. There were a lot of strongly motivated market participants during the Panic of 2007, generating a lot of noise! Unfortunately, the conditions of the Panic may never be repeated in my lifetime … but the fund will simply attempt to make trades when swaps seem profitable, without worrying about the level of monthly turnover.

There’s plenty of room for new money left in the fund. I have shown in recent issues of PrefLetter that market pricing for FixedResets is demonstrably stupid and I have lots of confidence – backed up by my bond portfolio management experience in the markets for Canadas and Treasuries, and equity trading on the NYSE & TSX – that there is enough demand for liquidity in any market to make the effort of providing it worthwhile (although the definition of “worthwhile” in terms of basis points of outperformance changes considerably from market to market!) I will continue to exert utmost efforts to outperform but it should be borne in mind that there will almost inevitably be periods of underperformance in the future.

The yields available on high quality preferred shares remain elevated, which is reflected in the current estimate of sustainable income.

Calculation of MAPF Sustainable Income Per Unit
Month NAVPU Portfolio
Average
YTW
Leverage
Divisor
Securities
Average
YTW
Capital
Gains
Multiplier
Sustainable
Income
per
current
Unit
June, 2007 9.3114 5.16% 1.03 5.01% 1.3240 0.3524
September 9.1489 5.35% 0.98 5.46% 1.3240 0.3773
December, 2007 9.0070 5.53% 0.942 5.87% 1.3240 0.3993
March, 2008 8.8512 6.17% 1.047 5.89% 1.3240 0.3938
June 8.3419 6.034% 0.952 6.338% 1.3240 $0.3993
September 8.1886 7.108% 0.969 7.335% 1.3240 $0.4537
December, 2008 8.0464 9.24% 1.008 9.166% 1.3240 $0.5571
March 2009 $8.8317 8.60% 0.995 8.802% 1.3240 $0.5872
June 10.9846 7.05% 0.999 7.057% 1.3240 $0.5855
September 12.3462 6.03% 0.998 6.042% 1.3240 $0.5634
December 2009 10.5662 5.74% 0.981 5.851% 1.1141 $0.5549
March 2010 10.2497 6.03% 0.992 6.079% 1.1141 $0.5593
June 10.5770 5.96% 0.996 5.984% 1.1141 $0.5681
September 11.3901 5.43% 0.980 5.540% 1.1141 $0.5664
December 2010 10.7659 5.37% 0.993 5.408% 1.0298 $0.5654
March, 2011 11.0560 6.00% 0.994 5.964% 1.0298 $0.6403
June 11.1194 5.87% 1.018 5.976% 1.0298 $0.6453
September 10.2709 6.10%
Note
1.001 6.106% 1.0298 $0.6090
December, 2011 10.0793 5.63%
Note
1.031 5.805% 1.0000 $0.5851
March, 2012 10.3944 5.13%
Note
0.996 5.109% 1.0000 $0.5310
June 10.2151 5.32%
Note
1.012 5.384% 1.0000 $0.5500
September 10.6703 4.61%
Note
0.997 4.624% 1.0000 $0.4934
October, 2012 10.7577 4.55% 0.993 4.582% 1.0000 $0.4929
NAVPU is shown after quarterly distributions of dividend income and annual distribution of capital gains.
Portfolio YTW includes cash (or margin borrowing), with an assumed interest rate of 0.00%
The Leverage Divisor indicates the level of cash in the account: if the portfolio is 1% in cash, the Leverage Divisor will be 0.99
Securities YTW divides “Portfolio YTW” by the “Leverage Divisor” to show the average YTW on the securities held; this assumes that the cash is invested in (or raised from) all securities held, in proportion to their holdings.
The Capital Gains Multiplier adjusts for the effects of Capital Gains Dividends. On 2009-12-31, there was a capital gains distribution of $1.989262 which is assumed for this purpose to have been reinvested at the final price of $10.5662. Thus, a holder of one unit pre-distribution would have held 1.1883 units post-distribution; the CG Multiplier reflects this to make the time-series comparable. Note that Dividend Distributions are not assumed to be reinvested.
Sustainable Income is the resultant estimate of the fund’s dividend income per current unit, before fees and expenses. Note that a “current unit” includes reinvestment of prior capital gains; a unitholder would have had the calculated sustainable income with only, say, 0.9 units in the past which, with reinvestment of capital gains, would become 1.0 current units.
DeemedRetractibles are comprised of all Straight Perpetuals (both PerpetualDiscount and PerpetualPremium) issued by BMO, BNS, CM, ELF, GWO, HSB, IAG, MFC, NA, RY, SLF and TD, which are not exchangable into common at the option of the company (definition refined in May, 2011). These issues are analyzed as if their prospectuses included a requirement to redeem at par on or prior to 2022-1-31, in addition to the call schedule explicitly defined. See OSFI Does Not Grandfather Extant Tier 1 Capital, CM.PR.D, CM.PR.E, CM.PR.G: Seeking NVCC Status and the January, February, March and June, 2011, editions of PrefLetter for the rationale behind this analysis.
Yields for September, 2011, to January, 2012, were calculated by imposing a cap of 10% on the yields of YLO issues held, in order to avoid their extremely high calculated yields distorting the calculation and to reflect the uncertainty in the marketplace that these yields will be realized. From February to September 2012, yields on these issues have been set to zero. All YLO issues held were sold in October 2012.

Significant positions were held in DeemedRetractible and FixedReset issues on October 31; all of these currently have their yields calculated with the presumption that they will be called by the issuers at par prior to 2022-1-31. This presents another complication in the calculation of sustainable yield. The fund also holds a position various SplitShare issues which also have their yields calculated with the expectation of a maturity at par.

I will no longer show calculations that assume the conversion of the entire portfolio into PerpetualDiscounts, as there are currently only four such issues of investment grade, from only two issuer groups. Additionally, the fund has no holdings of these issues.

It should be noted that the concept of this Sustainable Income calculation was developed when the fund’s holdings were overwhelmingly PerpetualDiscounts – see, for instance, the bottom of the market in November 2008. It is easy to understand that for a PerpetualDiscount, the technique of multiplying yield by price will indeed result in the coupon – a PerpetualDiscount paying $1 annually will show a Sustainable Income of $1, regardless of whether the price is $24 or $17.

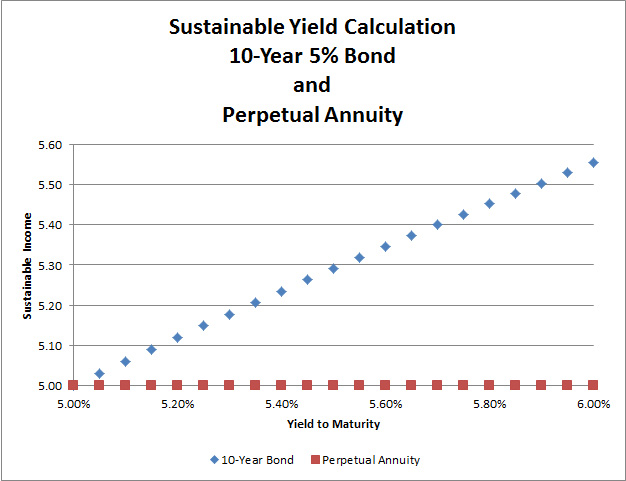
Things are not quite so neat when maturity dates and maturity prices that are different from the current price are thrown into the mix. If we take a notional Straight Perpetual paying $5 annually, the price is $100 when the yield is 5% (all this ignores option effects). As the yield increases to 6%, the price declines to 83.33; and 83.33 x 6% is the same $5. Good enough.

But a ten year bond, priced at 100 when the yield is equal to its coupon of 5%, will decline in price to 92.56; and 92.56 x 6% is 5.55; thus, the calculated Sustainable Income has increased as the price has declined as shown in the graph:

Click for Big

The difference is because the bond’s yield calculation includes the amortization of the discount; therefore, so does the Sustainable Income estimate.

Thus, the decline in the MAPF Sustainable Income from $0.5500 per unit in June to $0.4929 per unit in October should be looked at as a simple consequence of the fund’s holdings; virtually all of which have their yields calculated in a manner closer to bonds than to Perpetual Annuities.

Different assumptions lead to different results from the calculation, but the overall positive trend is apparent. I’m very pleased with the long-term results! It will be noted that if there was no trading in the portfolio, one would expect the sustainable yield to be constant (before fees and expenses). The success of the fund’s trading is showing up in

  • the very good performance against the index
  • the long term increases in sustainable income per unit

As has been noted, the fund has maintained a credit quality equal to or better than the index; outperformance is due to exploitation of trading anomalies.

Again, there are no predictions for the future! The fund will continue to trade between issues in an attempt to exploit market gaps in liquidity, in an effort to outperform the index and keep the sustainable income per unit – however calculated! – growing.

MAPF Portfolio Composition: October 2012

Saturday, November 3rd, 2012

Turnover continued to be almost non-existent in October, remaining at about 2%.

There is extreme segmentation in the marketplace, with OSFI’s NVCC rule changes in February 2011 having had the effect of splitting the formerly relatively homogeneous Straight Perpetual class of preferreds into three parts:

  • Unaffected Straight Perpetuals
  • DeemedRetractibles explicitly subject to the rules (banks)
  • DeemedRetractibles considered by me, but not (yet!) by the market, to be likely to be explicitly subject to the rules in the future (insurers and insurance holding companies)

This segmentation, and the extreme valuation differences between the segments, has cut down markedly on the opportunities for trading. Another trend that hasn’t helped has been the migration of PerpetualDiscounts into PerpetualPremiums (due to price increases) – many of the PerpetualPremiums have negative Yields-to-Worst and those that don’t aren’t particularly thrilling; speaking very generally, PerpetualPremiums are to be avoided, not traded! This effect has caused the first of the three segments noted above to disappear for most practical purposes.

Sectoral distribution of the MAPF portfolio on October 31 was as follows:

MAPF Sectoral Analysis 2012-10-31
HIMI Indices Sector Weighting YTW ModDur
Ratchet 0% N/A N/A
FixFloat 0% N/A N/A
Floater 0% N/A N/A
OpRet 0% N/A N/A
SplitShare 10.0% (-0.1) 4.95% 5.35
Interest Rearing 0% N/A N/A
PerpetualPremium 0.0% (0) N/A N/A
PerpetualDiscount 0.0% (0) N/A N/A
Fixed-Reset 19.2% (-0.6) 2.37% 1.52
Deemed-Retractible 61.5% (-0.3) 5.03% 7.40
Scraps (Various) 8.6% (+0.6) 5.97% 10.49
Cash 0.7% (+0.4) 0.00% 0.00
Total 100% 4.55% 6.28
Totals and changes will not add precisely due to rounding. Bracketted figures represent change from September month-end. Cash is included in totals with duration and yield both equal to zero.
DeemedRetractibles are comprised of all Straight Perpetuals (both PerpetualDiscount and PerpetualPremium) issued by BMO, BNS, CM, ELF, GWO, HSB, IAG, MFC, NA, RY, SLF and TD, which are not exchangable into common at the option of the company. These issues are analyzed as if their prospectuses included a requirement to redeem at par on or prior to 2022-1-31, in addition to the call schedule explicitly defined. See OSFI Does Not Grandfather Extant Tier 1 Capital, CM.PR.D, CM.PR.E, CM.PR.G: NVCC Status Confirmed and the January, February, March and June, 2011, editions of PrefLetter for the rationale behind this analysis. (all recent editions have a short summary of the argument included in the “DeemedRetractible” section)

The “total” reflects the un-leveraged total portfolio (i.e., cash is included in the portfolio calculations and is deemed to have a duration and yield of 0.00.). MAPF will often have relatively large cash balances, both credit and debit, to facilitate trading. Figures presented in the table have been rounded to the indicated precision.

Credit distribution is:

MAPF Credit Analysis 2012-10-31
DBRS Rating Weighting
Pfd-1 0 (0)
Pfd-1(low) 53.2% (-0.8)
Pfd-2(high) 27.5% (-0.1)
Pfd-2 0 (0)
Pfd-2(low) 10.0% (-0.1)
Pfd-3(high) 0.9% (+0.6)
Pfd-3 3.0% (-0.1)
Pfd-4(high) 0.6% (0)
Pfd-4 2.6% (0)
Pfd-4(low) 1.4% (0)
Cash 0.7% (+0.4)
Totals will not add precisely due to rounding. Bracketted figures represent change from September month-end.

Liquidity Distribution is:

MAPF Liquidity Analysis 2012-10-31
Average Daily Trading Weighting
<$50,000 13.9% (+0.2)
$50,000 – $100,000 10.8% (+9.7)
$100,000 – $200,000 46.5% (-2.7)
$200,000 – $300,000 19.6% (-6.6)
>$300,000 8.4% (-1.1)
Cash 0.7% (+0.4)
Totals will not add precisely due to rounding. Bracketted figures represent change from September month-end.

MAPF is, of course, Malachite Aggressive Preferred Fund, a “unit trust” managed by Hymas Investment Management Inc. Further information and links to performance, audited financials and subscription information are available the fund’s web page. The fund may be purchased either directly from Hymas Investment Management or through a brokerage account at Odlum Brown Limited. A “unit trust” is like a regular mutual fund, but is sold by offering memorandum rather than prospectus. This is cheaper, but means subscription is restricted to “accredited investors” (as defined by the Ontario Securities Commission) or those who subscribe for $150,000+. Fund past performances are not a guarantee of future performance. You can lose money investing in MAPF or any other fund.

A similar portfolio composition analysis has been performed on the Claymore Preferred Share ETF (symbol CPD) as of August 31, 2011, and published in the October, 2011, PrefLetter. While direct comparisons are difficult due to the introduction of the DeemedRetractible class of preferred share (see above) it is fair to say:

  • MAPF credit quality is better
  • MAPF liquidity is a lower
  • MAPF Yield is higher
  • Weightings in
    • MAPF is much more exposed to DeemedRetractibles
    • MAPF is much less exposed to Operating Retractibles
    • MAPF is much more exposed to SplitShares
    • MAPF is less exposed to FixFloat / Floater / Ratchet
    • MAPF weighting in FixedResets is much lower

November 2, 2012

Saturday, November 3rd, 2012

There was a good US jobs number:

American employers added more workers than forecast in October and a rush of people entering the labor force pushed the jobless rate higher, according to the last report on the labor market before next week’s presidential election.

Broad-based gains in employment — from car dealers and hospitals to factories and construction sites — indicate consumers are likely to spend more freely and shore up the three-year expansion in the face of a global economic slowdown and political gridlock in Washington over taxes and spending.

Hiring increased by 171,000 workers after a 148,000 gain in September that was bigger than first estimated, Labor Department figures showed today in Washington. October’s increase exceeded the most optimistic forecast in a Bloomberg survey with a median projection of a 125,000 gain. Unemployment rose to 7.9 percent.

Federal Reserve Bank of San Francisco President John Williams spoke in defense of QE3 today:

Concern that large-scale asset purchases “might ignite a bout of inflation” are unwarranted because price increases are being held in check by elevated unemployment and an economy that “isn’t operating at full speed,” Williams said.

“Unemployment is — and should be — a central focus of monetary policy right now,” Williams said. “This concentration on getting unemployment down in no way represents a lessening of the importance of price stability,” he said, adding that inflation may slow well below the Fed’s 2 percent goal if the U.S. recovery falters.

Williams said central bank purchases of bonds will help spur U.S. economic growth to 2.5 percent next year and 3.5 percent in 2014 while not fueling inflation.

“Our policy measures are having the desired effects,” Williams said today in remarks prepared for a speech in Salt Lake City. “We have substantial scope to use monetary policy to stimulate the economy without creating too much upward pressure on prices.”

It was a modestly good day for the Canadian preferred share market, with PerpetualPremiums up 9bp, FixedResets flat and DeemedRetractibles gaining 8bp. Volatility was at normal levels, all to the upside with a preponderance of insurance issues. Volume was below average.

HIMIPref™ Preferred Indices
These values reflect the December 2008 revision of the HIMIPref™ Indices

Values are provisional and are finalized monthly
Index Mean
Current
Yield
(at bid)
Median
YTW
Median
Average
Trading
Value
Median
Mod Dur
(YTW)
Issues Day’s Perf. Index Value
Ratchet 0.00 % 0.00 % 0 0.00 0 0.5756 % 2,471.4
FixedFloater 4.11 % 3.45 % 35,122 18.43 1 0.0000 % 3,912.6
Floater 2.80 % 2.99 % 58,877 19.74 4 0.5756 % 2,668.4
OpRet 4.61 % 0.72 % 42,941 0.61 4 -0.0855 % 2,577.1
SplitShare 5.37 % 4.58 % 63,472 4.47 3 -0.0783 % 2,857.4
Interest-Bearing 0.00 % 0.00 % 0 0.00 0 -0.0855 % 2,356.5
Perpetual-Premium 5.27 % 1.71 % 71,814 0.31 29 0.0889 % 2,314.3
Perpetual-Discount 4.91 % 4.93 % 105,156 15.56 3 0.2347 % 2,593.1
FixedReset 5.00 % 3.02 % 213,547 3.94 74 -0.0042 % 2,444.7
Deemed-Retractible 4.92 % 3.49 % 133,721 1.12 46 0.0772 % 2,392.7
Performance Highlights
Issue Index Change Notes
PWF.PR.M FixedReset 1.00 % YTW SCENARIO
Maturity Type : Call
Maturity Date : 2014-01-31
Maturity Price : 25.00
Evaluated at bid price : 26.20
Bid-YTW : 2.11 %
GWO.PR.M Deemed-Retractible 1.01 % YTW SCENARIO
Maturity Type : Call
Maturity Date : 2015-03-31
Maturity Price : 26.00
Evaluated at bid price : 26.98
Bid-YTW : 4.18 %
TRI.PR.B Floater 1.05 % YTW SCENARIO
Maturity Type : Limit Maturity
Maturity Date : 2042-11-02
Maturity Price : 22.00
Evaluated at bid price : 22.23
Bid-YTW : 2.35 %
GWO.PR.P Deemed-Retractible 1.25 % YTW SCENARIO
Maturity Type : Hard Maturity
Maturity Date : 2022-01-31
Maturity Price : 25.00
Evaluated at bid price : 26.68
Bid-YTW : 4.60 %
Volume Highlights
Issue Index Shares
Traded
Notes
BNS.PR.Z FixedReset 174,415 Desjardins crossed 150,000 at 25.13.
YTW SCENARIO
Maturity Type : Hard Maturity
Maturity Date : 2022-01-31
Maturity Price : 25.00
Evaluated at bid price : 25.08
Bid-YTW : 3.03 %
GWO.PR.J FixedReset 173,896 Desjardins crossed three blocks: 85,000 and two of 42,300 each, all at 26.00.
YTW SCENARIO
Maturity Type : Call
Maturity Date : 2013-12-31
Maturity Price : 25.00
Evaluated at bid price : 26.04
Bid-YTW : 2.84 %
FTS.PR.H FixedReset 102,944 TD crossed 100,000 at 25.65.
YTW SCENARIO
Maturity Type : Limit Maturity
Maturity Date : 2042-11-02
Maturity Price : 23.65
Evaluated at bid price : 25.60
Bid-YTW : 2.76 %
BAM.PR.M Perpetual-Discount 82,691 RBC crossed blocks of 30,000 shares, 10,000 and 38,100, all at 24.25.
YTW SCENARIO
Maturity Type : Limit Maturity
Maturity Date : 2042-11-02
Maturity Price : 23.98
Evaluated at bid price : 24.27
Bid-YTW : 4.93 %
IGM.PR.B Perpetual-Premium 81,001 RBC crossed 74,000 at 27.45.
YTW SCENARIO
Maturity Type : Call
Maturity Date : 2014-12-31
Maturity Price : 26.00
Evaluated at bid price : 27.39
Bid-YTW : 3.13 %
TD.PR.G FixedReset 65,131 TD crossed 60,300 at 26.55.
YTW SCENARIO
Maturity Type : Call
Maturity Date : 2014-04-30
Maturity Price : 25.00
Evaluated at bid price : 26.46
Bid-YTW : 2.26 %
There were 24 other index-included issues trading in excess of 10,000 shares.
Wide Spread Highlights
Issue Index Quote Data and Yield Notes
BMO.PR.K Deemed-Retractible Quote: 26.12 – 26.68
Spot Rate : 0.5600
Average : 0.3322

YTW SCENARIO
Maturity Type : Call
Maturity Date : 2012-12-25
Maturity Price : 26.00
Evaluated at bid price : 26.12
Bid-YTW : -0.32 %

W.PR.H Perpetual-Premium Quote: 25.53 – 26.00
Spot Rate : 0.4700
Average : 0.3322

YTW SCENARIO
Maturity Type : Call
Maturity Date : 2013-01-15
Maturity Price : 25.00
Evaluated at bid price : 25.53
Bid-YTW : -3.53 %

MFC.PR.E FixedReset Quote: 26.23 – 26.48
Spot Rate : 0.2500
Average : 0.1708

YTW SCENARIO
Maturity Type : Call
Maturity Date : 2014-09-19
Maturity Price : 25.00
Evaluated at bid price : 26.23
Bid-YTW : 3.28 %

PWF.PR.I Perpetual-Premium Quote: 25.48 – 25.74
Spot Rate : 0.2600
Average : 0.1810

YTW SCENARIO
Maturity Type : Call
Maturity Date : 2012-12-02
Maturity Price : 25.00
Evaluated at bid price : 25.48
Bid-YTW : -16.09 %

SLF.PR.F FixedReset Quote: 26.47 – 26.73
Spot Rate : 0.2600
Average : 0.1947

YTW SCENARIO
Maturity Type : Call
Maturity Date : 2014-06-30
Maturity Price : 25.00
Evaluated at bid price : 26.47
Bid-YTW : 2.72 %

BNA.PR.E SplitShare Quote: 25.52 – 25.77
Spot Rate : 0.2500
Average : 0.1915

YTW SCENARIO
Maturity Type : Hard Maturity
Maturity Date : 2017-12-10
Maturity Price : 25.00
Evaluated at bid price : 25.52
Bid-YTW : 4.58 %

Press: No shortage of risk in preferred shares (April 2012)

Friday, November 2nd, 2012

I’m way late reporting this, but I only just realized I hadn’t added it to my press clippings file!

Scott Blythe was kind enough to quote me in his advisor.ca Special Report No shortage of risk in preferred shares:

“One thing to consider is who benefits from new issuance. There was a big spike in spring 2009 when all of the banks were busily raising capital hand over fist,” notes James Hymas, who blogs on preferred shares and runs the Malachite Aggressive Preferred Share Fund. “We’re certainly not back to those levels yet, but on the whole the preferred share market has grown considerably over the last 10 years. There are a lot of new issuers coming out and some of the old issuers are starting to put their toes back into the water.”

Because of their place in the credit structure behind bondholders, investors could be wiped out. Hymas notes two major issues that have defaulted: Nortel and Quebecor World.

Hymas estimates that preferreds trade at a yield of 195 basis points over equivalent corporate debt. Of that, 10 basis points can be attributed to credit risk. The rest is a liquidity premium.

“Liquidity is extremely important in the preferred share market; you can make excess returns by selling liquidity and you can get make horrible returns by buying it.”

“It depends a lot on the time scale that you want to look at,” says Hymas. “On a day-to-day basis, individual issues can vary considerably and also on a day-to-day basis the market as a whole can do very extreme things for various reasons. However over the long run, the market is only a little bit more volatile than long corporate bonds.”

“There are two major components to the prices: the credit risk and the interest rate risk,” Hymas explains. “The fixed resets and the floaters address the interest-rate part of the equation but they do not address the credit risk part of the equation. So a lot of people tend to buy fixed resets, for instance, on the grounds that they are just five year issues, but that is not correct. The interest rate risk might be about five years, but the credit risk is forever.”

On credit risk, PFD1 indicates stability as good as a bank; PFD 2 ratings are equivalent to an investment grade corporate bond, while PFD 3 is more like a good high-yield bond.

That said, Hymas advises against buying solely on yield.

“A lot of people attempt to build fixed income portfolios from the bottom-up, which is a horrible mistake. A fixed income portfolio should always be built from the top down, meaning that you first understand what the client is attempting to accomplish with his portfolio and then pick pieces out of the jigsaw puzzle that fit. It’s simply a question of keeping in mind what the client is attempting to do.

“Simply ‘making money’ is not an investment plan, though there are many advisors who will tell you different.”

November 1, 2012

Friday, November 2nd, 2012

Today we had a demonstration of the Law of Conservation of Hardware Manufacturers. RIM had a good day:

RIM shares rallied 10 per cent on Thursday, as of late afternoon, sending them to their highest level since July. The jump followed an update on its BlackBerry 10 device on Wednesday: RIM is testing the new smartphone among 50 wireless carriers, marking a big step toward launching the product early next year – likely some time between January and April.

Scott Anthony of Bloomberg has some colour on why RIM isn’t dead yet:

RIM’s proprietary network and tightly interconnected system allow it to use data incredibly efficiently. Here’s one illustration. The other week I was on an 18-hour flight between Newark and Singapore. Singapore Airlines has started rolling out Internet connectivity on this flight. It isn’t cheap, running $1 per megabyte of data. I didn’t dare turn on my iPhone, or open up Outlook, but I thought going to Web mail would be safe. 15 minutes later I had a $15.30 bill. Then I remembered the Blackberry in my bag. I connected it to the WiFi network, and had roughly 14 hours of email connectivity. By the end of the trip my bill had gone from $15.30 to $15.45.

… and Sharp had a bad one:

Sharp Corp. (6753), the world’s worst- performing major stock, dropped in Tokyo trading after forecasting a record $5.6 billion full-year loss and saying there is “material doubt” about its ability to survive.

The shares fell as much as 5.3 percent to 160 yen and changed hands at 163 yen as of 10:00 a.m., extending this year’s decline to 76 percent, the worst performer among more than 1,600 companies in the MSCI World (MXWO) Index.

Sharp follows Panasonic Corp. (6752) in predicting losses worse than analysts estimated after losing ground to Samsung Electronics Co. (005930) in TVs. Sharp has failed to win a planned 67 billion-yen ($835 million) investment from Taiwan’s Foxconn Technology Group and has had difficulty selling commercial paper as it burns through cash.

Samsung is eating everybody’s lunch … for now:

Samsung Electronics Co. (005930), the world’s biggest maker of TVs and mobile phones, reported record profit that beat analysts’ estimates and forecast intensifying competition as the global economy slows.

Net income in the three months ended Sept. 30 rose 91 percent to 6.56 trillion won ($6 billion), the Suwon, South Korea-based company said in a statement today. That compares with the 6.25 trillion-won average of 27 analyst estimates compiled by Bloomberg.

Operating profit from telecommunications more than doubled as Samsung’s Galaxy devices widened their lead over Apple Inc.’s iPhone. Samsung shares dropped amid concern growth in smartphone demand may have peaked after Apple (AAPL) reported earnings that missed estimates and Microsoft Corp. released its Surface tablet, escalating competition for mobile devices.

There’s some bad news for Canadian capital spending:

Suncor Energy Inc.’s three major oil sands projects are facing delays as soaring costs and competitive oil markets force the energy giant to join the growing ranks of Canadian resource companies pulling back from expensive growth plans.

Canada’s largest oil company said its planned Voyageur upgrader is “struggling” to make financial sense, its undeveloped Fort Hills bitumen mine has likely been delayed by about a year, and the timetable for its Joslyn mine remains up in the air. As Suncor reviews the economics of all three projects, it sliced its 2012 budget by 11 per cent.

It was a mixed day for the Canadian preferred share market, with PerpetualPremiums down 8bp, FixedResets off 2bp and DeemedRetractibles gaining 3bp. Volatility picked up a little, but it’s still pretty quiet! Volume was a little below average.

HIMIPref™ Preferred Indices
These values reflect the December 2008 revision of the HIMIPref™ Indices

Values are provisional and are finalized monthly
Index Mean
Current
Yield
(at bid)
Median
YTW
Median
Average
Trading
Value
Median
Mod Dur
(YTW)
Issues Day’s Perf. Index Value
Ratchet 0.00 % 0.00 % 0 0.00 0 -0.6913 % 2,457.2
FixedFloater 4.11 % 3.45 % 34,847 18.44 1 1.0941 % 3,912.6
Floater 2.81 % 3.00 % 61,105 19.71 4 -0.6913 % 2,653.1
OpRet 4.61 % -0.00 % 40,599 0.65 4 0.3335 % 2,579.3
SplitShare 5.37 % 4.58 % 65,896 4.47 3 0.3929 % 2,859.7
Interest-Bearing 0.00 % 0.00 % 0 0.00 0 0.3335 % 2,358.5
Perpetual-Premium 5.28 % 1.69 % 74,370 0.31 29 -0.0808 % 2,312.2
Perpetual-Discount 4.92 % 4.94 % 106,696 15.55 3 0.1798 % 2,587.1
FixedReset 5.00 % 3.00 % 205,815 3.94 74 -0.0209 % 2,444.8
Deemed-Retractible 4.92 % 3.15 % 130,681 0.80 46 0.0288 % 2,390.8
Performance Highlights
Issue Index Change Notes
TRI.PR.B Floater -2.31 % YTW SCENARIO
Maturity Type : Limit Maturity
Maturity Date : 2042-11-01
Maturity Price : 21.75
Evaluated at bid price : 22.00
Bid-YTW : 2.37 %
BAM.PR.G FixedFloater 1.09 % YTW SCENARIO
Maturity Type : Limit Maturity
Maturity Date : 2042-11-01
Maturity Price : 23.36
Evaluated at bid price : 23.10
Bid-YTW : 3.45 %
BAM.PR.O OpRet 1.33 % YTW SCENARIO
Maturity Type : Option Certainty
Maturity Date : 2013-06-30
Maturity Price : 25.00
Evaluated at bid price : 25.94
Bid-YTW : -0.00 %
Volume Highlights
Issue Index Shares
Traded
Notes
BAM.PR.M Perpetual-Discount 238,869 YTW SCENARIO
Maturity Type : Limit Maturity
Maturity Date : 2042-11-01
Maturity Price : 23.93
Evaluated at bid price : 24.22
Bid-YTW : 4.94 %
IGM.PR.B Perpetual-Premium 72,740 YTW SCENARIO
Maturity Type : Call
Maturity Date : 2014-12-31
Maturity Price : 26.00
Evaluated at bid price : 27.37
Bid-YTW : 3.16 %
CU.PR.E Perpetual-Premium 66,200 YTW SCENARIO
Maturity Type : Call
Maturity Date : 2021-09-01
Maturity Price : 25.00
Evaluated at bid price : 26.60
Bid-YTW : 4.16 %
TD.PR.A FixedReset 42,290 YTW SCENARIO
Maturity Type : Call
Maturity Date : 2014-01-31
Maturity Price : 25.00
Evaluated at bid price : 25.65
Bid-YTW : 2.89 %
FTS.PR.F Perpetual-Premium 40,570 YTW SCENARIO
Maturity Type : Call
Maturity Date : 2014-12-01
Maturity Price : 25.25
Evaluated at bid price : 25.90
Bid-YTW : 3.99 %
RY.PR.P FixedReset 34,858 YTW SCENARIO
Maturity Type : Call
Maturity Date : 2014-02-24
Maturity Price : 25.00
Evaluated at bid price : 26.26
Bid-YTW : 2.06 %
There were 25 other index-included issues trading in excess of 10,000 shares.
Wide Spread Highlights
Issue Index Quote Data and Yield Notes
TRI.PR.B Floater Quote: 22.00 – 22.50
Spot Rate : 0.5000
Average : 0.3351

YTW SCENARIO
Maturity Type : Limit Maturity
Maturity Date : 2042-11-01
Maturity Price : 21.75
Evaluated at bid price : 22.00
Bid-YTW : 2.37 %

CU.PR.D Perpetual-Premium Quote: 26.60 – 26.94
Spot Rate : 0.3400
Average : 0.2145

YTW SCENARIO
Maturity Type : Call
Maturity Date : 2021-09-01
Maturity Price : 25.00
Evaluated at bid price : 26.60
Bid-YTW : 4.16 %

GWO.PR.M Deemed-Retractible Quote: 26.71 – 26.95
Spot Rate : 0.2400
Average : 0.1504

YTW SCENARIO
Maturity Type : Call
Maturity Date : 2015-03-31
Maturity Price : 26.00
Evaluated at bid price : 26.71
Bid-YTW : 4.63 %

ENB.PR.F FixedReset Quote: 25.53 – 25.75
Spot Rate : 0.2200
Average : 0.1441

YTW SCENARIO
Maturity Type : Limit Maturity
Maturity Date : 2042-11-01
Maturity Price : 23.29
Evaluated at bid price : 25.53
Bid-YTW : 3.69 %

PWF.PR.K Perpetual-Premium Quote: 25.03 – 25.30
Spot Rate : 0.2700
Average : 0.2066

YTW SCENARIO
Maturity Type : Call
Maturity Date : 2014-10-31
Maturity Price : 25.00
Evaluated at bid price : 25.03
Bid-YTW : 4.92 %

SLF.PR.C Deemed-Retractible Quote: 23.82 – 23.99
Spot Rate : 0.1700
Average : 0.1087

YTW SCENARIO
Maturity Type : Hard Maturity
Maturity Date : 2022-01-31
Maturity Price : 25.00
Evaluated at bid price : 23.82
Bid-YTW : 5.18 %

New Issue: FTS 4.75% Straight Perpetual

Thursday, November 1st, 2012

Fortis Inc. has announced that it:

has today entered into an agreement with a syndicate of underwriters led by BMO Capital Markets and RBC Capital Markets under which the underwriters have agreed to purchase, on a bought deal basis, 6,000,000 Cumulative Redeemable First Preference Shares, Series J (the “Preference Shares”) for sale to the public at a price of $25.00 per Preference Share, representing aggregate gross proceeds of $150 million.

Fortis has granted the underwriters an underwriters’ option to purchase an additional 2,000,000 Preference Shares at the same offering price. Should the underwriters’ option be fully exercised, the total gross proceeds of the Preference Share offering will be $200 million.

Holders of Preference Shares will be entitled to receive a cumulative quarterly fixed dividend of 4.75% per annum, if, as and when declared by the Board of Directors of the Corporation payable (other than the first dividend payment) in equal quarterly instalments on the first day of March, June, September and December of each year. Assuming a closing date of November 13, 2012, the first dividend will be payable on March 1, 2013 in the amount of $0.35137 per Preference Share.

The Preference Shares are not redeemable prior to December 1, 2017. On or after December 1, 2017, the Corporation may, on not less than 30 nor more than 60 days’ notice, redeem the Preference Shares in whole or in part, at the Corporation’s option, by the payment in cash of $26.00 per Preference Share if redeemed prior to December 1, 2018, at $25.75 per Preference Share if redeemed on or after December 1, 2018 but prior to December 1, 2019, at $25.50 if redeemed on or after December 1, 2019 but prior to December 1, 2020, at $25.25 if redeemed on or after December 1, 2020 but prior to December 1, 2021 and at $25.00 per Preference Share if redeemed on or after December 1, 2021, in each case together with all declared and unpaid dividends up to but excluding the date fixed for redemption.

The Preference Share offering is expected to close on November 13, 2012. The Offering is subject to the receipt of all necessary regulatory and stock exchange approvals. The net proceeds from the issue will be used towards repaying borrowings under the Corporation’s $1 billion committed corporate credit facility, which borrowings were primarily incurred to support the construction of the non-regulated Waneta Expansion hydroelectric generating facility and for other general corporate purposes.

October 31, 2012

Thursday, November 1st, 2012

It has been a good year for corporate bond issuance:

Corporate bond sales surged to $3.3 trillion this year, challenging the record in 2009, as investors sought higher-yielding alternatives to government securities and companies took advantage of borrowing costs at all-time lows.

General Electric Co. (GE), the biggest maker of power-generation equipment, led issuers this month with a $7 billion bond offering, according to data compiled by Bloomberg. Along with software provider Oracle Corp. (ORCL)’s $5 billion sale, they paced $347 billion of bond issuance in October, a record for the month, and left sales about $116 billion shy of the $3.4 trillion reached by this time three years ago.

Yields on bonds sold by companies around the world fell to a record 2.676 percent on Oct. 15 from 3.981 percent at the end of last year, according to Bank of America Merrill Lynch’s Global Broad Market Corporate index.

In the spirit of Hallowe’en, here’s an illustration from an absolutely fascinating article titled Animal Mind Control:

DBRS confirmed Valener at Pfd-2(low) (VNR.PR.A):

DBRS has today confirmed Valener Inc.’s (Valener) Cumulative Rate Reset Preferred Shares, Series A at Pfd-2 (low), with a Stable trend. The rating is based on the credit quality of Valener’s 29%-owned Gaz Métro Limited Partnership (GMLP), which guarantees the First Mortgage Bonds (rated “A” by DBRS) of Gaz Métro inc. (GMi). GMi owns the remaining 71% of GMLP. GMLP’s core business is regulated natural gas distribution in Québec, which generates strong cash flow due to a supportive and stable regulatory environment. GMLP also benefits from cash flow diversification from its investments in energy distribution in Vermont and the pipeline business (see the rating report on Gaz Métro inc. dated October 31, 2012). Valener’s rating is one notch lower than the rating of GMi, reflecting its structural subordination to GMLP.

The assigned provisional rating is based on the following factors: (1) Strong and predictable cash flow from GMLP to Valener. GMLP has made cash distributions to its partners in an amount of over 90% of its net income, excluding non-recurring items, for most years over the last 20 years. (2) GMLP is expected to continue to maintain its distributions of at least 85% of its net income, excluding non-recurring items, as set out under the partnership agreement between Valener and GMLP (the Partnership Agreement). In the event that GMi, as general partner of GMLP, intends to distribute less than 85% of its net income, excluding non-recurring items, it would require the approval of at least 90% of GMi’s directors. (3) Valener’s non-consolidated debt-to-capital structure is expected to remain below 20%. If its non-consolidated debt leverage ratio is above 20%, Valener is expected to issue equity to bring the ratio back under the 20% threshold in a timely manner. (4) DBRS expects that the majority of Valener’s cash flow will be derived from GMLP. Any material investment carried out by Valener and not through GMLP could have a negative rating impact. (5) DBRS expects that Valener will maintain its 29% interest in GMLP and its pro rata representation on GMi’s board of directors.

The assigned rating incorporates the limited control of Valener over GMLP due to its limited partnership status. However, this limited control is mitigated by the distribution protection clause in the Partnership Agreement, as mentioned above.

DBRS confirmed Power Corporation at Pfd-2(high) (POW.PR.A, POW.PR.B, POW.PR.C, POW.PR.D, POW.PR.F, POW.PR.G):

DBRS has today confirmed the long-term and preferred shares ratings of Power Corporation of Canada (POW or the Company) at A (high) and Pfd-2 (high), respectively. The trend on the ratings remains Stable. The credit strength of POW is directly tied to its 66.1% equity interest in Power Financial Corporation (PWF; see separate press release), which represents a substantial majority of the Company’s earnings and cash flow, as well as 82% of the Company’s estimated net asset value as of June 30, 2012. The Senior Debt rating of the Company is A (high), or one notch below the AA (low) rating on the Senior Debentures of PWF, reflecting the structural subordination of the holding company’s obligations.

The Company remains exposed to the advice-centered distribution model of protection and wealth management products and services through its indirect investment in PWF’s major subsidiaries, Great-West Lifeco Inc. (GWO) and IGM Financial Inc. (IGM). Correspondingly, it is vulnerable to the financial market and economic volatility that affects asset management fees, required actuarial reserves tied to equity markets, and the level of interest rates, as well as credit loss provisions.

As the controlling shareholder of PWF, and, by extension, of GWO and IGM, POW defines the strategic vision for its financial services investments, while setting the “tone from the top” in terms of conservative management style and risk analysis and tolerance. The Company’s senior officers and delegates exercise a greater degree of influence through their active participation on the respective boards and board committees of POW’s various subsidiaries than is generally the case at more widely held companies. Such an integrated management and governance approach is seldom encountered, and it has served the Company’s stakeholders well.

On a stand-alone basis, POW’s financial profile is very conservative, with debt and preferred shares representing just 13.1% of capitalization, albeit up from 7.9% at year-end 2007. There is no double leverage in the Company’s capital structure as only shareholders’ equity, and not the proceeds from debt or preferred shares, is invested in the Company’s investment portfolio. Financial leverage appears to be used to fund a portfolio of cash and short-term investments and a modest level of working capital.

DBRS confirmed PWF at Pfd-1(low) (PWF.PR.A, PWF.PR.E, PWF.PR.F, PWF.PR.G, PWF.PR.H, PWF.PR.I, PWF.PR.K, PWF.PR.L, PWF.PR.M, PWF.PR.O, PWF.PR.P and PWF.PR.R):

DBRS has today confirmed the long-term and preferred shares ratings of Power Financial Corporation (PWF, the Company or the Group) at AA (low) and Pfd-1 (low), respectively. The rating trends remain Stable. The financial strength of PWF is largely derived from its controlling interests in two of Canada’s leading financial service providers: Great-West Lifeco Inc. (GWO – senior rating of AA (low)), one of the three largest life insurance concerns in Canada, and IGM Financial Inc. (IGM – senior rating of A (high)), one of the largest mutual fund complexes in Canada as measured by long-term assets under management (AUM) on June 30, 2012. These two interests, accounting for approximately 90% of the Company’s earnings, dividends and asset value, are a source of stable recurring earnings and cash flow. Under the strategic leadership of the Company, both GWO and IGM have become increasingly diversified as they have grown both organically and by acquisition. The Company has correspondingly increased its exposure to the wealth management business in all of its chosen geographies. Both of these subsidiaries, in turn, benefit from the Company’s hands-on governance, and risk-averse culture.

Given an uncertain economic environment that could limit organic growth, DBRS expects that PWF will take advantage of its strong financial position to pursue small tactical acquisitions in the financial services arena. Pressures on regulatory capital adequacy could conceivably encourage a number of financial institutions to sell certain business lines at opportunistic prices, which would complement and leverage those of the Company. For example, achieving additional scale in Putnam through the acquisition of incremental AUM with a shared distribution channel would bring its financial results closer to the Company’s original target while supporting broader growth initiatives. That PWF retains the ability to consider such value-added acquisitions in the current environment is a testament to its conservative financial profile and its long-term perspective.

The Company’s financial leverage has been maintained at the same level for the past ten years. At a 17.6% unconsolidated total debt ratio at the end of June 2012, the Company’s capitalization remains conservative, with no double leverage when the perpetual preferred shares are treated as permanent equity. Debt service coverage ratios are similarly strong at between 13 and 15 times on an operating earnings basis and between 8 and 9 times on a cash flow basis. Liquidity is not a source of concern, with close to $1 billion in cash and short-term securities at the holding company at June 30, 2012, in addition to stores of liquidity at both GWO and IGM with which to shore up regulatory capital or to facilitate potential strategic acquisitions. Such retention of liquid assets in the current uncertain economic environment reflects a unified and consistent approach to risk management across the organization. Financial flexibility is additionally enhanced by the proven access by the Company and its investee companies to capital markets funding, notably perpetual preferred shares.

The Canadian preferred share market closed the month on a high note, with PerpetualPremiums up 12bp, FixedResets gaining 2bp and DeemedRetractibles winning 24bp. Given the surge, it was surprising that volatility was so muted. Volume was above average.

PerpetualDiscounts now yield 4.93%, equivalent to 6.41% interest at the standard equivalency factor of 1.3x. Long corporates are now at about 4.3%, so the pre-tax interest-equivalent spread (in this context, the “Seniority Spread”) is now 210bp, a slight (and perhaps spurious) increase from the 205bp reported October 24.

HIMIPref™ Preferred Indices
These values reflect the December 2008 revision of the HIMIPref™ Indices

Values are provisional and are finalized monthly
Index Mean
Current
Yield
(at bid)
Median
YTW
Median
Average
Trading
Value
Median
Mod Dur
(YTW)
Issues Day’s Perf. Index Value
Ratchet 0.00 % 0.00 % 0 0.00 0 0.2132 % 2,474.3
FixedFloater 4.16 % 3.49 % 35,007 18.36 1 0.4396 % 3,870.3
Floater 2.79 % 3.00 % 57,603 19.71 4 0.2132 % 2,671.6
OpRet 4.62 % 2.03 % 40,214 0.65 4 0.0667 % 2,570.7
SplitShare 5.39 % 4.64 % 66,905 4.48 3 0.1443 % 2,848.5
Interest-Bearing 0.00 % 0.00 % 0 0.00 0 0.0667 % 2,350.7
Perpetual-Premium 5.27 % 0.48 % 81,723 0.21 27 0.1176 % 2,314.1
Perpetual-Discount 5.01 % 4.93 % 42,576 15.47 4 -0.0512 % 2,582.4
FixedReset 4.98 % 3.00 % 211,694 3.94 73 0.0233 % 2,445.3
Deemed-Retractible 4.92 % 3.14 % 129,407 0.80 46 0.2415 % 2,390.1
Performance Highlights
Issue Index Change Notes
IAG.PR.A Deemed-Retractible 1.11 % YTW SCENARIO
Maturity Type : Hard Maturity
Maturity Date : 2022-01-31
Maturity Price : 25.00
Evaluated at bid price : 24.65
Bid-YTW : 4.87 %
TRI.PR.B Floater 1.44 % YTW SCENARIO
Maturity Type : Limit Maturity
Maturity Date : 2042-10-31
Maturity Price : 22.25
Evaluated at bid price : 22.52
Bid-YTW : 2.31 %
Volume Highlights
Issue Index Shares
Traded
Notes
TD.PR.Y FixedReset 215,600 YTW SCENARIO
Maturity Type : Hard Maturity
Maturity Date : 2022-01-31
Maturity Price : 25.00
Evaluated at bid price : 25.33
Bid-YTW : 3.10 %
BMO.PR.K Deemed-Retractible 179,622 YTW SCENARIO
Maturity Type : Call
Maturity Date : 2012-12-25
Maturity Price : 26.00
Evaluated at bid price : 26.17
Bid-YTW : -1.57 %
BNS.PR.O Deemed-Retractible 77,700 YTW SCENARIO
Maturity Type : Call
Maturity Date : 2013-04-26
Maturity Price : 26.00
Evaluated at bid price : 26.70
Bid-YTW : -0.22 %
IAG.PR.E Deemed-Retractible 77,640 YTW SCENARIO
Maturity Type : Call
Maturity Date : 2014-12-31
Maturity Price : 26.00
Evaluated at bid price : 26.57
Bid-YTW : 4.97 %
BAM.PR.B Floater 72,118 YTW SCENARIO
Maturity Type : Limit Maturity
Maturity Date : 2042-10-31
Maturity Price : 17.55
Evaluated at bid price : 17.55
Bid-YTW : 3.01 %
CU.PR.C FixedReset 64,003 YTW SCENARIO
Maturity Type : Call
Maturity Date : 2017-06-01
Maturity Price : 25.00
Evaluated at bid price : 26.09
Bid-YTW : 3.15 %
There were 37 other index-included issues trading in excess of 10,000 shares.
Wide Spread Highlights
Issue Index Quote Data and Yield Notes
GWO.PR.F Deemed-Retractible Quote: 25.60 – 25.90
Spot Rate : 0.3000
Average : 0.2144

YTW SCENARIO
Maturity Type : Call
Maturity Date : 2012-11-30
Maturity Price : 25.00
Evaluated at bid price : 25.60
Bid-YTW : -16.24 %

IAG.PR.C FixedReset Quote: 26.19 – 26.50
Spot Rate : 0.3100
Average : 0.2257

YTW SCENARIO
Maturity Type : Call
Maturity Date : 2013-12-31
Maturity Price : 25.00
Evaluated at bid price : 26.19
Bid-YTW : 2.52 %

PWF.PR.K Perpetual-Premium Quote: 25.09 – 25.30
Spot Rate : 0.2100
Average : 0.1370

YTW SCENARIO
Maturity Type : Call
Maturity Date : 2014-10-31
Maturity Price : 25.00
Evaluated at bid price : 25.09
Bid-YTW : 4.79 %

BAM.PF.B FixedReset Quote: 25.42 – 25.64
Spot Rate : 0.2200
Average : 0.1501

YTW SCENARIO
Maturity Type : Limit Maturity
Maturity Date : 2042-10-31
Maturity Price : 23.23
Evaluated at bid price : 25.42
Bid-YTW : 3.86 %

RY.PR.H Deemed-Retractible Quote: 26.50 – 26.80
Spot Rate : 0.3000
Average : 0.2334

YTW SCENARIO
Maturity Type : Call
Maturity Date : 2013-05-24
Maturity Price : 26.00
Evaluated at bid price : 26.50
Bid-YTW : 1.33 %

SLF.PR.F FixedReset Quote: 26.42 – 26.70
Spot Rate : 0.2800
Average : 0.2141

YTW SCENARIO
Maturity Type : Call
Maturity Date : 2014-06-30
Maturity Price : 25.00
Evaluated at bid price : 26.42
Bid-YTW : 2.83 %