Archive for May, 2013

May 10, 2013

Friday, May 10th, 2013

Bernanke gave a speech of note titled Monitoring the Financial System:

A fair summary is that, while the shadow banking sector is smaller today than before the crisis and some of its least stable components have either disappeared or been reformed, regulators and the private sector need to address remaining vulnerabilities. For example, although money market funds were strengthened by reforms undertaken by the Securities and Exchange Commission (SEC) in 2010, the possibility of a run on these funds remains–for instance, if a fund should “break the buck,” or report a net asset value below 99.5 cents, as the Reserve Primary Fund did in 2008. The risk is increased by the fact that the Treasury no longer has the power to guarantee investors’ holdings in money funds, an authority that was critical for stopping the 2008 run. In November 2012, the FSOC proposed for public comment some alternative approaches for the reform of money funds. The SEC is currently considering these and other possible steps.

In light of the current low interest rate environment, we are watching particularly closely for instances of “reaching for yield” and other forms of excessive risk-taking, which may affect asset prices and their relationships with fundamentals. It is worth emphasizing that looking for historically unusual patterns or relationships in asset prices can be useful even if you believe that asset markets are generally efficient in setting prices. For the purpose of safeguarding financial stability, we are less concerned about whether a given asset price is justified in some average sense than in the possibility of a sharp move. Asset prices that are far from historically normal levels would seem to be more susceptible to such destabilizing moves.

From a financial stability perspective, however, the assessment of asset valuations is only the first step of the analysis. Also to be considered are factors such as the leverage and degree of maturity mismatch being used by the holders of the asset, the liquidity of the asset, and the sensitivity of the asset’s value to changes in broad financial conditions. Differences in these factors help explain why the correction in equity markets in 2000 and 2001 did not induce widespread systemic disruptions, while the collapse in house prices and in the quality of mortgage credit during the 2007-09 crisis had much more far-reaching effects: The losses from the stock market declines in 2000 and 2001 were widely diffused, while mortgage losses were concentrated–and, through various financial instruments, amplified–in critical parts of the financial system, resulting ultimately in panic, asset fire sales, and the collapse of credit markets.

It was a mildly negative day for the Canadian preferred share market, with PerpetualPremiums down 5bp, FixedResets off 2bp and DeemedRetractibles flat. Volatility was ho-hum. Volume was low.

HIMIPref™ Preferred Indices
These values reflect the December 2008 revision of the HIMIPref™ Indices

Values are provisional and are finalized monthly
Index Mean
Current
Yield
(at bid)
Median
YTW
Median
Average
Trading
Value
Median
Mod Dur
(YTW)
Issues Day’s Perf. Index Value
Ratchet 0.00 % 0.00 % 0 0.00 0 -0.3711 % 2,580.1
FixedFloater 3.91 % 3.14 % 33,480 18.81 1 -0.6953 % 4,199.1
Floater 2.70 % 2.92 % 83,424 19.91 4 -0.3711 % 2,785.9
OpRet 4.81 % -1.07 % 66,310 0.14 5 -0.0106 % 2,612.6
SplitShare 4.79 % 4.25 % 109,762 4.07 5 0.2492 % 2,969.9
Interest-Bearing 0.00 % 0.00 % 0 0.00 0 -0.0106 % 2,389.0
Perpetual-Premium 5.21 % 2.25 % 92,420 0.43 31 -0.0469 % 2,380.9
Perpetual-Discount 4.86 % 4.89 % 198,272 15.61 4 -0.1016 % 2,679.1
FixedReset 4.87 % 2.60 % 255,045 3.37 81 -0.0237 % 2,522.9
Deemed-Retractible 4.87 % 3.29 % 134,443 0.94 44 0.0046 % 2,460.8
Performance Highlights
Issue Index Change Notes
CU.PR.E Perpetual-Premium -1.27 % YTW SCENARIO
Maturity Type : Call
Maturity Date : 2021-09-01
Maturity Price : 25.00
Evaluated at bid price : 26.41
Bid-YTW : 4.08 %
CU.PR.C FixedReset -1.26 % YTW SCENARIO
Maturity Type : Call
Maturity Date : 2017-06-01
Maturity Price : 25.00
Evaluated at bid price : 26.55
Bid-YTW : 2.34 %
IAG.PR.F Deemed-Retractible 1.06 % YTW SCENARIO
Maturity Type : Call
Maturity Date : 2015-03-31
Maturity Price : 26.00
Evaluated at bid price : 26.63
Bid-YTW : 4.71 %
Volume Highlights
Issue Index Shares
Traded
Notes
TD.PR.K FixedReset 52,627 RBC crossed 40,000 at 26.30.
YTW SCENARIO
Maturity Type : Call
Maturity Date : 2014-07-31
Maturity Price : 25.00
Evaluated at bid price : 26.30
Bid-YTW : 2.09 %
ENB.PR.N FixedReset 50,133 Scotia crossed 25,000 at 26.18.
YTW SCENARIO
Maturity Type : Call
Maturity Date : 2018-12-01
Maturity Price : 25.00
Evaluated at bid price : 26.09
Bid-YTW : 3.30 %
BNS.PR.Z FixedReset 42,181 RBC crossed 30.000 at 25.30.
YTW SCENARIO
Maturity Type : Hard Maturity
Maturity Date : 2022-01-31
Maturity Price : 25.00
Evaluated at bid price : 25.28
Bid-YTW : 2.86 %
BMO.PR.Q FixedReset 40,220 RBC crossed 30,000 at 25.50.
YTW SCENARIO
Maturity Type : Hard Maturity
Maturity Date : 2022-01-31
Maturity Price : 25.00
Evaluated at bid price : 25.45
Bid-YTW : 2.76 %
TD.PR.G FixedReset 38,891 RBC crossed 25,000 at 26.00.
YTW SCENARIO
Maturity Type : Call
Maturity Date : 2014-04-30
Maturity Price : 25.00
Evaluated at bid price : 26.01
Bid-YTW : 2.20 %
BAM.PR.T FixedReset 34,208 Scotia crossed 24,800 at 25.95.
YTW SCENARIO
Maturity Type : Limit Maturity
Maturity Date : 2043-05-10
Maturity Price : 23.54
Evaluated at bid price : 25.92
Bid-YTW : 3.48 %
There were 21 other index-included issues trading in excess of 10,000 shares.
Wide Spread Highlights
Issue Index Quote Data and Yield Notes
TCA.PR.Y Perpetual-Premium Quote: 51.01 – 51.50
Spot Rate : 0.4900
Average : 0.3486

YTW SCENARIO
Maturity Type : Call
Maturity Date : 2014-03-05
Maturity Price : 50.00
Evaluated at bid price : 51.01
Bid-YTW : 3.24 %

MFC.PR.A OpRet Quote: 25.53 – 25.87
Spot Rate : 0.3400
Average : 0.2163

YTW SCENARIO
Maturity Type : Call
Maturity Date : 2013-06-19
Maturity Price : 25.50
Evaluated at bid price : 25.53
Bid-YTW : -1.07 %

MFC.PR.F FixedReset Quote: 25.10 – 25.48
Spot Rate : 0.3800
Average : 0.2634

YTW SCENARIO
Maturity Type : Hard Maturity
Maturity Date : 2025-01-31
Maturity Price : 25.00
Evaluated at bid price : 25.10
Bid-YTW : 3.04 %

TD.PR.Q Deemed-Retractible Quote: 26.60 – 26.84
Spot Rate : 0.2400
Average : 0.1411

YTW SCENARIO
Maturity Type : Call
Maturity Date : 2013-06-09
Maturity Price : 26.00
Evaluated at bid price : 26.60
Bid-YTW : -19.60 %

BAM.PR.N Perpetual-Discount Quote: 24.50 – 24.75
Spot Rate : 0.2500
Average : 0.1538

YTW SCENARIO
Maturity Type : Limit Maturity
Maturity Date : 2043-05-10
Maturity Price : 24.21
Evaluated at bid price : 24.50
Bid-YTW : 4.89 %

NA.PR.Q FixedReset Quote: 26.55 – 26.80
Spot Rate : 0.2500
Average : 0.1717

YTW SCENARIO
Maturity Type : Call
Maturity Date : 2017-11-15
Maturity Price : 25.00
Evaluated at bid price : 26.55
Bid-YTW : 2.34 %

May 9, 2013

Friday, May 10th, 2013

The Kansas City Fed has published a very interesting evaluation of the Basel Rules on liquidity buffers by Michał Kowalik titled Basel Liquidity Regulation: Was It Improved with the 2013 Revisions?:

However, important shortcomings remain. The new Basel provisions,
like the original ones, still determine liquidity buffer size and composition without taking into account the nature of an individual financial institution’s risk profile, capital, and business activity—all factors that determine the institution’s ability to withstand liquidity shocks. One reason the BCBS opted not to pursue a more flexible, individualized approach is that such an approach would be hard to apply consistently across national borders and the comparability of liquidity positions among financial institutions would not be guaranteed. The inflexible approach, however, raises concerns that some financial institutions may be required to hold buffers larger or smaller than necessary given the nature of their own operations. Moreover, an inflexible approach to determining buffer size and composition can invite “regulatory arbitrage.” Financial institutions may devise strategies that exploit loopholes in the Basel provisions, undermining the integrity of the liquidity buffers.

Shadow banking is making a comeback:

Cerberus Capital Management LP is entering the booming market for single-family homes to rent, planning to lend billions of dollars to investors too big for government programs and too small to get Wall Street funding.

The New York-based firm is seeking to fill a void left by regional lenders that prior to the housing crash were the primary source of loans for landlords buying properties. At least 475 banks have failed since the real-estate collapse, according to the Federal Deposit Insurance Corp., while larger banks have tightened mortgage underwriting standards and are focusing on the biggest investors.

“There’s a real vacuum and Cerberus sees that and they are filling it,” said Jack BeVier, partner at Baltimore-based Dominion Group, which buys and renovates homes. “That niche used to be filled by commercial banks, the local savings and loans or the small regional banks, which would do blanket mortgages across many rental properties, but those players are largely out of the market right now.”

It was a mixed day for the Canadian preferred share market, with PerpetualPremiums off 1bp, FixedResets gaining 3bp and DeemedRetractibles down 5bp. Volatility was average. Volume was average.

HIMIPref™ Preferred Indices
These values reflect the December 2008 revision of the HIMIPref™ Indices

Values are provisional and are finalized monthly
Index Mean
Current
Yield
(at bid)
Median
YTW
Median
Average
Trading
Value
Median
Mod Dur
(YTW)
Issues Day’s Perf. Index Value
Ratchet 0.00 % 0.00 % 0 0.00 0 -0.4585 % 2,589.7
FixedFloater 3.89 % 3.10 % 33,959 18.86 1 0.8247 % 4,228.5
Floater 2.69 % 2.92 % 83,434 19.91 4 -0.4585 % 2,796.2
OpRet 4.80 % -0.75 % 65,213 0.14 5 0.0463 % 2,612.9
SplitShare 4.80 % 4.17 % 111,083 4.07 5 -0.2818 % 2,962.5
Interest-Bearing 0.00 % 0.00 % 0 0.00 0 0.0463 % 2,389.2
Perpetual-Premium 5.21 % 3.02 % 93,587 0.43 31 -0.0087 % 2,382.0
Perpetual-Discount 4.85 % 4.88 % 193,600 15.63 4 -0.1218 % 2,681.8
FixedReset 4.86 % 2.58 % 256,517 3.37 81 0.0266 % 2,523.5
Deemed-Retractible 4.87 % 2.92 % 139,774 0.54 44 -0.0502 % 2,460.7
Performance Highlights
Issue Index Change Notes
IAG.PR.F Deemed-Retractible -1.31 % YTW SCENARIO
Maturity Type : Call
Maturity Date : 2017-03-31
Maturity Price : 25.50
Evaluated at bid price : 26.35
Bid-YTW : 5.05 %
BNA.PR.E SplitShare -1.20 % YTW SCENARIO
Maturity Type : Hard Maturity
Maturity Date : 2017-12-10
Maturity Price : 25.00
Evaluated at bid price : 25.61
Bid-YTW : 4.48 %
BAM.PR.B Floater -1.09 % YTW SCENARIO
Maturity Type : Limit Maturity
Maturity Date : 2043-05-09
Maturity Price : 18.10
Evaluated at bid price : 18.10
Bid-YTW : 2.92 %
TRP.PR.B FixedReset 1.51 % YTW SCENARIO
Maturity Type : Limit Maturity
Maturity Date : 2043-05-09
Maturity Price : 23.50
Evaluated at bid price : 24.87
Bid-YTW : 2.54 %
Volume Highlights
Issue Index Shares
Traded
Notes
MFC.PR.D FixedReset 504,305 Desjardins sold 10,800 to RBC at 26.38, then another 23,700 at 26.37. Desjardins then crossed blocks of 336,000 and 60,000 at 26.36, then 10,000 at 26.39. RBC crossed 25,000 at 26.37.
YTW SCENARIO
Maturity Type : Call
Maturity Date : 2014-06-19
Maturity Price : 25.00
Evaluated at bid price : 26.39
Bid-YTW : 2.37 %
FTS.PR.F Perpetual-Premium 50,685 National crossed 50,000 at 25.95.
YTW SCENARIO
Maturity Type : Call
Maturity Date : 2014-12-01
Maturity Price : 25.25
Evaluated at bid price : 25.84
Bid-YTW : 3.92 %
MFC.PR.C Deemed-Retractible 49,528 RBC crossed 23,300 at 24.85.
YTW SCENARIO
Maturity Type : Hard Maturity
Maturity Date : 2025-01-31
Maturity Price : 25.00
Evaluated at bid price : 24.85
Bid-YTW : 4.66 %
FTS.PR.J Perpetual-Premium 42,300 National crossed 40,000 at 26.00.
YTW SCENARIO
Maturity Type : Call
Maturity Date : 2021-12-01
Maturity Price : 25.00
Evaluated at bid price : 25.86
Bid-YTW : 4.41 %
TD.PR.E FixedReset 36,675 RBC crossed blocks of 13,700 and 15,000, both at 26.00.
YTW SCENARIO
Maturity Type : Call
Maturity Date : 2014-04-30
Maturity Price : 25.00
Evaluated at bid price : 25.99
Bid-YTW : 2.28 %
RY.PR.I FixedReset 36,014 Scotia crossed 29,200 at 25.55.
YTW SCENARIO
Maturity Type : Call
Maturity Date : 2014-02-24
Maturity Price : 25.00
Evaluated at bid price : 25.53
Bid-YTW : 2.03 %
There were 31 other index-included issues trading in excess of 10,000 shares.
Wide Spread Highlights
Issue Index Quote Data and Yield Notes
ENB.PR.D FixedReset Quote: 26.04 – 27.04
Spot Rate : 1.0000
Average : 0.6141

YTW SCENARIO
Maturity Type : Call
Maturity Date : 2018-03-01
Maturity Price : 25.00
Evaluated at bid price : 26.04
Bid-YTW : 3.24 %

IAG.PR.F Deemed-Retractible Quote: 26.35 – 27.00
Spot Rate : 0.6500
Average : 0.4135

YTW SCENARIO
Maturity Type : Call
Maturity Date : 2017-03-31
Maturity Price : 25.50
Evaluated at bid price : 26.35
Bid-YTW : 5.05 %

FTS.PR.G FixedReset Quote: 25.28 – 25.57
Spot Rate : 0.2900
Average : 0.2100

YTW SCENARIO
Maturity Type : Limit Maturity
Maturity Date : 2043-05-09
Maturity Price : 24.83
Evaluated at bid price : 25.28
Bid-YTW : 3.34 %

TCA.PR.X Perpetual-Premium Quote: 50.63 – 51.07
Spot Rate : 0.4400
Average : 0.3631

YTW SCENARIO
Maturity Type : Call
Maturity Date : 2013-10-15
Maturity Price : 50.00
Evaluated at bid price : 50.63
Bid-YTW : 3.02 %

W.PR.J Perpetual-Premium Quote: 25.50 – 25.77
Spot Rate : 0.2700
Average : 0.1933

YTW SCENARIO
Maturity Type : Call
Maturity Date : 2013-06-08
Maturity Price : 25.00
Evaluated at bid price : 25.50
Bid-YTW : -13.59 %

BNA.PR.E SplitShare Quote: 25.61 – 25.80
Spot Rate : 0.1900
Average : 0.1159

YTW SCENARIO
Maturity Type : Hard Maturity
Maturity Date : 2017-12-10
Maturity Price : 25.00
Evaluated at bid price : 25.61
Bid-YTW : 4.48 %

May 8, 2013

Thursday, May 9th, 2013

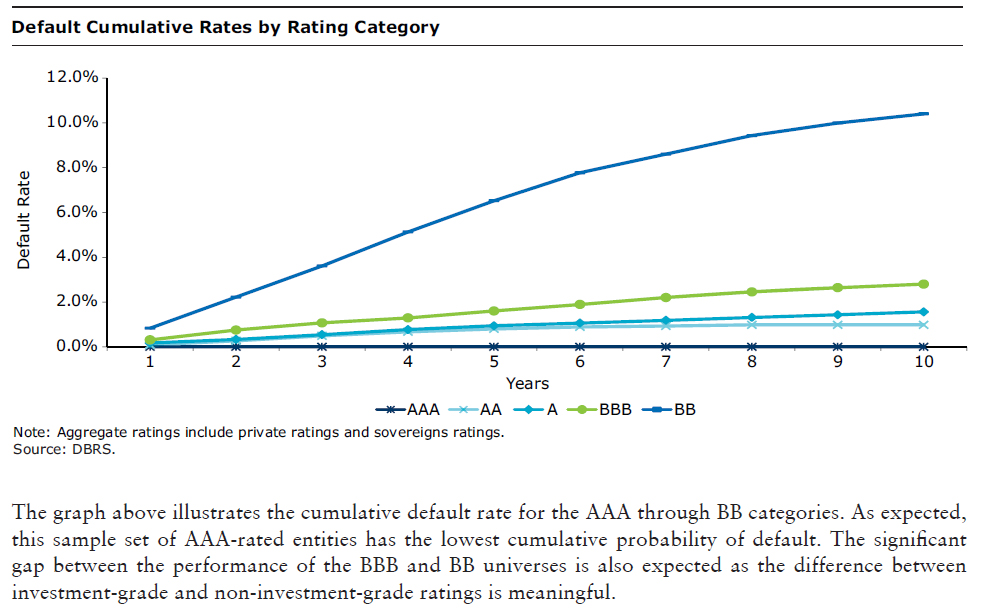
DBRS has published its 2012 DBRS Corporate Rating Transition and Default Study:


Click for Big

The Boston Fed has released a paper by Oz Shy titled Window Shopping:

The terms “window shopping” and “showrooming” refer to the activity in which potential buyers visit a brick-and-mortar store to examine a product but end up either not buying it or buying the product from an online retailer. This paper analyzes potential buyers who differ in their preference for after-sale service that is not offered by online retailers. For some buyers, making a trip to the brick-and-mortar store is costly; however, going to the store to examine the product has the advantage of mitigating the uncertainty as to whether the product will suit the buyer’s needs. The model shows that the number of buyers engaged in window shopping behavior exceeds the optimal number, both under duopoly and under joint ownership of the online and walk-in store outlets.

Second, the retail industry environment is evolving in many ways. Fearing a loss of customers to online retailers, many large brick-and-mortar retailers now offer online shopping with either home delivery or store pickups. In addition, many online retailers offer easy returns, some offer “free returns,” and some provide links to webpages where customers can find aftermarket service providers in their area. In addition, online sellers keep introducing more and more products, such as eyeglasses, that until recently were available only in walk-in stores. This is accomplished by offering significant price reductions that are possible because online merchants learn how to bypass the middlemen and shorten the supply chain.

I believe that at some point it will become attractive to the manufacturers to pay retailers explicitly for showrooming their product and cut out the on-line retailer middleman.

I had an interesting conversation with my furnace repairman (*sigh*) a few weeks ago. He complained that the distributors were cutting back on staff, staff experience and staff training, so it wasn’t enough for him any more to say he needed a pilot light detector for a Heat-Yer-House Model 71; he had to say he needed part number HYH-71-ABC45D. They would then supply him with the part.

I suggested that if the distributors were not providing all that great service, it would be to the manufacturers’ advantage to sell the parts directly (you could get really fancy with a website for this. Cutaway photos or diagrams of the appliance, for instance – click on the area, pop up an order form with all the information). He responded that that’s already starting to happen.

We live in a world of change!

Scandal in LatteLand! Timmy’s is under Review-Negative:

DBRS has today placed the A (low) ratings of Tim Hortons Inc. (THI or the Company) Under Review with Negative Implications following the Company’s announcement that it is actively evaluating possible changes to its capital structure (i.e., optimal debt level within the context of maintaining an investment grade credit rating).

The Under Review with Negative Implications status reflects DBRS’s concerns that an increase in financial leverage – potentially triggered by the Company’s review of its optimal capital structure, including consideration of potential share repurchase activity and other uses of leverage – could result in a credit risk profile that would no longer be consistent with the A (low) rating category.

The priorities of the world have become so skewed that there is now handwringing that some scholarships are based on merit:

To increase their standing on college rankings, more private colleges are giving “merit aid” to top students, who are often affluent, while charging unaffordable prices to the needy, according to the report. The percentage of students receiving merit aid jumped to 44 percent in 2007-2008 from 24 percent in 1995-1996, the report found. To a lesser extent, public universities are using some of the same practices,[report writer Stephen] Burd said.

Colleges use merit aid for talented middle- and upper-income students because it is less costly than pursuing similar prospects from poor families, said Catharine Hill, Vassar’s president. Enrolling low-income students costs schools money because they are giving up a spot for those who can pay full freight — or close to it.

If American universities want to fix the problem they should address the problem:

University spending is driven by the need to compete in university league tables that tend to rank almost everything about a university except the (hard-to-measure) quality of the graduates it produces. Roger Geiger of Pennsylvania State University and Donald Heller of Michigan State University say that since 1990, in both public and private colleges, expenditures on instruction have risen more slowly than in any other category of spending, even as student numbers have risen. Universities are, however, spending plenty more on administration and support services (see chart 2).

Another problem is tuition discounting:

The practice of tuition discounting, in which a college awards financial aid from its own funds, is responsible for 27% to 32% of the increase in college tuition. On an absolute scale, tuition discounting accounts for 2 to 3 percentage points of the college tuition inflation rate. Tuition charges would be 22% to 25% lower without tuition discounting, but lower income families would be unable to afford to pay for a college education.

I think the basic problem is that there are simply too many people going to university.

It was a modestly positive day for the Canadian preferred share market, with PerpetualPremiums and DeemedRetractibles both up 5bp and FixedResets gaining 2bp. Volatility was minimal. Volume continued to be high – but not as ridiculously high as yesterday.

PerpetualDiscounts now yield 4.88%, equivalent to 6.34% interest at the standard equivalency factor of 1.3x. Long Corporates now yield about 4.1%, so the pre-tax interest-equivalent spread (in this context, the “Seniority Spread”) is now about 225bp, a slight – and perhaps spurious – narrowing from the 230bp reported May 1.

HIMIPref™ Preferred Indices
These values reflect the December 2008 revision of the HIMIPref™ Indices

Values are provisional and are finalized monthly
Index Mean
Current
Yield
(at bid)
Median
YTW
Median
Average
Trading
Value
Median
Mod Dur
(YTW)
Issues Day’s Perf. Index Value
Ratchet 0.00 % 0.00 % 0 0.00 0 -0.4312 % 2,601.7
FixedFloater 3.92 % 3.14 % 33,988 18.80 1 -0.2058 % 4,193.9
Floater 2.67 % 2.89 % 84,137 19.99 4 -0.4312 % 2,809.1
OpRet 4.80 % 0.14 % 65,019 0.14 5 -0.0772 % 2,611.6
SplitShare 4.78 % 4.12 % 108,989 4.08 5 0.2511 % 2,970.9
Interest-Bearing 0.00 % 0.00 % 0 0.00 0 -0.0772 % 2,388.1
Perpetual-Premium 5.21 % 2.27 % 93,245 0.43 31 0.0456 % 2,382.3
Perpetual-Discount 4.85 % 4.88 % 195,229 15.64 4 -0.1722 % 2,685.1
FixedReset 4.86 % 2.66 % 255,937 3.33 81 0.0165 % 2,522.8
Deemed-Retractible 4.87 % 3.21 % 139,604 0.47 44 0.0555 % 2,461.9
Performance Highlights
Issue Index Change Notes
TRP.PR.B FixedReset -1.45 % YTW SCENARIO
Maturity Type : Limit Maturity
Maturity Date : 2043-05-08
Maturity Price : 23.35
Evaluated at bid price : 24.50
Bid-YTW : 2.60 %
FTS.PR.H FixedReset 1.85 % YTW SCENARIO
Maturity Type : Limit Maturity
Maturity Date : 2043-05-08
Maturity Price : 23.83
Evaluated at bid price : 25.82
Bid-YTW : 2.58 %
Volume Highlights
Issue Index Shares
Traded
Notes
IAG.PR.G FixedReset 57,990 National crossed 50,000 at 26.55.
YTW SCENARIO
Maturity Type : Call
Maturity Date : 2017-06-30
Maturity Price : 25.00
Evaluated at bid price : 26.44
Bid-YTW : 2.95 %
BAM.PF.C Perpetual-Discount 56,977 Scotia crossed 49,500 at 24.90.
YTW SCENARIO
Maturity Type : Limit Maturity
Maturity Date : 2043-05-08
Maturity Price : 24.50
Evaluated at bid price : 24.89
Bid-YTW : 4.91 %
GWO.PR.G Deemed-Retractible 50,836 National crossed 40,600 at 25.70.
YTW SCENARIO
Maturity Type : Call
Maturity Date : 2013-06-07
Maturity Price : 25.25
Evaluated at bid price : 25.75
Bid-YTW : -11.73 %
W.PR.H Perpetual-Premium 50,050 Nesbitt crossed 40,000 at 25.68.
YTW SCENARIO
Maturity Type : Call
Maturity Date : 2013-06-07
Maturity Price : 25.00
Evaluated at bid price : 25.60
Bid-YTW : -18.30 %
PWF.PR.H Perpetual-Premium 48,415 Nesbitt crossed 12,600 at 25.60.
YTW SCENARIO
Maturity Type : Call
Maturity Date : 2013-06-07
Maturity Price : 25.00
Evaluated at bid price : 25.65
Bid-YTW : -22.61 %
GWO.PR.H Deemed-Retractible 46,108 National crossed 41,100 at 25.50.
YTW SCENARIO
Maturity Type : Call
Maturity Date : 2013-09-30
Maturity Price : 25.25
Evaluated at bid price : 25.48
Bid-YTW : 3.78 %
There were 44 other index-included issues trading in excess of 10,000 shares.
Wide Spread Highlights
Issue Index Quote Data and Yield Notes
MFC.PR.J FixedReset Quote: 26.37 – 26.80
Spot Rate : 0.4300
Average : 0.2519

YTW SCENARIO
Maturity Type : Call
Maturity Date : 2018-03-19
Maturity Price : 25.00
Evaluated at bid price : 26.37
Bid-YTW : 2.92 %

TRP.PR.B FixedReset Quote: 24.50 – 24.88
Spot Rate : 0.3800
Average : 0.2509

YTW SCENARIO
Maturity Type : Limit Maturity
Maturity Date : 2043-05-08
Maturity Price : 23.35
Evaluated at bid price : 24.50
Bid-YTW : 2.60 %

BMO.PR.K Deemed-Retractible Quote: 26.16 – 26.48
Spot Rate : 0.3200
Average : 0.2076

YTW SCENARIO
Maturity Type : Call
Maturity Date : 2013-06-07
Maturity Price : 26.00
Evaluated at bid price : 26.16
Bid-YTW : -5.21 %

GWO.PR.N FixedReset Quote: 24.49 – 24.90
Spot Rate : 0.4100
Average : 0.2987

YTW SCENARIO
Maturity Type : Hard Maturity
Maturity Date : 2025-01-31
Maturity Price : 25.00
Evaluated at bid price : 24.49
Bid-YTW : 3.06 %

MFC.PR.H FixedReset Quote: 26.76 – 27.13
Spot Rate : 0.3700
Average : 0.2657

YTW SCENARIO
Maturity Type : Call
Maturity Date : 2017-03-19
Maturity Price : 25.00
Evaluated at bid price : 26.76
Bid-YTW : 2.85 %

PWF.PR.P FixedReset Quote: 26.02 – 26.35
Spot Rate : 0.3300
Average : 0.2373

YTW SCENARIO
Maturity Type : Limit Maturity
Maturity Date : 2043-05-08
Maturity Price : 23.74
Evaluated at bid price : 26.02
Bid-YTW : 2.71 %

FTS.PR.C To Be Redeemed

Wednesday, May 8th, 2013

Fortis Inc. has announced:

Redemption of Series “C” First Preference Shares

Fortis will redeem all of the issued and outstanding First Preference Shares, Series “C” of the Corporation in accordance with their terms on July 10, 2013. The redemption price will be $25.1456 in cash per share, being equal to $25.00 plus $0.1456, representing the amount of accrued and unpaid dividends per share for the period from and including June 1, 2013 to but excluding July 10, 2013. A notice of redemption providing additional details will be mailed to the registered holders of First Preference Shares, Series C on or about May 15, 2013. As previously announced, the regular quarterly preferential cash dividend of $0.340625 per share will be paid on June 1, 2013 to the holders of First Preference Shares, Series “C” of record as of the close of business on May 17, 2013.

FTS.PR.C was last mentioned on PrefBlog when it was added to TXPR effective 2013-4-22.

May 7, 2013

Tuesday, May 7th, 2013

I am pleased to announce that the regulatory response to the Credit Crunch has achieved its goal:

Job vacancies at London’s financial- services companies climbed 19 percent last month as tougher regulation of banks spurred hiring in compliance and anti-money laundering, recruitment firm Astbury Marsden said.

Firms in the City, the world’s number one financial center, according to consulting firm Z/Yen Group Ltd., have been hiring to improve compliance and reduce risk amid regulatory scrutiny following scandals including interest-rate rigging and money laundering. Banks, insurers and asset managers may add 4,000 jobs in the first half of the year, ending three consecutive quarters of cuts, the Confederation of British Industry said last month.

“Regulation is still driving recruitment in the City, as banks focus on trimming their businesses back to their most profitable areas in order to manage new capital requirements,” said Astbury Marsden in the statement.

European corporate and investment banks face a reduction in profitability from increased taxation, compensation restrictions and regulatory burdens, according to a report by Oliver Wyman and Morgan Stanley last month.

A rather audacious fraud has been uncovered:

The Securities and Exchange Commission today charged four individuals with ties to a New York City brokerage firm in a scheme involving millions of dollars in illicit bribes paid to a high-ranking Venezuelan finance official to secure the bond trading business of a state-owned Venezuelan bank.

According to the SEC’s complaint filed in federal court in Manhattan, the global markets group at broker-dealer Direct Access Partners (DAP) executed fixed income trades for customers in foreign sovereign debt. DAP Global generated more than $66 million in revenue for DAP from transaction fees – in the form of markups and markdowns – on riskless principal trade executions in Venezuelan sovereign or state-sponsored bonds for Banco de Desarrollo Económico y Social de Venezuela (BANDES). A portion of this revenue was illicitly paid to BANDES Vice President of Finance, María de los Ángeles González de Hernandez, who authorized the fraudulent trades.

There’s a few more words on Lapdog Carney’s legacy, this time from Philip Cross, Research Coordinator at the Macdonald-Laurier Institute and former Chief Economic Analyst at Statistics Canada:

The Bank of Canada proudly defends its independence. However, this independence places responsibilities on both the government and the Bank. The government is obliged to allow the Bank to set monetary policy, notably interest rates, without political interference. In return, the Bank is obliged to act in a non-partisan way. It is the latter that was tarnished during Carney’s tenure, not the former.

There are several examples of Carney over-stepping the constraints of non-partisanship. Most obvious was his dalliance with Liberal powerbrokers over their leadership.

I wasn’t really disturbed by the Grit thing. It was clear that that was all about Carney the man, not Carney the Bank Boss. My complaints about Carney relate to his eagerness to be a stalking horse for political pronouncements, e.g. “Ban the Bond” and the idiotic Central Clearing for Derivatives. But it worked! He got his reward! Firstly as boss of the Financial Stability Board and next as Monetary Puppet for another micromanaging western government.

It was a mixed day for the Canadian preferred share market, with PerpetualPremiums down 16bp, FixedResets gaining 4bp and DeemedRetractibles off 1bp. Volatility was low. Volume was ENORMOUS! Absolutely ENORMOUS! I don’t know what happened.

HIMIPref™ Preferred Indices
These values reflect the December 2008 revision of the HIMIPref™ Indices

Values are provisional and are finalized monthly
Index Mean
Current
Yield
(at bid)
Median
YTW
Median
Average
Trading
Value
Median
Mod Dur
(YTW)
Issues Day’s Perf. Index Value
Ratchet 0.00 % 0.00 % 0 0.00 0 -0.1772 % 2,612.9
FixedFloater 3.91 % 3.13 % 33,598 18.82 1 0.5795 % 4,202.6
Floater 2.66 % 2.87 % 83,309 20.04 4 -0.1772 % 2,821.3
OpRet 4.79 % -0.04 % 65,312 0.15 5 0.0309 % 2,613.7
SplitShare 4.80 % 4.11 % 107,938 4.08 5 -0.0706 % 2,963.5
Interest-Bearing 0.00 % 0.00 % 0 0.00 0 0.0309 % 2,390.0
Perpetual-Premium 5.20 % 2.21 % 93,368 0.44 31 -0.1645 % 2,381.2
Perpetual-Discount 4.84 % 4.86 % 190,781 15.68 4 0.0405 % 2,689.7
FixedReset 4.86 % 2.70 % 258,532 3.37 81 0.0386 % 2,522.4
Deemed-Retractible 4.87 % 3.30 % 137,274 0.79 44 -0.0141 % 2,460.5
Performance Highlights
Issue Index Change Notes
VNR.PR.A FixedReset -1.08 % YTW SCENARIO
Maturity Type : Call
Maturity Date : 2017-10-15
Maturity Price : 25.00
Evaluated at bid price : 26.65
Bid-YTW : 2.84 %
PWF.PR.P FixedReset 1.32 % YTW SCENARIO
Maturity Type : Limit Maturity
Maturity Date : 2043-05-07
Maturity Price : 23.76
Evaluated at bid price : 26.09
Bid-YTW : 2.70 %
Volume Highlights
Issue Index Shares
Traded
Notes
RY.PR.R FixedReset 198,264 Scotia crossed 25,000 at 25.73. TD crossed three blocks, of 32,100 shares, 51,000 and 17,100 shares, all at the same price. National crossed 50,100 at the same price again.
YTW SCENARIO
Maturity Type : Call
Maturity Date : 2014-02-24
Maturity Price : 25.00
Evaluated at bid price : 25.73
Bid-YTW : 2.18 %
FTS.PR.E OpRet 128,368 Nesbitt crossed blocks of 27,300 and 25,000, both at 26.40. RBC sold 20,600 to anonymous at 26.42, then crossed 45,400 at 26.40.
YTW SCENARIO
Maturity Type : Call
Maturity Date : 2013-07-01
Maturity Price : 25.75
Evaluated at bid price : 26.41
Bid-YTW : -6.33 %
ENB.PR.F FixedReset 108,908 Scotia crossed 39,100 at 25.95. Desjardins crossed 50,000 at 25.98.
YTW SCENARIO
Maturity Type : Call
Maturity Date : 2018-06-01
Maturity Price : 25.00
Evaluated at bid price : 25.98
Bid-YTW : 3.33 %
MFC.PR.D FixedReset 103,757 RBC crossed blocks of 26,800 and 25,000, both at 26.35. Desjardins crossed 25,000 at the same price.
YTW SCENARIO
Maturity Type : Call
Maturity Date : 2014-06-19
Maturity Price : 25.00
Evaluated at bid price : 26.40
Bid-YTW : 2.32 %
RY.PR.X FixedReset 91,128 RBC crossed 30,300 at 26.20, then another 37,000 at 26.21.
YTW SCENARIO
Maturity Type : Call
Maturity Date : 2014-08-24
Maturity Price : 25.00
Evaluated at bid price : 26.23
Bid-YTW : 2.18 %
TRP.PR.A FixedReset 90,166 Scotia crossed 40,000 at 25.50. National crossed 40,000 at the same price.
YTW SCENARIO
Maturity Type : Limit Maturity
Maturity Date : 2043-05-07
Maturity Price : 23.85
Evaluated at bid price : 25.49
Bid-YTW : 3.07 %
There were 90 other index-included issues trading in excess of 10,000 shares.
Wide Spread Highlights
Issue Index Quote Data and Yield Notes
MFC.PR.G FixedReset Quote: 26.40 – 26.77
Spot Rate : 0.3700
Average : 0.2427

YTW SCENARIO
Maturity Type : Call
Maturity Date : 2016-12-19
Maturity Price : 25.00
Evaluated at bid price : 26.40
Bid-YTW : 2.94 %

VNR.PR.A FixedReset Quote: 26.65 – 26.95
Spot Rate : 0.3000
Average : 0.2035

YTW SCENARIO
Maturity Type : Call
Maturity Date : 2017-10-15
Maturity Price : 25.00
Evaluated at bid price : 26.65
Bid-YTW : 2.84 %

BNS.PR.Y FixedReset Quote: 24.76 – 24.97
Spot Rate : 0.2100
Average : 0.1315

YTW SCENARIO
Maturity Type : Hard Maturity
Maturity Date : 2022-01-31
Maturity Price : 25.00
Evaluated at bid price : 24.76
Bid-YTW : 2.70 %

FTS.PR.H FixedReset Quote: 25.35 – 25.65
Spot Rate : 0.3000
Average : 0.2262

YTW SCENARIO
Maturity Type : Limit Maturity
Maturity Date : 2043-05-07
Maturity Price : 23.69
Evaluated at bid price : 25.35
Bid-YTW : 2.66 %

ENB.PR.A Perpetual-Premium Quote: 26.16 – 26.34
Spot Rate : 0.1800
Average : 0.1094

YTW SCENARIO
Maturity Type : Call
Maturity Date : 2013-06-06
Maturity Price : 25.00
Evaluated at bid price : 26.16
Bid-YTW : -34.42 %

IAG.PR.A Deemed-Retractible Quote: 24.66 – 24.89
Spot Rate : 0.2300
Average : 0.1704

YTW SCENARIO
Maturity Type : Hard Maturity
Maturity Date : 2025-01-31
Maturity Price : 25.00
Evaluated at bid price : 24.66
Bid-YTW : 4.83 %

May 6, 2013

Monday, May 6th, 2013

PrefBlog’s “There’s One Born Every Minute” Department has uncovered some exciting news:

In about a week, a structured product offering, the Manulife Floating Rate Senior Loan Fund, will close.

On Manulife’s deal, holders are slated to receive 6.75%.

It will try and achieve that 6.75% yield by investing in a broadly diversified portfolio consisting mostly of senior floating rate loans. Those loans will be at a spread above LIBOR. The sub-advisor is also allowed to invest up to 20% of the total in short duration debt securities.

Given that the talk is that retail investors have committed almost $150-million to the offering, what does the success of Manulife’s deal mean?

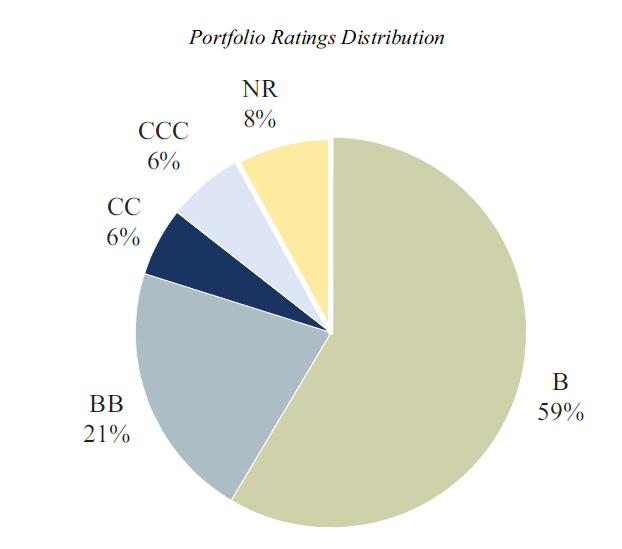
From the prospectus – to which I am unable to link, given CDS’ abuse of its regulatory monopoly – we learn how they’re going to make that “6.75%”:


Click for Big

The following helpful table is also provided:

Characteristics Indicative Portfolio
Average Credit Quality B+/B
Average Maturity (years) 4.87
Average Yield to Maturity 6.50%
Option Adjusted Duration (years) 0.74

Regretably, the term “Option Adjusted Duration” is not defined in the prospectus; I presume that the fact that this is much lower than the Average Maturity indicates at least qualitatively that a huge proportion of the portfolio is trading at or above its current call price. It is equally regrettable that they do not report the Option Adjusted Yield for the Indicative Portfolio. What a pity. I wonder why not.

So let’s see … they’re plan to pay 6.75% p.a., after paying new issue commission a little in excess of 5% and issue expenses of somewhere between 0.3% and 1.5% (depending on how much gets sold); and after paying Management & Service Fees totaling 1.5% p.a.; and after paying expenses, estimated at between 8bp and 100bp p.a. (depending on how much gets sold). And they’re planning to do this with a low-quality portfolio of floating rate issues which could substantially called away in the next year or so, and is now yielding 6.50%.

Nice work if you can get it.

It was another good day for the Canadian preferred share market, with FixedResets continuing their recent pattern of being decoupled from the returns of other preferred share classes: PerpetualPremiums and DeemedRetractibles were up 5bp, while FixedResets won 27bp. Volatility was low. Volume was on the low side of average, but dominated by FixedResets.

HIMIPref™ Preferred Indices
These values reflect the December 2008 revision of the HIMIPref™ Indices

Values are provisional and are finalized monthly
Index Mean
Current
Yield
(at bid)
Median
YTW
Median
Average
Trading
Value
Median
Mod Dur
(YTW)
Issues Day’s Perf. Index Value
Ratchet 0.00 % 0.00 % 0 0.00 0 -0.1138 % 2,617.6
FixedFloater 3.93 % 3.16 % 33,366 18.78 1 0.2490 % 4,178.4
Floater 2.66 % 2.87 % 82,301 20.05 4 -0.1138 % 2,826.3
OpRet 4.80 % -0.38 % 60,481 0.15 5 0.0927 % 2,612.9
SplitShare 4.79 % 4.13 % 108,184 4.08 5 0.0235 % 2,965.6
Interest-Bearing 0.00 % 0.00 % 0 0.00 0 0.0927 % 2,389.2
Perpetual-Premium 5.19 % 2.19 % 86,486 0.44 31 0.0530 % 2,385.1
Perpetual-Discount 4.84 % 4.86 % 179,679 15.66 4 -0.0911 % 2,688.6
FixedReset 4.86 % 2.64 % 242,012 3.53 81 0.2653 % 2,521.4
Deemed-Retractible 4.87 % 3.34 % 134,911 0.64 44 0.0494 % 2,460.9
Performance Highlights
Issue Index Change Notes
MFC.PR.J FixedReset 1.18 % YTW SCENARIO
Maturity Type : Call
Maturity Date : 2018-03-19
Maturity Price : 25.00
Evaluated at bid price : 26.55
Bid-YTW : 2.76 %
CIU.PR.C FixedReset 1.68 % YTW SCENARIO
Maturity Type : Limit Maturity
Maturity Date : 2043-05-06
Maturity Price : 23.52
Evaluated at bid price : 25.45
Bid-YTW : 2.55 %
Volume Highlights
Issue Index Shares
Traded
Notes
MFC.PR.H FixedReset 51,080 Scotia crossed blocks of 17,300 and 25,000, both at 26.70.
YTW SCENARIO
Maturity Type : Call
Maturity Date : 2017-03-19
Maturity Price : 25.00
Evaluated at bid price : 26.76
Bid-YTW : 2.84 %
BNS.PR.T FixedReset 42,544 RBC crossed 30,100 at 25.90.
YTW SCENARIO
Maturity Type : Call
Maturity Date : 2014-04-25
Maturity Price : 25.00
Evaluated at bid price : 25.91
Bid-YTW : 2.53 %
BNS.PR.N Deemed-Retractible 40,499 RBC crossed 35,400 at 26.25.
YTW SCENARIO
Maturity Type : Call
Maturity Date : 2013-06-05
Maturity Price : 26.00
Evaluated at bid price : 26.25
Bid-YTW : -5.53 %
IFC.PR.C FixedReset 36,970 TD crossed 22,600 at 26.75.
YTW SCENARIO
Maturity Type : Call
Maturity Date : 2016-09-30
Maturity Price : 25.00
Evaluated at bid price : 26.76
Bid-YTW : 2.18 %
ENB.PR.F FixedReset 35,850 YTW SCENARIO
Maturity Type : Call
Maturity Date : 2018-06-01
Maturity Price : 25.00
Evaluated at bid price : 25.94
Bid-YTW : 3.36 %
ENB.PR.D FixedReset 34,594 TD bought 10,000 from RBC at 26.00.
YTW SCENARIO
Maturity Type : Call
Maturity Date : 2018-03-01
Maturity Price : 25.00
Evaluated at bid price : 26.01
Bid-YTW : 3.26 %
There were 29 other index-included issues trading in excess of 10,000 shares.
Wide Spread Highlights
Issue Index Quote Data and Yield Notes
ENB.PR.D FixedReset Quote: 26.01 – 27.01
Spot Rate : 1.0000
Average : 0.5581

YTW SCENARIO
Maturity Type : Call
Maturity Date : 2018-03-01
Maturity Price : 25.00
Evaluated at bid price : 26.01
Bid-YTW : 3.26 %

BAM.PR.G FixedFloater Quote: 24.16 – 24.97
Spot Rate : 0.8100
Average : 0.5795

YTW SCENARIO
Maturity Type : Limit Maturity
Maturity Date : 2043-05-06
Maturity Price : 23.02
Evaluated at bid price : 24.16
Bid-YTW : 3.16 %

PWF.PR.M FixedReset Quote: 25.53 – 26.00
Spot Rate : 0.4700
Average : 0.2972

YTW SCENARIO
Maturity Type : Call
Maturity Date : 2014-01-31
Maturity Price : 25.00
Evaluated at bid price : 25.53
Bid-YTW : 3.21 %

RY.PR.I FixedReset Quote: 25.45 – 25.72
Spot Rate : 0.2700
Average : 0.1840

YTW SCENARIO
Maturity Type : Call
Maturity Date : 2014-02-24
Maturity Price : 25.00
Evaluated at bid price : 25.45
Bid-YTW : 2.41 %

MFC.PR.E FixedReset Quote: 26.28 – 26.52
Spot Rate : 0.2400
Average : 0.1607

YTW SCENARIO
Maturity Type : Call
Maturity Date : 2014-09-19
Maturity Price : 25.00
Evaluated at bid price : 26.28
Bid-YTW : 2.34 %

GWO.PR.G Deemed-Retractible Quote: 25.66 – 25.87
Spot Rate : 0.2100
Average : 0.1328

YTW SCENARIO
Maturity Type : Call
Maturity Date : 2013-06-05
Maturity Price : 25.25
Evaluated at bid price : 25.66
Bid-YTW : -8.00 %

MAPF Performance: April 2013

Monday, May 6th, 2013

The fund underperformed in April, due largely to the under-weighting in bank DeemedRetractible issues. Additionally, PerpetualPremiums, which are also under-weighted by the fund, did quite well despite the negative yield-to-worst on many of the issues.

Bank DeemedRetractible
Performance
April 2013
Issuer Arithmetic
Mean
Performance
BMO +0.09%
BNS -0.12%
HSB +0.39%
NA +0.44%
RY +0.18%
TD +0.53%

These figures compare with the average return for the DeemedRetractible index of -0.02%. Regretably, performance calculation for issues having undergone a change of terms during the month – i.e., the insurers and insurance holding companies – is not enabled by the software.

ZPR, is a relatively new ETF comprised of FixedResets and Floating Rate issues, with a very high proportion of junk issues, which returned -1.21% for the month, and +0.94% over the past three months (according to my calculations from the fund’s NAV data and distribution data; our regulators are hard at work protecting you from performance data since the fund has been extant for less than a year), versus gains for the TXPL index of +% and +%, respectively. The fund has been able to attract assets of about $739.9-million in five and a half months, $221-million of this in April alone, and I feel that has had a great effect on the prices of its targetted preferreds and their close relations.

Weak performance amongst TXPL’s favoured issues in April resulted in a total return of -1.15% for the month, bringing the three-month return to +1.09%. TXPR had returns over these periods of -0.62% and +1.08%, respectively; it is interesting to note that the latter figures (for the three months ending April 30) are almost identical.

Investment-grade FixedResets as a group came back to earth in April, returning -0.52% and increasing their median YTW to 2.77%. PerpetualPremiums did better with +0.30% over the month while DeemedRetractibles were almost flat at -0.02%.

Malachite Aggressive Preferred Fund’s Net Asset Value per Unit as of the close April 30, 2013, was 10.8468.

Returns to April 30, 2013
Period MAPF BMO-CM “50” Index TXPR
Total Return
CPD – according to Blackrock
One Month -0.52% -0.34% -0.62% -0.64%
Three Months +0.77% +1.08% +1.08% +0.99%
One Year +9.10% +4.65% +5.28% +4.61%
Two Years (annualized) +6.50% +5.61% +5.28% N/A
Three Years (annualized) +11.96% +8.90% +8.07% +7.37%
Four Years (annualized) +15.83% +10.75% +8.97% N/A
Five Years (annualized) +16.48% +6.61% +5.38% +4.72%
Six Years (annualized) +13.63% +4.47%    
Seven Years (annualized) +12.61% +4.43%    
Eight Years (annualized) +11.81% +4.31%    
Nine Years (annualized) +11.58% +4.47%    
Ten Years (annualized) +12.88% +4.65%    
Eleven Years (annualized) +11.83% +4.77%    
Twelve Years (annualized) +12.19% +4.44%    
MAPF returns assume reinvestment of distributions, and are shown after expenses but before fees.
CPD Returns are for the NAV and are after all fees and expenses.
* CPD does not directly report its two- or four-year returns.
Figures for Omega Preferred Equity (which are after all fees and expenses) for 1-, 3- and 12-months are -0.09%, +1.20% and +4.72%, respectively, according to Morningstar after all fees & expenses. Three year performance is +7.88%; five year is +5.58%
Figures for Jov Leon Frazer Preferred Equity Fund Class I Units (which are after all fees and expenses) for 1-, 3- and 12-months are -0.10%, +1.03% and +2.89% respectively, according to Morningstar. Three Year performance is +5.13%
Figures for Manulife Preferred Income Fund (formerly AIC Preferred Income Fund) (which are after all fees and expenses) for 1-, 3- and 12-months are -0.48%, +1.25% & +5.25%, respectively. Three Year performance is +6.65%
Figures for Horizons AlphaPro Preferred Share ETF (which are after all fees and expenses) for 1-, 3- and 12-months are -0.15%, +1.22% & +5.32%, respectively.
Figures for Altamira Preferred Equity Fund are -0.39% and +1.10% for one- and three- months, respectively.
The figure for BMO S&P/TSX Laddered Preferred Share Index ETF is -1.15% and +1.09% for one- and three-months. [calculation by JH]

MAPF returns assume reinvestment of dividends, and are shown after expenses but before fees. Past performance is not a guarantee of future performance. You can lose money investing in Malachite Aggressive Preferred Fund or any other fund. For more information, see the fund’s main page. The fund is available either directly from Hymas Investment Management or through a brokerage account at Odlum Brown Limited.

A problem that has bedevilled the market over the past two years has been the OSFI decision not to grandfather Straight Perpetuals as Tier 1 bank capital, and their continued foot-dragging regarding a decision on insurer Straight Perpetuals has segmented the market to the point where trading has become much more difficult. The fund occasionally finds an attractive opportunity to trade between GWO issues, which have a good range of annual coupons (but in which trading is now hampered by the fact that the low-coupon issues are trading near par and are callable at par in the near term), but is “stuck” in the MFC and SLF issues, which have a much narrower range of coupon, while the IAG DeemedRetractibles are quite illiquid. Until the market became so grossly segmented, this was not so much of a problem – but now banks are not available to swap into (because they are so expensive) and non-regulated companies are likewise deprecated (because they are not DeemedRetractibles; they should not participate in the increase in value that will follow the OSFI decision I anticipate and, in addition, are analyzed as perpetuals). The fund’s portfolio is, in effect ‘locked in’ to the MFC & SLF issues due to projected gains from a future OSFI decision, to the detriment of trading gains.

SLF DeemedRetractibles may be compared with PWF and GWO:
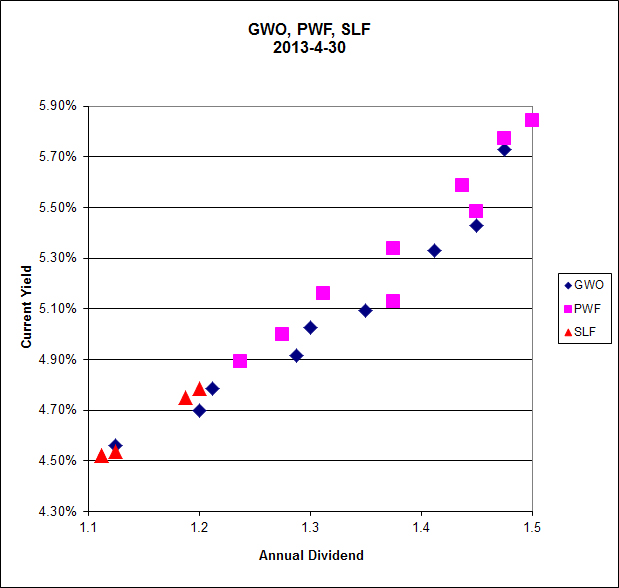

Click for Big

It is quite apparent that that the market continues to treat regulated insurance issues (SLF, GWO) no differently from unregulated issues (PWF) – despite the fact that the PWF issues are much more subject to unfavourable calls in the near term and should, logically, be deprecated on those grounds alone without any fancy-pants arguments about imposition of the NVCC rule!

In fact, one can make an argument that the SLF issues are doing better than they should be now, as they were downgraded by DBRS earlier this year, which no longer considers them credit-equivalent to GWO and PWF.

Those of you who have been paying attention will remember that in a “normal” market (which we have not seen in well over a year) the slope of this line is related to the implied volatility of yields in Black-Scholes theory, as discussed in the January, 2010, edition of PrefLetter. The relationship is still far too large to be explained by Implied Volatility – the numbers still indicate an overwhelming degree of directionality in the market’s price expectations.

Sometimes everything works … sometimes it’s 50-50 … sometimes nothing works. The fund seeks to earn incremental return by selling liquidity (that is, taking the other side of trades that other market participants are strongly motivated to execute), which can also be referred to as ‘trading noise’ – although for quite some time, noise trading has taken a distant second place to the sectoral play on insurance DeemedRetractibles. There were a lot of strongly motivated market participants during the Panic of 2007, generating a lot of noise! Unfortunately, the conditions of the Panic may never be repeated in my lifetime … but the fund will simply attempt to make trades when swaps seem profitable, without worrying about the level of monthly turnover.

There’s plenty of room for new money left in the fund. I have shown in recent issues of PrefLetter that market pricing for FixedResets is demonstrably stupid and I have lots of confidence – backed up by my bond portfolio management experience in the markets for Canadas and Treasuries, and equity trading on the NYSE & TSX – that there is enough demand for liquidity in any market to make the effort of providing it worthwhile (although the definition of “worthwhile” in terms of basis points of outperformance changes considerably from market to market!) I will continue to exert utmost efforts to outperform but it should be borne in mind that there will almost inevitably be periods of underperformance in the future.

The yields available on high quality preferred shares remain elevated, which is reflected in the current estimate of sustainable income.

Calculation of MAPF Sustainable Income Per Unit
Month NAVPU Portfolio
Average
YTW
Leverage
Divisor
Securities
Average
YTW
Capital
Gains
Multiplier
Sustainable
Income
per
current
Unit
June, 2007 9.3114 5.16% 1.03 5.01% 1.3240 0.3524
September 9.1489 5.35% 0.98 5.46% 1.3240 0.3773
December, 2007 9.0070 5.53% 0.942 5.87% 1.3240 0.3993
March, 2008 8.8512 6.17% 1.047 5.89% 1.3240 0.3938
June 8.3419 6.034% 0.952 6.338% 1.3240 $0.3993
September 8.1886 7.108% 0.969 7.335% 1.3240 $0.4537
December, 2008 8.0464 9.24% 1.008 9.166% 1.3240 $0.5571
March 2009 $8.8317 8.60% 0.995 8.802% 1.3240 $0.5872
June 10.9846 7.05% 0.999 7.057% 1.3240 $0.5855
September 12.3462 6.03% 0.998 6.042% 1.3240 $0.5634
December 2009 10.5662 5.74% 0.981 5.851% 1.1141 $0.5549
March 2010 10.2497 6.03% 0.992 6.079% 1.1141 $0.5593
June 10.5770 5.96% 0.996 5.984% 1.1141 $0.5681
September 11.3901 5.43% 0.980 5.540% 1.1141 $0.5664
December 2010 10.7659 5.37% 0.993 5.408% 1.0298 $0.5654
March, 2011 11.0560 6.00% 0.994 5.964% 1.0298 $0.6403
June 11.1194 5.87% 1.018 5.976% 1.0298 $0.6453
September 10.2709 6.10%
Note
1.001 6.106% 1.0298 $0.6090
December, 2011 10.0793 5.63%
Note
1.031 5.805% 1.0000 $0.5851
March, 2012 10.3944 5.13%
Note
0.996 5.109% 1.0000 $0.5310
June 10.2151 5.32%
Note
1.012 5.384% 1.0000 $0.5500
September 10.6703 4.61%
Note
0.997 4.624% 1.0000 $0.4934
December, 2012 10.8307 4.24% 0.989 4.287% 1.0000 $0.4643
March, 2013 10.9033 3.87% 0.996 3.886% 1.0000 $0.4237
April, 2013 10.8468 4.10% 0.999 4.104% 1.0000 $0.4452
NAVPU is shown after quarterly distributions of dividend income and annual distribution of capital gains.
Portfolio YTW includes cash (or margin borrowing), with an assumed interest rate of 0.00%
The Leverage Divisor indicates the level of cash in the account: if the portfolio is 1% in cash, the Leverage Divisor will be 0.99
Securities YTW divides “Portfolio YTW” by the “Leverage Divisor” to show the average YTW on the securities held; this assumes that the cash is invested in (or raised from) all securities held, in proportion to their holdings.
The Capital Gains Multiplier adjusts for the effects of Capital Gains Dividends. On 2009-12-31, there was a capital gains distribution of $1.989262 which is assumed for this purpose to have been reinvested at the final price of $10.5662. Thus, a holder of one unit pre-distribution would have held 1.1883 units post-distribution; the CG Multiplier reflects this to make the time-series comparable. Note that Dividend Distributions are not assumed to be reinvested.
Sustainable Income is the resultant estimate of the fund’s dividend income per current unit, before fees and expenses. Note that a “current unit” includes reinvestment of prior capital gains; a unitholder would have had the calculated sustainable income with only, say, 0.9 units in the past which, with reinvestment of capital gains, would become 1.0 current units.
DeemedRetractibles are comprised of all Straight Perpetuals (both PerpetualDiscount and PerpetualPremium) issued by BMO, BNS, CM, ELF, GWO, HSB, IAG, MFC, NA, RY, SLF and TD, which are not exchangable into common at the option of the company (definition refined in May, 2011). These issues are analyzed as if their prospectuses included a requirement to redeem at par on or prior to 2022-1-31 (banks) or 2025-1-31 (insurers and insurance holding companies), in addition to the call schedule explicitly defined. See OSFI Does Not Grandfather Extant Tier 1 Capital, CM.PR.D, CM.PR.E, CM.PR.G: Seeking NVCC Status and the January, February, March and June, 2011, editions of PrefLetter for the rationale behind this analysis.
Yields for September, 2011, to January, 2012, were calculated by imposing a cap of 10% on the yields of YLO issues held, in order to avoid their extremely high calculated yields distorting the calculation and to reflect the uncertainty in the marketplace that these yields will be realized. From February to September 2012, yields on these issues have been set to zero. All YLO issues held were sold in October 2012.

Significant positions were held in DeemedRetractible and FixedReset issues on April 30; all of these currently have their yields calculated with the presumption that they will be called by the issuers at par prior to 2022-1-31 (banks) or 2025-1-31 (insurers and insurance holding companies). This presents another complication in the calculation of sustainable yield. The fund also holds a position various SplitShare issues which also have their yields calculated with the expectation of a maturity at par.

I will no longer show calculations that assume the conversion of the entire portfolio into PerpetualDiscounts, as there are currently only four such issues of investment grade, from only two issuers. Additionally, the fund has no holdings of these issues.

I will also note that the sustainable yield calculated above is not directly comparable with any yield calculation currently reported by any other preferred share fund as far as I am aware. The Sustainable Yield depends on:
i) Calculating Yield-to-Worst for each instrument and using this yield for reporting purposes;
ii) Using the contemporary value of Five-Year Canadas (set at 1.23% for the March 28 calculation) to estimate dividends after reset for FixedResets.

Most funds report Current Yield. For instance, ZPR reports a “Portfolio Yield” of 4.69% as of April 30, 2013 and notes:

Portfolio yield is calculated as the most recent income received by the ETF in the form of dividends interest and other income annualized based on the payment frequently divided by the current market value of ETFs investments.

In other words – it’s the Current Yield, a meaningless number. The Current Yield of MAPF is 5.13%, but I will neither report that with any degree of prominence nor take any great pleasure in the fact that it’s higher than the ZPR number. It’s meaningless; to accord it any prominence in portfolio reporting is misleading.

It should be noted that the concept of this Sustainable Income calculation was developed when the fund’s holdings were overwhelmingly PerpetualDiscounts – see, for instance, the bottom of the market in November 2008. It is easy to understand that for a PerpetualDiscount, the technique of multiplying yield by price will indeed result in the coupon – a PerpetualDiscount paying $1 annually will show a Sustainable Income of $1, regardless of whether the price is $24 or $17.

Things are not quite so neat when maturity dates and maturity prices that are different from the current price are thrown into the mix. If we take a notional Straight Perpetual paying $5 annually, the price is $100 when the yield is 5% (all this ignores option effects). As the yield increases to 6%, the price declines to 83.33; and 83.33 x 6% is the same $5. Good enough.

But a ten year bond, priced at 100 when the yield is equal to its coupon of 5%, will decline in price to 92.56; and 92.56 x 6% is 5.55; thus, the calculated Sustainable Income has increased as the price has declined as shown in the graph:
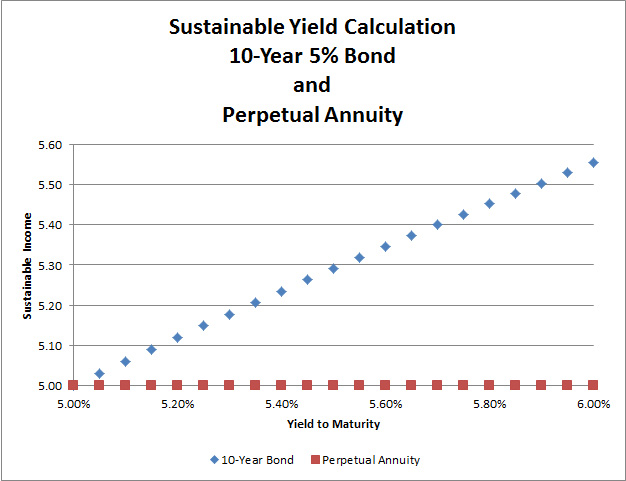

Click for Big

The difference is because the bond’s yield calculation includes the amortization of the discount; therefore, so does the Sustainable Income estimate.

Thus, the decline in the MAPF Sustainable Income from $0.5500 per unit in June, 2012, to $0.4452 per unit in March should be looked at as a simple consequence of the fund’s holdings; virtually all of which have their yields calculated in a manner closer to bonds than to Perpetual Annuities.

Different assumptions lead to different results from the calculation, but the overall positive trend is apparent. I’m very pleased with the long-term results! It will be noted that if there was no trading in the portfolio, one would expect the sustainable yield to be constant (before fees and expenses). The success of the fund’s trading is showing up in

  • the very good performance against the index
  • the long term increases in sustainable income per unit

As has been noted, the fund has maintained a credit quality equal to or better than the index; outperformance is due to exploitation of trading anomalies.

Again, there are no predictions for the future! The fund will continue to trade between issues in an attempt to exploit market gaps in liquidity, in an effort to outperform the index and keep the sustainable income per unit – however calculated! – growing.
MAPF Portfolio Composition: April, 2013

Saturday, May 4th, 2013

Turnover remained very low in April, at about 4%.

There is extreme segmentation in the marketplace, with OSFI’s NVCC rule changes in February 2011 having had the effect of splitting the formerly relatively homogeneous Straight Perpetual class of preferreds into three parts:

  • Unaffected Straight Perpetuals
  • DeemedRetractibles explicitly subject to the rules (banks)
  • DeemedRetractibles considered by me, but not (yet!) by the market, to be likely to be explicitly subject to the rules in the future (insurers and insurance holding companies)

This segmentation, and the extreme valuation differences between the segments, has cut down markedly on the opportunities for trading. Another trend that hasn’t helped has been the migration of PerpetualDiscounts into PerpetualPremiums (due to price increases) – many of the PerpetualPremiums have negative Yields-to-Worst and those that don’t aren’t particularly thrilling; speaking very generally, PerpetualPremiums are to be avoided, not traded! This effect has caused the first of the three segments noted above to be untradeable for most practical purposes.

To make this more clear, it used to be that there were 70-odd Straight Perpetuals and I was more or less indifferent as to which ones I owned (subject, of course, to issuer concentration concerns and other risk management factors). Thus, if any one of these 70 were to go down in price by – say – $0.25, I would quite often have something in inventory that I’d be willing to swap for it. The segmentation means that I am no longer indifferent; in addition to checking the valuation of a potential buy to its peers, I also have to check its peer group. This cuts down on the potential for trading.

There is no real hope that this situation will be corrected in the near-term. OSFI has indicated that the long-promised “Draft Definition of Capital” for insurers will not be issued “for public consultation in late 2012 or early 2013”, as they fear that it might encourage speculation in the marketplace. It is not clear why OSFI is so afraid of informed speculation, since the constant speculation in the marketplace is currently less informed than it would be with a little bit of regulatory clarity.

As a result of this delay, I have extended the Deemed Maturity date for insurers and insurance holding companies by three years, in the expectation that when OSFI finally does provide clarity, they will allow the same degree of lead-in time for these companies as they did for banks. This has obviously had a major effect on the durations of preferred shares subject to the change but, fortunately, not much on their calculated yields as most of these issues are either trading near par or were trading at sufficient premium that a par call was expected on economic grounds.

Sectoral distribution of the MAPF portfolio on April 30 was as follows:

MAPF Sectoral Analysis 2013-4-30
HIMI Indices Sector Weighting YTW ModDur
Ratchet 0% N/A N/A
FixFloat 0% N/A N/A
Floater 0% N/A N/A
OpRet 0% N/A N/A
SplitShare 10.0% (+0.4) 4.68% 5.00
Interest Rearing 0% N/A N/A
PerpetualPremium 0.0% (0) N/A N/A
PerpetualDiscount 0.0% (0) N/A N/A
Fixed-Reset 31.0% (+1.3) 2.54% 1.51
Deemed-Retractible 53.6% (-1.1) 4.64% 8.19
Scraps (Various) 5.5% (-0.1) 6.63% 9.91
Cash -0.1% (-0.5) 0.00% 0.00
Total 100% 4.10% 5.90
Totals and changes will not add precisely due to rounding. Bracketted figures represent change from March month-end. Cash is included in totals with duration and yield both equal to zero.
DeemedRetractibles are comprised of all Straight Perpetuals (both PerpetualDiscount and PerpetualPremium) issued by BMO, BNS, CM, ELF, GWO, HSB, IAG, MFC, NA, RY, SLF and TD, which are not exchangable into common at the option of the company. These issues are analyzed as if their prospectuses included a requirement to redeem at par on or prior to 2022-1-31 (banks) or 2025-1-3 (insurers and insurance holding companies), in addition to the call schedule explicitly defined. See OSFI Does Not Grandfather Extant Tier 1 Capital, CM.PR.D, CM.PR.E, CM.PR.G: NVCC Status Confirmed and the January, February, March and June, 2011, editions of PrefLetter for the rationale behind this analysis. (all recent editions have a short summary of the argument included in the “DeemedRetractible” section)

Note that the estimate for the time this will become effective for insurers and insurance holding companies was extended by three years in April 2013, due to the delays in OSFI’s providing clarity on the issue.

The “total” reflects the un-leveraged total portfolio (i.e., cash is included in the portfolio calculations and is deemed to have a duration and yield of 0.00.). MAPF will often have relatively large cash balances, both credit and debit, to facilitate trading. Figures presented in the table have been rounded to the indicated precision.

Credit distribution is:

MAPF Credit Analysis 2013-4-30
DBRS Rating Weighting
Pfd-1 0 (0)
Pfd-1(low) 37.6% (+1.0)
Pfd-2(high) 38.9% (-0.7)
Pfd-2 8.1% (0)
Pfd-2(low) 10.0% (+0.4)
Pfd-3(high) 1.0% (0)
Pfd-3 1.5% (0)
Pfd-3(low) 0.6% (+0.3)
Pfd-4(high) 0.4% (0)
Pfd-4 1.3% (0)
Pfd-4(low) 0.8% (-0.3)
Cash -0.1% (-0.5)
Totals will not add precisely due to rounding. Bracketted figures represent change from March month-end.

Liquidity Distribution is:

MAPF Liquidity Analysis 2013-4-30
Average Daily Trading Weighting
<$50,000 7.1% (+6.4)
$50,000 – $100,000 10.2% (+1.2)
$100,000 – $200,000 44.4% (+10.7)
$200,000 – $300,000 27.8% (-16.2)
>$300,000 10.7% (-10.4)
Cash -0.1% (-0.5)
Totals will not add precisely due to rounding. Bracketted figures represent change from February month-end.

MAPF is, of course, Malachite Aggressive Preferred Fund, a “unit trust” managed by Hymas Investment Management Inc. Further information and links to performance, audited financials and subscription information are available the fund’s web page. The fund may be purchased either directly from Hymas Investment Management or through a brokerage account at Odlum Brown Limited. A “unit trust” is like a regular mutual fund, but is sold by offering memorandum rather than prospectus. This is cheaper, but means subscription is restricted to “accredited investors” (as defined by the Ontario Securities Commission) or those who subscribe for $150,000+. Fund past performances are not a guarantee of future performance. You can lose money investing in MAPF or any other fund.

A similar portfolio composition analysis has been performed on the Claymore Preferred Share ETF (symbol CPD) (and other funds) as of August 31, 2012, and published in the October (mainly methodology), November (most funds), and December (ZPR) 2012, PrefLetter. While direct comparisons are difficult due to the introduction of the DeemedRetractible class of preferred share (see above) it is fair to say:

  • MAPF credit quality is better
  • MAPF liquidity is a lower
  • MAPF Yield is higher
  • Weightings in
    • MAPF is much more exposed to DeemedRetractibles
    • MAPF is much less exposed to Operating Retractibles
    • MAPF is much more exposed to SplitShares
    • MAPF is less exposed to FixFloat / Floater / Ratchet
    • MAPF weighting in FixedResets is much lower

May 3, 2013

Saturday, May 4th, 2013

There was a good jobs number in the US:

American employers took on more workers than forecast in April and the jobless rate unexpectedly fell to a four-year low of 7.5 percent, reflecting confidence in the outlook for the world’s biggest economy.

Payrolls expanded by 165,000 following a revised 138,000 increase in March that was larger than first estimated, Labor Department figures showed today in Washington. Revisions added a total of 114,000 jobs to the counts for February and March.

There continues to be some concern amongst those who have recently realized that central bank heads should be independent:

The decision of the Harper government to name an outsider as the next governor of the Bank of Canada will raise uncomfortable questions over the sacrosanct independence of the central bank.

That’s not to suggest that Stephen Poloz isn’t qualified for the key position, only that he comes to the job with that hanging over his head.

The job of finding a Bank of Canada governor actually lies with the central bank’s board of directors, which interviews candidates and then presents its recommendation to the finance minister.

However, this time around, Mr. Flaherty in January issued a news release saying that he would be interviewing a short list of potential governors. He actually did that in 2007, as well, but without the fanfare.

Bloomberg reminds me that:

At the European Central Bank, it was Bundesbank President Axel Weber who made the early running to replace Jean-Claude Trichet as head in 2011 before dropping out in part because he anticipated clashing with governments. The post went instead to Bank of Italy Governor Mario Draghi.

And some snippets of interest have already been reported:

Flaherty says “you’re doing great” after Poloz said: “I certainly wouldn’t express a judgement about fiscal policies in any jurisdiction.”

As well as comment in the media:

In reality, it is a very political appointment – which, in part, explains why Stephen Poloz is the new Governor.

But at the end of the day, it was likely Mr. Poloz’s indication that he was happy to accommodate the government’s agenda that won him the job.

Nothing impresses the members of this government more than agreeing with them.

In the opinion of Moody’s analysts:

The signal sent to markets is not clear, but suggests the government wants to exercise more control over policymaking.

Julie Dickson of OSFI made a speech at the 2013 Financial Services Invitational Forum:

At OSFI, cyber risk has become one of our top concerns. A growing number of North American banks have been hit with denial of service attacks, in some cases causing websites to go down, thereby creating problems for customers trying to do everyday transactions.

At OSFI, we have significantly increased our supervisory resources in the Op-risk area, and have launched a number of initiatives, such as conducting in-depth reviews of institutions’ current cyber protection practices.

Some other countries are experiencing frothy real estate markets and have introduced floors on risk weights — sometimes around 15 per cent. Given that in Canada the uninsured mortgages would tend to be of higher quality than the average loan portfolio in other countries (because uninsured loans in Canada have maximum loan-to-value ratios of 80 per cent), we are generally comfortable with the capital being held by banks using models. OSFI is also aware that floors can become safe harbours and lead banks and supervisors to pay less attention to the ―appropriate‖ risk weight, especially when it should be well above the floor for a particular bank. Thus, our focus will continue to be on scrutinizing models currently in use.

The natural genetics of a bank are sometimes to give the business lines considerable leeway and to see risk management and internal audit as standing in the way of progress. This ―wiring‖ reflects the fact that the business is where the money is made – at least in the short term. A bank cannot consistently make money without regard for sound risk management. So, structures and processes need to be built as a counterbalance, and to reinforce a broader and longer perspective. Risk appetite statements are part of the new suite of tools to aid in ensuring that the bank management and the board have a 100 per cent agreement on the balance of power in the institution and the overall risk stance.

It was a mixed day for the Canadian preferred share market, with PerpetualPremiums gaining 2bp, FixedResets off 7bp and DeemedRetractibles up 5bp. Volatility was minimal. Volume was ludicrously low – did everybody take off early for the first warm weekend?

HIMIPref™ Preferred Indices
These values reflect the December 2008 revision of the HIMIPref™ Indices

Values are provisional and are finalized monthly
Index Mean
Current
Yield
(at bid)
Median
YTW
Median
Average
Trading
Value
Median
Mod Dur
(YTW)
Issues Day’s Perf. Index Value
Ratchet 0.00 % 0.00 % 0 0.00 0 -0.0126 % 2,620.6
FixedFloater 3.94 % 3.17 % 33,441 18.77 1 0.0000 % 4,168.0
Floater 2.66 % 2.86 % 83,505 20.07 4 -0.0126 % 2,829.5
OpRet 4.80 % 0.25 % 60,909 0.16 5 -0.0695 % 2,610.4
SplitShare 4.79 % 4.07 % 109,885 4.09 5 0.0001 % 2,964.9
Interest-Bearing 0.00 % 0.00 % 0 0.00 0 -0.0695 % 2,387.0
Perpetual-Premium 5.20 % 2.95 % 87,018 0.45 31 0.0218 % 2,383.8
Perpetual-Discount 4.83 % 4.85 % 180,552 15.68 4 0.1826 % 2,691.1
FixedReset 4.88 % 2.71 % 241,050 3.74 81 -0.0706 % 2,514.8
Deemed-Retractible 4.87 % 3.39 % 136,150 0.96 44 0.0521 % 2,459.7
Performance Highlights
Issue Index Change Notes
CU.PR.C FixedReset -1.40 % YTW SCENARIO
Maturity Type : Call
Maturity Date : 2017-06-01
Maturity Price : 25.00
Evaluated at bid price : 26.70
Bid-YTW : 2.43 %
Volume Highlights
Issue Index Shares
Traded
Notes
TRP.PR.B FixedReset 65,791 Desjardins crossed 49,700 at 24.91.
YTW SCENARIO
Maturity Type : Limit Maturity
Maturity Date : 2043-05-03
Maturity Price : 23.51
Evaluated at bid price : 24.90
Bid-YTW : 2.45 %
W.PR.H Perpetual-Premium 43,506 Nesbitt crossed 41,200 at 25.68.
YTW SCENARIO
Maturity Type : Call
Maturity Date : 2013-06-02
Maturity Price : 25.00
Evaluated at bid price : 25.60
Bid-YTW : -19.13 %
W.PR.J Perpetual-Premium 41,640 Nesbitt crossed 28,200 at 25.40.
YTW SCENARIO
Maturity Type : Call
Maturity Date : 2013-06-02
Maturity Price : 25.00
Evaluated at bid price : 25.45
Bid-YTW : -12.39 %
TD.PR.P Deemed-Retractible 40,400 Nesbitt crossed 40,000 at 26.50.
YTW SCENARIO
Maturity Type : Call
Maturity Date : 2013-06-02
Maturity Price : 26.00
Evaluated at bid price : 26.45
Bid-YTW : -14.78 %
ENB.PR.F FixedReset 29,981 YTW SCENARIO
Maturity Type : Call
Maturity Date : 2018-06-01
Maturity Price : 25.00
Evaluated at bid price : 25.92
Bid-YTW : 3.37 %
RY.PR.X FixedReset 22,640 TD crossed 20,000 at 26.27.
YTW SCENARIO
Maturity Type : Call
Maturity Date : 2014-08-24
Maturity Price : 25.00
Evaluated at bid price : 26.22
Bid-YTW : 2.19 %
There were 10 other index-included issues trading in excess of 10,000 shares.
Wide Spread Highlights
Issue Index Quote Data and Yield Notes
CIU.PR.C FixedReset Quote: 25.03 – 25.64
Spot Rate : 0.6100
Average : 0.4870

YTW SCENARIO
Maturity Type : Limit Maturity
Maturity Date : 2043-05-03
Maturity Price : 23.38
Evaluated at bid price : 25.03
Bid-YTW : 2.55 %

PWF.PR.P FixedReset Quote: 25.56 – 25.94
Spot Rate : 0.3800
Average : 0.2727

YTW SCENARIO
Maturity Type : Limit Maturity
Maturity Date : 2043-05-03
Maturity Price : 23.61
Evaluated at bid price : 25.56
Bid-YTW : 2.72 %

MFC.PR.I FixedReset Quote: 26.35 – 26.60
Spot Rate : 0.2500
Average : 0.1481

YTW SCENARIO
Maturity Type : Call
Maturity Date : 2017-09-19
Maturity Price : 25.00
Evaluated at bid price : 26.35
Bid-YTW : 3.22 %

CU.PR.C FixedReset Quote: 26.70 – 27.00
Spot Rate : 0.3000
Average : 0.2024

YTW SCENARIO
Maturity Type : Call
Maturity Date : 2017-06-01
Maturity Price : 25.00
Evaluated at bid price : 26.70
Bid-YTW : 2.43 %

IAG.PR.C FixedReset Quote: 25.65 – 25.98
Spot Rate : 0.3300
Average : 0.2441

YTW SCENARIO
Maturity Type : Call
Maturity Date : 2013-12-31
Maturity Price : 25.00
Evaluated at bid price : 25.65
Bid-YTW : 3.09 %

W.PR.J Perpetual-Premium Quote: 25.45 – 25.76
Spot Rate : 0.3100
Average : 0.2308

YTW SCENARIO
Maturity Type : Call
Maturity Date : 2013-06-02
Maturity Price : 25.00
Evaluated at bid price : 25.45
Bid-YTW : -12.39 %

BPO / BPP Share Exchange Completed

Friday, May 3rd, 2013

The Toronto Venture Exchange has announced:

BPO PROPERTIES LTD. (“BPP.PR.G”)(“BPP.PR.J”)(“BPP.PR.M”)
BULLETIN TYPE: Amalgamation, Delist
BULLETIN DATE: May 1, 2013
TSX Venture Tier 1 Company

The TSX Venture Exchange has accepted for filing documentation pursuant to a court approved plan of arrangement (the “Arrangement”). Pursuant to the Arrangement, the Series G, J and M Preferred Shares of BPO Properties Ltd. will be exchanged for Class AAA Preference Shares of Brookfield Office Properties Inc.

Effective at the close of business, Wednesday, May 1, 2013, the Preferred Shares (BPP.PR.G, BPP.PR.J and BPP.PR.M) of the Company will be delisted from TSX Venture Exchange. At the open on May 2, 2013 on the Toronto Stock Exchange, Brookfield Office Properties Inc. will list Series V, W and Y Class AAA Preference Shares. For further information please refer to the Company’s information circular dated March 28, 2013 and the Company’s news release dated March 22, 2013.

Accordingly, DBRS has discontinued the rating:

DBRS has today discontinued the Issuer Rating and Cumulative Redeemable Preferred Shares rating of BPO Properties Ltd. (BPO or the Company). This action follows the successful completion of the previously announced transaction involving the exchange of the Company’s preferred shares for new Class AAA preference shares of Brookfield Office Properties Inc. As such, BPO no longer has any outstanding public securities.

And on May 2 they started trading as advertised. As previously reported:

Old Ticker New Ticker
BPP.PR.G BPO.PR.PX
BPP.PR.J BPO.PR.W
BPP.PR.M BPO.PR.Y