The NYSE was not open for much of the day:
A computer malfunction that knocked out trading at the New York Stock Exchange for more than three hours Wednesday probably stemmed from a software update that went awry, said two people briefed on a preliminary review.
The NYSE must now verify the cause and report its conclusions to the U.S. Securities and Exchange Commission, said the people who asked not to be named because the inquiry isn’t public. The SEC will use those findings to investigate whether any rule violations occurred, the people said.
Fortunately, the accidentally distributed architecture of US equity trading saved the day:
While often the focus of criticism, the fragmented nature of the U.S. equity market helped shares keep trading on NYSE competitors such as Nasdaq OMX Group Inc. and Bats Global Markets Inc. No single market handles more than 16 percent of overall volume. Farley used this as part of his decision-making today.
“My first concern was, do no harm during the day — those stocks continue to trade elsewhere — get the problem fixed and get it back up and running for the close,” he said. The exchange also chose not to shift operations to its disaster recovery center because that would’ve required customers to connect to that venue, [NYSE President Tom] Farley said.
“We chose the least disruptive option for customers,” he said.
Fortunately, the inherent robustness of distributed architecture has been noted:
The New York Stock Exchange halted trading for 3 1/2 hours because of a computer malfunction, forcing traders to route orders elsewhere in a drama that also highlighted the resilience of U.S. market structure.
The suspension, lasting from 11:32 a.m. to just after 3 p.m. New York time, dropped the largest U.S. share platform out of the network of trading systems that make up the American equity market. That network kept running, however, as exchanges such as the Nasdaq Stock Market and Bats Global Markets Inc. picked up the runoff.
“That’s one of the things to ponder from this, to see the robustness of how the system works when you knock out one critical component,” said Thomas Caldwell, chairman of Caldwell Securities Ltd. in Toronto. “We do have more than one exchange, and that means that if the major market is closed, the orders typically get rerouted to others.”
However, I do not expect the regulators to take any account of this lesson when considering bank holdings of other banks’ paper and central clearing; they will continue their headlong accentuation of vulnerability to single-point-failure because, you know, regulators are pretty damn stupid. And with a distributed system they have to send out more resumes when they seek to leave government employment.
Speaking of stupid policies, how about those electricity rates, eh?:
Soaring electricity rates in Ontario are threatening industries and businesses across the province, with one in 20 reporting they expect to shut down in the next five years, according to a major study by the Ontario Chamber of Commerce (OCC).
Businesses can’t grow, make improvements or investments or even hire new workers because of the increasing rates, which are among the highest in the country and expected to continue to rise over the next 20 years, says the report, Empowering Ontario: Constraining Costs & Staying Competitive in the Electricity Sector, released Wednesday.
…
Jamey Heaton employs 21 people at his North Bay business, Bavarian Link Meat Products Ltd., which he has owned for three years. They produce and sell premium deli meats, sausages, smoked items, specialty bacon and meat snacks.His electricity costs are more than $110,000 a year – the second-largest cost after salaries. He calls the high electricity prices a “huge burden.”
He says the rates have “slowed our expansion.” “If we spent 50 per cent less, I would invest the $50,000 in new equipment, which would lead to new jobs,” he says. “We have already grown by 25 per cent a year every year over the last three years and could grow more if there were additional funds.”
To keep costs down, he says, they cook mostly with natural gas, but he still has to rely on electricity as the 15,000-square-foot plant is refrigerated.
“We also, as industrial consumers, don’t benefit from time-of-day usage, whereas, if you’re a consumer, you get that time-of-day usage,” he says. “I can switch some of my production to do things at nighttime but there is no advantage for me to do it.”
He wonders why he can’t take advantage of the lower costs.
But China wins the prize:
China’s securities regulator banned major shareholders, corporate executives and directors from selling stakes in listed companies for six months, its latest effort to stop the nation’s $3.5 trillion stock-market rout.
Investors with stakes exceeding 5 percent must maintain their positions, the China Securities Regulatory Commission said in a statement. The rule is intended to guard capital-market stability amid an “unreasonable plunge” in share prices, the CSRC said.
While China has already ordered government-owned institutions to maintain or boost their stock holdings, the CSRC’s directive expands the ban on sales to non-state companies and potentially foreign investors who own major stakes in mainland businesses.
…
Chinese authorities have also suspended initial public offerings, restricted bearish bets via stock-index futures and encouraged financial firms to buy shares. In perhaps the most dramatic effort to prevent investors from selling, local exchanges have allowed at least 1,331 companies to halt trading in their shares.
The new initiative was met with well-deserved scorn:
Templeton Emerging Markets Group calls it an act of “desperation.” UBS Wealth Management labels it “extreme.” And Wells Fargo Funds Management says it just “postpones the inevitable.”
China’s decision to ban major stockholders from selling stakes in listed companies has drawn skepticism from foreign investors. The money managers, with combined assets of almost $4 trillion, say the latest step to stem the country’s equity rout is just another measure to meddle in the market and won’t be enough to restore investors’ confidence.
“It suggests desperation,” Mark Mobius, chairman of Templeton Emerging Markets Group, said by phone. “It actually creates more fear because it shows that they’ve lost control.”
…
“The measure can be effective in the short term because you are not going to allow people to trade,” said Jorge Mariscal, the emerging-markets chief investment officer at UBS Wealth Management, which oversees $1 trillion in invested assets, said by phone. “But they are undermining the credibility on the soundness of the regulatory framework going forward. Things are a little extreme and counter-productive.”As the record-breaking boom goes bust, President Xi Jinping is intervening in an attempt to prevent the rout from eroding confidence in his leadership. The moves have cast doubt on the Communist Party’s pledge less than two years ago to give market forces a bigger role in the economy, which is part of its largest reform drive since the 1990s.
Fed minutes show the FOMC was worried about this:
Federal Reserve officials in June saw the economy moving toward conditions that would support an interest-rate increase, while also expressing concern about weak consumer spending and risks from China and Greece that have since intensified.
Policy makers “saw economic conditions as continuing to approach those consistent with warranting” tighter monetary policy at some point, according to minutes of their June 16-17 meeting released Wednesday in Washington. All but one “indicated that they would need to see more evidence that economic growth was sufficiently strong.”
…
The minutes of the Federal Open Market Committee showed several officials “mentioned their uncertainty about whether Greece and its official creditors would reach an agreement and about the likely pace of economic growth abroad, particularly in China and other emerging-market economies.”Separately, Fed Bank of San Francisco President John Williams Wednesday maintained his call for two rate increases this year.
“We will get greater clarity, hopefully, on what’s happening in Greece and the euro area,” by September, Williams, a voting member of the FOMC this year, told reporters after a speech in Los Angeles.
In the Canadian markets were affected by a slow pace of construction:
Canadian building permits fell more than economists forecast in May, with declines across all major types of projects from hospitals to condominiums and industrial sites.
The value of municipal permits fell 14.5 percent to C$6.7 billion ($5.27 billion), giving back part of the gains recorded over the prior two months, Statistics Canada said Wednesday in Ottawa. Economists forecast a 5 percent fall according to the median of 11 responses to a Bloomberg survey.
and there were calls for a policy rate cut:
Bank of Montreal’s Doug Porter and Royal Bank of Canada’s Mark Chandler joined a growing list of economists calling for Canada’s central bank to cut interest rates next week on signs of a faltering recovery.
Porter and Chandler predicted Wednesday the Bank of Canada will reduce its overnight rate to 0.5 percent at the next decision July 15. They changed their predictions after a report Tuesday showed a drop in non-energy exports pushed Canada’s trade deficit to the second-largest on record.
exacerbated by a flight to Treasuries:
Call it trading places in the financial markets. Treasuries are up for the year and U.S. shares are down — an about face from just a few weeks ago.
After a weeklong rally through Wednesday, the Bloomberg U.S. Treasury Bond Index has now returned 0.7 percent for 2015. That’s a relief for investors in the world’s biggest bond market following three months of losses from April through June. The Standard & Poor’s 500 Index is down 0.6 percent for the year, with the gauge falling from a record in May.
What changed? Greece is struggling to stay in the euro currency union and Chinese shares are plunging, driving demand for the relative safety of U.S. government debt. The Federal Reserve acknowledged the potential risks from overseas crises, boosting speculation it will delay increasing interest rates until next year.
Five year Canada’s dropped to 0.65% compared to 0.82% on July 2.
So according to the preferred share market …

Click for Big
IT’S THE END OF THE WORLD!!!!!
It was an appalling day for the Canadian preferred share market, with PerpetualDiscounts down 46bp, FixedResets losing an incredible 171bp and DeemedRetractibles off 10bp. The Performance Highlights table is as lengthy as one might expect given the overall numbers, dominated by losing FixedResets with ENB issues particularly notable amongst the worst of the losers. Volume was extremely high.
PerpetualDiscounts now yield 5.37%, equivalent to 6.98% interest at the standard equivalency factor of 1.3x. Long corporates now yield about 3.95%, so the pre-tax interest-equivalent spread (in this context, the “Seniority Spread”) has rocketed up to about 305bp, an immense leap from the 260bp reported June 24.
For as long as the FixedReset market is so violently unsettled, I’ll keep publishing updates of the more interesting and meaningful series of FixedResets’ Implied Volatilities. This doesn’t include Enbridge because although Enbridge has a large number of issues outstanding, all of which are quite liquid, the range of Issue Reset Spreads is too small for decent conclusions. The low is 212bp (ENB.PR.H; second-lowest is ENB.PR.D at 237bp) and the high is a mere 268 for ENB.PF.G.
Remember that all rich /cheap assessments are:
» based on Implied Volatility Theory only
» are relative only to other FixedResets from the same issuer
» assume constant GOC-5 yield
» assume constant Implied Volatility
» assume constant spread
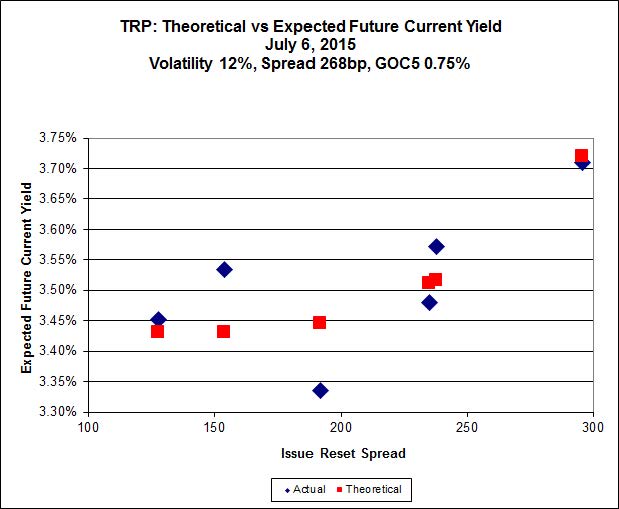
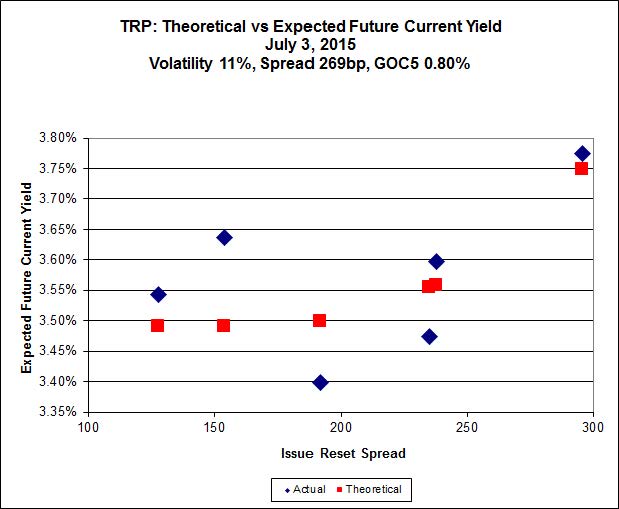
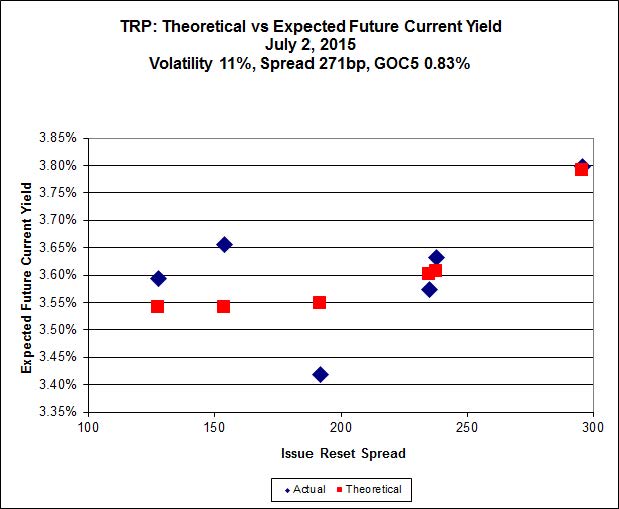
Here’s TRP:

Click for Big
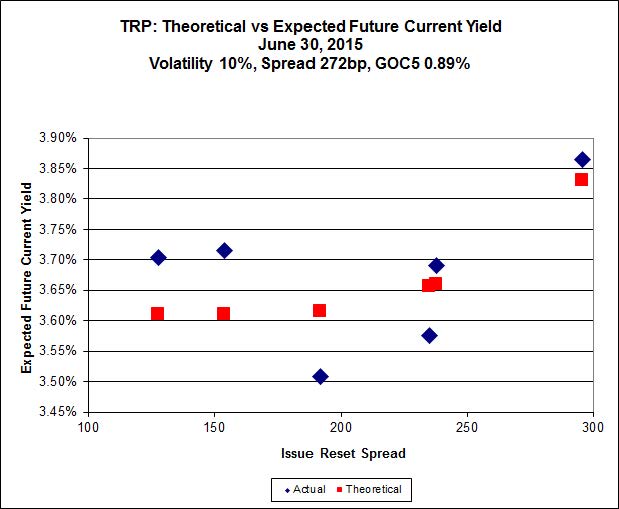
TRP.PR.A, which resets 2019-12-31 at +192, is bid at 19.60 to be $0.59 rich, while TRP.PR.D, resetting 2019-4-30 at +238, is $0.57 cheap at its bid price of 21.30.

Click for Big
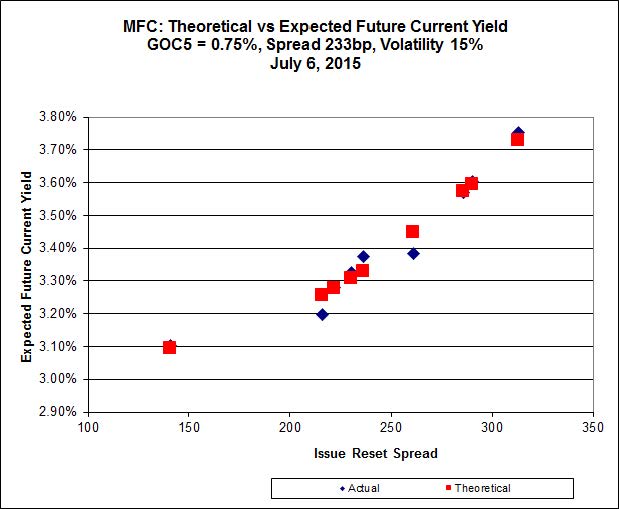
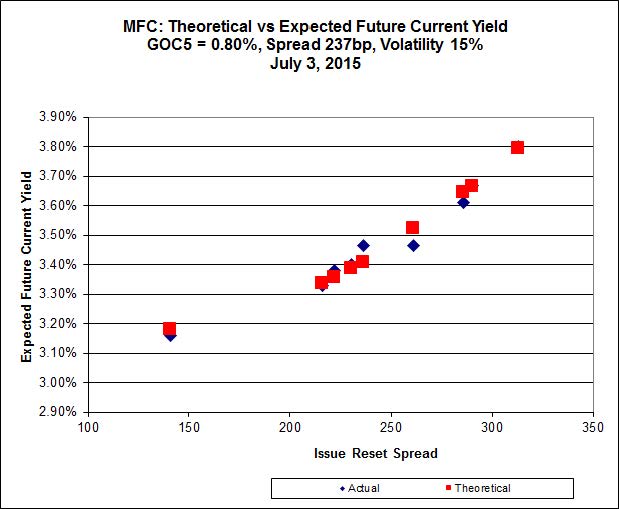
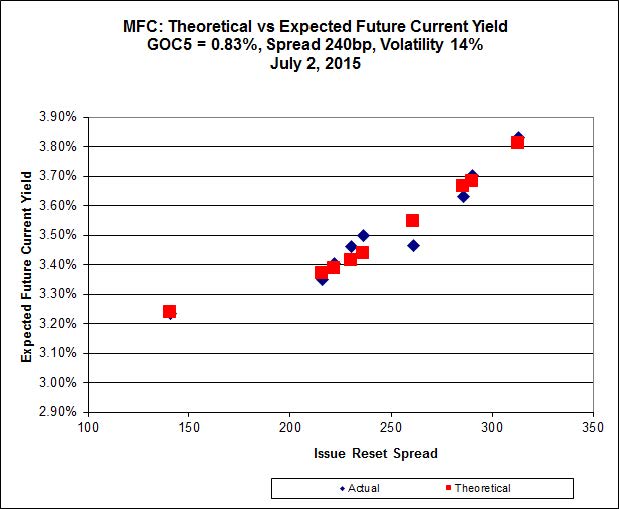
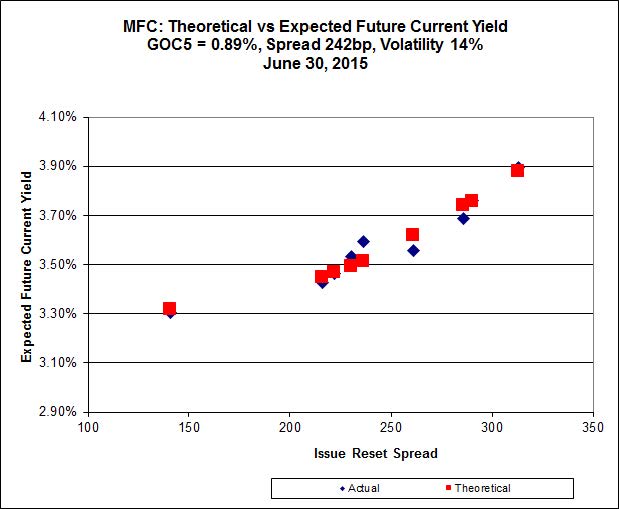
Another excellent fit, but the numbers are perplexing. Implied Volatility for MFC continues to be a conundrum. It is still too high if we consider that NVCC rules will never apply to these issues; it is still too low if we consider them to be NVCC non-compliant issues (and therefore with Deemed Maturities in the call schedule).
Most expensive is MFC.PR.F, resetting at +141bp on 2016-6-19, bid at 17.11 to be $0.64 rich, while MFC.PR.M, resetting at +236bp on 2019-12-19, is bid at 22.05 to be $0.67 cheap.

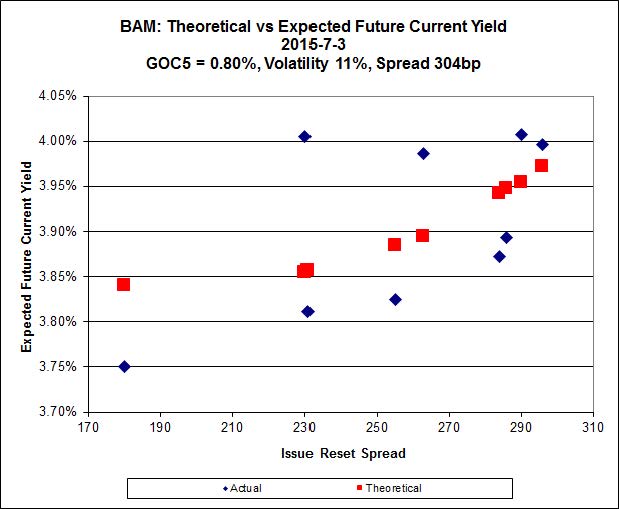
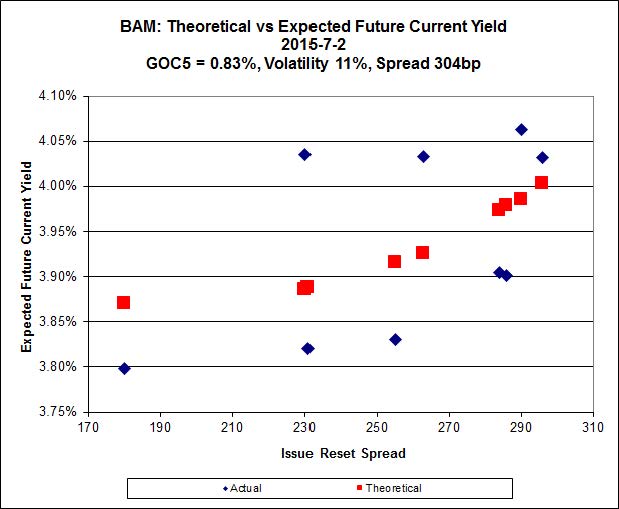
Click for Big
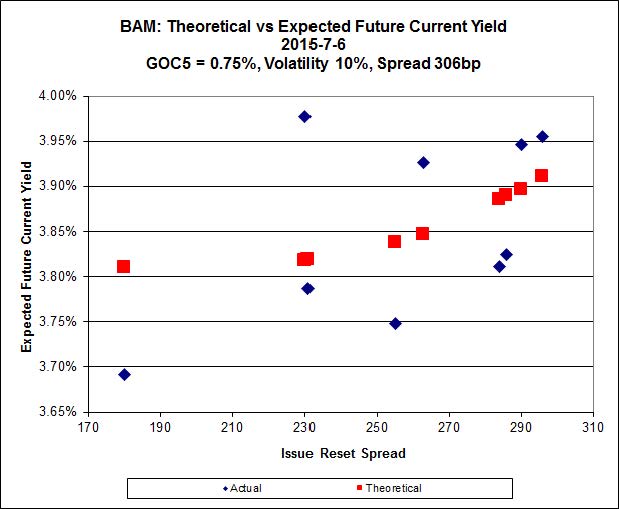
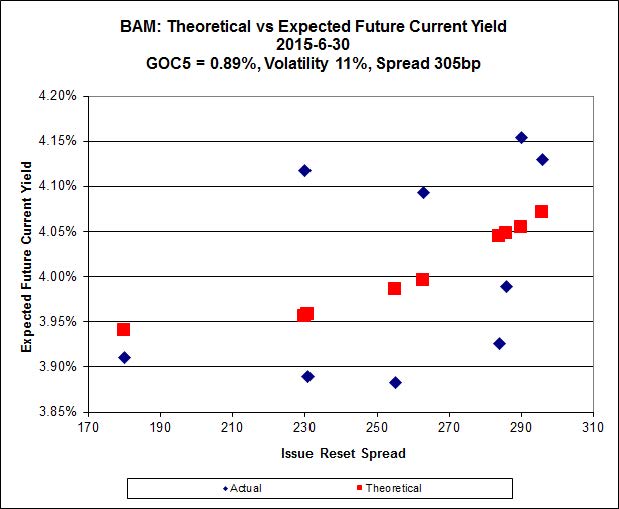
The cheapest issue relative to its peers is BAM.PR.R, resetting at +230bp on 2016-6-30, bid at 18.70 to be $0.88 cheap. BAM.PF.E, resetting at +255bp 2020-3-31 is bid at 22.07 and appears to be $1.05 rich.

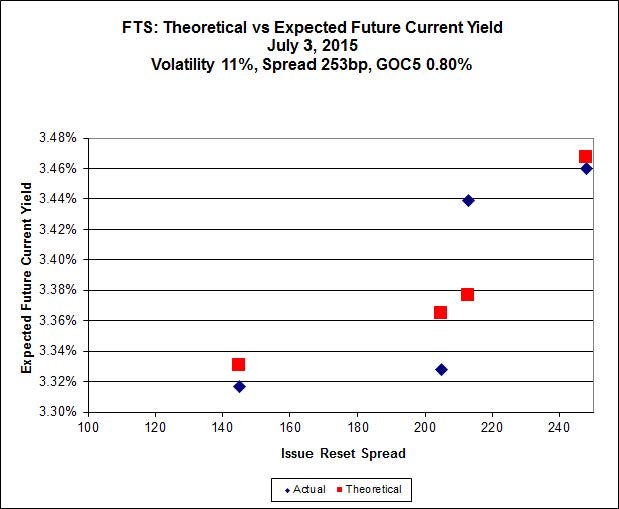
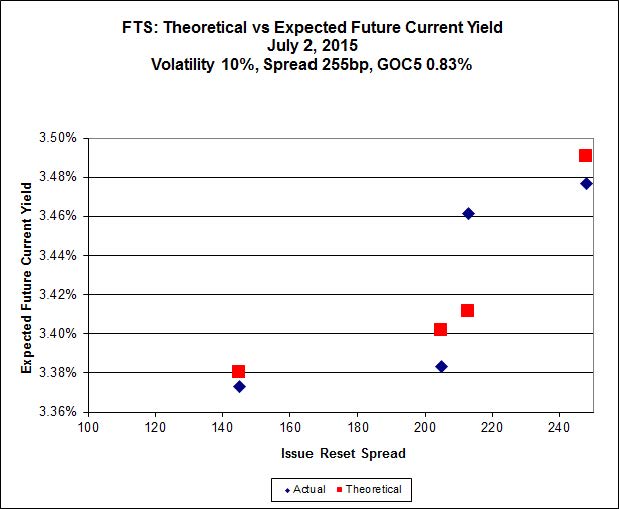
Click for Big
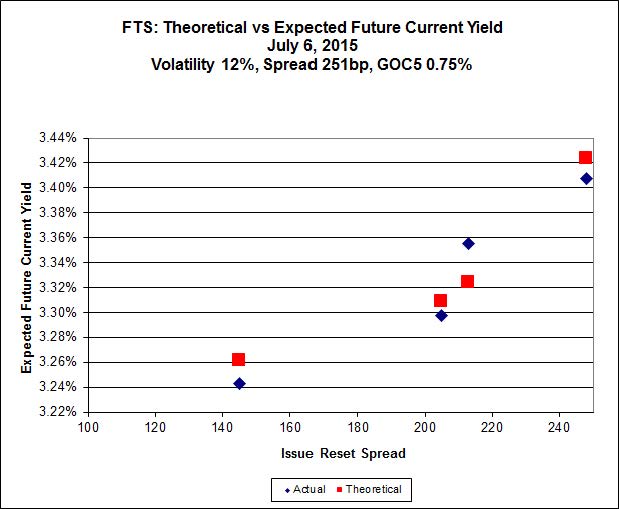
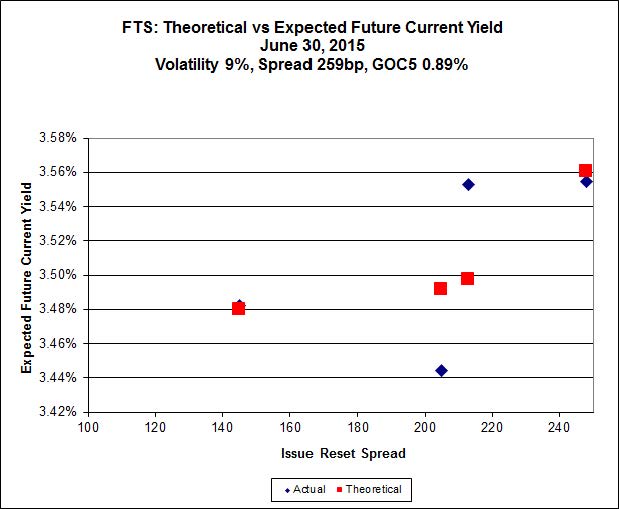
FTS.PR.G, with a spread of +213bp, and bid at 21.53, looks $0.48 expensive and resets 2018-9-1. FTS.PR.M, with a spread of +248bp and resetting 2019-12-1, is bid at 22.00 and is $0.66 cheap.
Note that there has been a very sharp rise in calculated implied volatility today; that is that the lower-spread issues strongly outperformed their higher-spread siblings. The current calculated level of implied volatility is currently unreasonably high; reversion to a lower level will imply underperformance of the lower-spread issues.

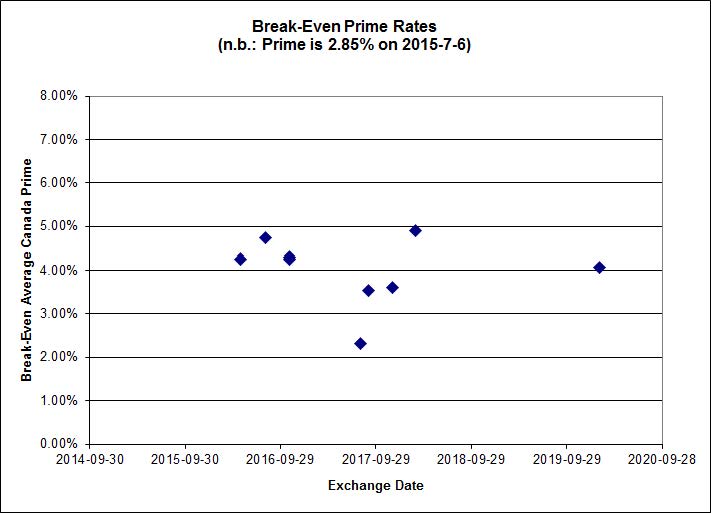
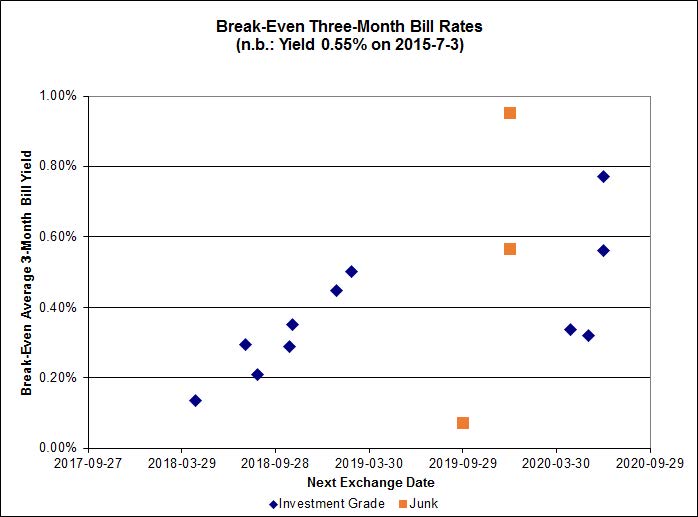
Click for Big
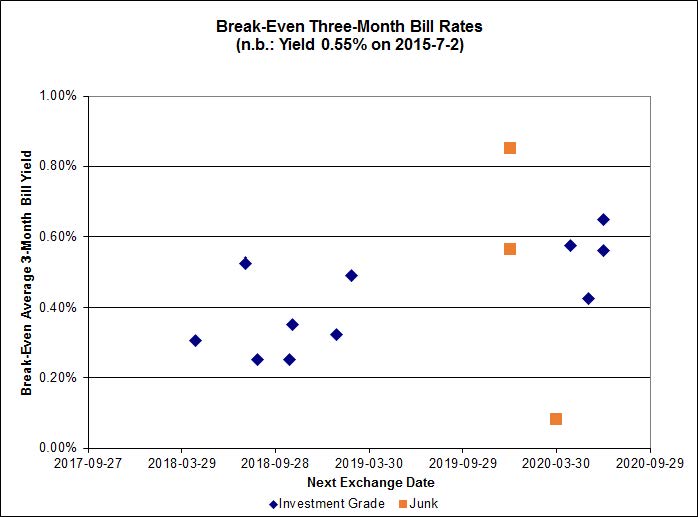
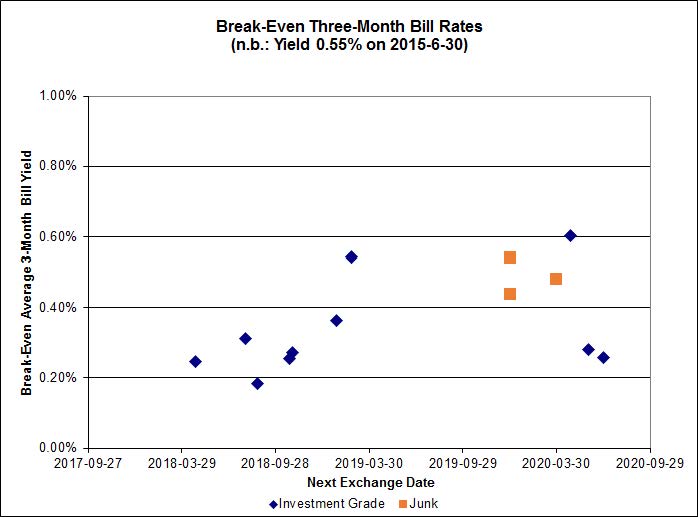
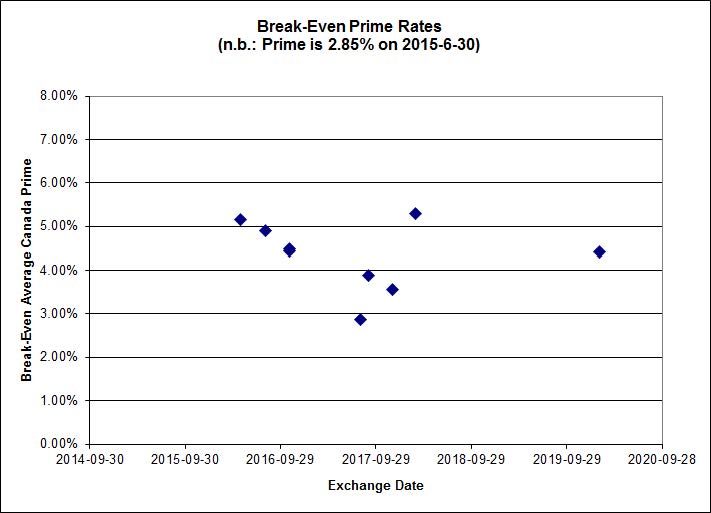
Investment-grade pairs predict an average three-month bill yield over the next five-odd years of 0.21%, including the outliers BMO.PR.M / BMO.PR.R at -0.09%, BNS.PR.Q / BNS.PR.B at -0.24% and BNS.PR.R / BNS.PR.C at -0.12%. On the junk side, three of the six pairs are outliers, two pairs with break-even yields above 1.00%, and one below 0.00%.

Click for Big
Shall we just say that this exhibits a high level of confidence in the continued rapacity of Canadian banks?
| HIMIPref™ Preferred Indices These values reflect the December 2008 revision of the HIMIPref™ Indices Values are provisional and are finalized monthly |
|||||||
| Index | Mean Current Yield (at bid) |
Median YTW |
Median Average Trading Value |
Median Mod Dur (YTW) |
Issues | Day’s Perf. | Index Value |
| Ratchet | 0.00 % | 0.00 % | 0 | 0.00 | 0 | -2.9538 % | 2,108.7 |
| FixedFloater | 0.00 % | 0.00 % | 0 | 0.00 | 0 | -2.9538 % | 3,687.0 |
| Floater | 3.67 % | 3.71 % | 59,105 | 18.07 | 3 | -2.9538 % | 2,241.7 |
| OpRet | 0.00 % | 0.00 % | 0 | 0.00 | 0 | -0.7777 % | 2,748.8 |
| SplitShare | 4.63 % | 5.10 % | 67,011 | 3.22 | 3 | -0.7777 % | 3,221.4 |
| Interest-Bearing | 0.00 % | 0.00 % | 0 | 0.00 | 0 | -0.7777 % | 2,513.5 |
| Perpetual-Premium | 5.50 % | 3.71 % | 66,921 | 0.08 | 13 | 0.0185 % | 2,520.1 |
| Perpetual-Discount | 5.35 % | 5.37 % | 92,460 | 14.89 | 21 | -0.4596 % | 2,679.6 |
| FixedReset | 4.62 % | 3.73 % | 217,199 | 16.13 | 88 | -1.7053 % | 2,278.1 |
| Deemed-Retractible | 5.00 % | 3.11 % | 107,173 | 0.79 | 34 | -0.0999 % | 2,632.1 |
| FloatingReset | 2.49 % | 2.99 % | 53,571 | 6.08 | 10 | 0.1212 % | 2,308.3 |
| Performance Highlights | |||
| Issue | Index | Change | Notes |
| FTS.PR.M | FixedReset | -7.17 % | Very misleading, as the low for the day was 23.01 on volume of 70,503 shares, so this is just more Toronto Stock Exchange nonsense. I have not checked whether this is due to inadequate Toronto Stock Exchange reporting or inadequate Toronto Stock Exchange supervision of market-makers. YTW SCENARIO Maturity Type : Limit Maturity Maturity Date : 2045-07-08 Maturity Price : 21.66 Evaluated at bid price : 22.00 Bid-YTW : 3.91 % |
| ENB.PR.B | FixedReset | -5.07 % | This one, on the other hand, is quite real: the last twenty-five trades of the day (commencing at 3:43pm) were below 16.60 and it touched 16.47 at one point. YTW SCENARIO Maturity Type : Limit Maturity Maturity Date : 2045-07-08 Maturity Price : 16.47 Evaluated at bid price : 16.47 Bid-YTW : 5.00 % |
| ENB.PF.A | FixedReset | -4.86 % | YTW SCENARIO Maturity Type : Limit Maturity Maturity Date : 2045-07-08 Maturity Price : 18.60 Evaluated at bid price : 18.60 Bid-YTW : 4.98 % |
| MFC.PR.M | FixedReset | -4.34 % | YTW SCENARIO Maturity Type : Hard Maturity Maturity Date : 2025-01-31 Maturity Price : 25.00 Evaluated at bid price : 22.05 Bid-YTW : 5.14 % |
| ENB.PF.G | FixedReset | -4.33 % | YTW SCENARIO Maturity Type : Limit Maturity Maturity Date : 2045-07-08 Maturity Price : 18.80 Evaluated at bid price : 18.80 Bid-YTW : 5.00 % |
| BMO.PR.W | FixedReset | -4.29 % | YTW SCENARIO Maturity Type : Limit Maturity Maturity Date : 2045-07-08 Maturity Price : 21.41 Evaluated at bid price : 21.41 Bid-YTW : 3.73 % |
| ENB.PR.D | FixedReset | -4.25 % | YTW SCENARIO Maturity Type : Limit Maturity Maturity Date : 2045-07-08 Maturity Price : 16.90 Evaluated at bid price : 16.90 Bid-YTW : 4.88 % |
| ENB.PR.J | FixedReset | -4.14 % | YTW SCENARIO Maturity Type : Limit Maturity Maturity Date : 2045-07-08 Maturity Price : 18.31 Evaluated at bid price : 18.31 Bid-YTW : 4.91 % |
| ENB.PR.F | FixedReset | -4.01 % | YTW SCENARIO Maturity Type : Limit Maturity Maturity Date : 2045-07-08 Maturity Price : 17.22 Evaluated at bid price : 17.22 Bid-YTW : 4.98 % |
| BMO.PR.S | FixedReset | -3.97 % | YTW SCENARIO Maturity Type : Limit Maturity Maturity Date : 2045-07-08 Maturity Price : 21.87 Evaluated at bid price : 22.25 Bid-YTW : 3.68 % |
| BAM.PR.T | FixedReset | -3.91 % | YTW SCENARIO Maturity Type : Limit Maturity Maturity Date : 2045-07-08 Maturity Price : 19.42 Evaluated at bid price : 19.42 Bid-YTW : 4.16 % |
| ENB.PF.E | FixedReset | -3.90 % | YTW SCENARIO Maturity Type : Limit Maturity Maturity Date : 2045-07-08 Maturity Price : 18.75 Evaluated at bid price : 18.75 Bid-YTW : 4.98 % |
| ENB.PR.T | FixedReset | -3.73 % | YTW SCENARIO Maturity Type : Limit Maturity Maturity Date : 2045-07-08 Maturity Price : 17.81 Evaluated at bid price : 17.81 Bid-YTW : 4.86 % |
| BMO.PR.T | FixedReset | -3.71 % | YTW SCENARIO Maturity Type : Limit Maturity Maturity Date : 2045-07-08 Maturity Price : 21.51 Evaluated at bid price : 21.78 Bid-YTW : 3.67 % |
| ENB.PF.C | FixedReset | -3.71 % | YTW SCENARIO Maturity Type : Limit Maturity Maturity Date : 2045-07-08 Maturity Price : 18.70 Evaluated at bid price : 18.70 Bid-YTW : 4.95 % |
| TD.PF.B | FixedReset | -3.61 % | YTW SCENARIO Maturity Type : Limit Maturity Maturity Date : 2045-07-08 Maturity Price : 21.59 Evaluated at bid price : 21.87 Bid-YTW : 3.61 % |
| CM.PR.P | FixedReset | -3.55 % | YTW SCENARIO Maturity Type : Limit Maturity Maturity Date : 2045-07-08 Maturity Price : 21.46 Evaluated at bid price : 21.46 Bid-YTW : 3.70 % |
| MFC.PR.L | FixedReset | -3.51 % | YTW SCENARIO Maturity Type : Hard Maturity Maturity Date : 2025-01-31 Maturity Price : 25.00 Evaluated at bid price : 21.45 Bid-YTW : 5.33 % |
| BIP.PR.A | FixedReset | -3.48 % | YTW SCENARIO Maturity Type : Limit Maturity Maturity Date : 2045-07-08 Maturity Price : 22.12 Evaluated at bid price : 22.73 Bid-YTW : 4.80 % |
| BAM.PR.B | Floater | -3.43 % | YTW SCENARIO Maturity Type : Limit Maturity Maturity Date : 2045-07-08 Maturity Price : 13.79 Evaluated at bid price : 13.79 Bid-YTW : 3.64 % |
| MFC.PR.N | FixedReset | -3.40 % | YTW SCENARIO Maturity Type : Hard Maturity Maturity Date : 2025-01-31 Maturity Price : 25.00 Evaluated at bid price : 21.91 Bid-YTW : 5.16 % |
| CM.PR.O | FixedReset | -3.30 % | YTW SCENARIO Maturity Type : Limit Maturity Maturity Date : 2045-07-08 Maturity Price : 21.68 Evaluated at bid price : 22.00 Bid-YTW : 3.67 % |
| ENB.PR.H | FixedReset | -3.29 % | YTW SCENARIO Maturity Type : Limit Maturity Maturity Date : 2045-07-08 Maturity Price : 16.15 Evaluated at bid price : 16.15 Bid-YTW : 4.82 % |
| MFC.PR.K | FixedReset | -3.28 % | YTW SCENARIO Maturity Type : Hard Maturity Maturity Date : 2025-01-31 Maturity Price : 25.00 Evaluated at bid price : 21.50 Bid-YTW : 5.21 % |
| BAM.PR.R | FixedReset | -3.16 % | YTW SCENARIO Maturity Type : Limit Maturity Maturity Date : 2045-07-08 Maturity Price : 18.70 Evaluated at bid price : 18.70 Bid-YTW : 4.25 % |
| TD.PF.C | FixedReset | -3.02 % | YTW SCENARIO Maturity Type : Limit Maturity Maturity Date : 2045-07-08 Maturity Price : 21.55 Evaluated at bid price : 21.55 Bid-YTW : 3.68 % |
| RY.PR.H | FixedReset | -2.94 % | YTW SCENARIO Maturity Type : Limit Maturity Maturity Date : 2045-07-08 Maturity Price : 21.76 Evaluated at bid price : 22.11 Bid-YTW : 3.63 % |
| TRP.PR.C | FixedReset | -2.89 % | YTW SCENARIO Maturity Type : Limit Maturity Maturity Date : 2045-07-08 Maturity Price : 15.80 Evaluated at bid price : 15.80 Bid-YTW : 3.70 % |
| BAM.PR.C | Floater | -2.89 % | YTW SCENARIO Maturity Type : Limit Maturity Maturity Date : 2045-07-08 Maturity Price : 13.45 Evaluated at bid price : 13.45 Bid-YTW : 3.73 % |
| NA.PR.W | FixedReset | -2.65 % | YTW SCENARIO Maturity Type : Limit Maturity Maturity Date : 2045-07-08 Maturity Price : 21.65 Evaluated at bid price : 22.00 Bid-YTW : 3.61 % |
| TRP.PR.D | FixedReset | -2.61 % | YTW SCENARIO Maturity Type : Limit Maturity Maturity Date : 2045-07-08 Maturity Price : 21.30 Evaluated at bid price : 21.30 Bid-YTW : 3.88 % |
| ENB.PR.P | FixedReset | -2.57 % | YTW SCENARIO Maturity Type : Limit Maturity Maturity Date : 2045-07-08 Maturity Price : 17.81 Evaluated at bid price : 17.81 Bid-YTW : 4.85 % |
| BAM.PR.K | Floater | -2.53 % | YTW SCENARIO Maturity Type : Limit Maturity Maturity Date : 2045-07-08 Maturity Price : 13.50 Evaluated at bid price : 13.50 Bid-YTW : 3.71 % |
| BNS.PR.Z | FixedReset | -2.52 % | YTW SCENARIO Maturity Type : Hard Maturity Maturity Date : 2022-01-31 Maturity Price : 25.00 Evaluated at bid price : 22.81 Bid-YTW : 3.80 % |
| ENB.PR.N | FixedReset | -2.48 % | YTW SCENARIO Maturity Type : Limit Maturity Maturity Date : 2045-07-08 Maturity Price : 18.45 Evaluated at bid price : 18.45 Bid-YTW : 4.83 % |
| BAM.PR.X | FixedReset | -2.41 % | YTW SCENARIO Maturity Type : Limit Maturity Maturity Date : 2045-07-08 Maturity Price : 17.00 Evaluated at bid price : 17.00 Bid-YTW : 4.08 % |
| BAM.PF.B | FixedReset | -2.40 % | YTW SCENARIO Maturity Type : Limit Maturity Maturity Date : 2045-07-08 Maturity Price : 20.71 Evaluated at bid price : 20.71 Bid-YTW : 4.32 % |
| PWF.PR.S | Perpetual-Discount | -2.38 % | YTW SCENARIO Maturity Type : Limit Maturity Maturity Date : 2045-07-08 Maturity Price : 23.18 Evaluated at bid price : 23.52 Bid-YTW : 5.09 % |
| BAM.PF.C | Perpetual-Discount | -2.31 % | YTW SCENARIO Maturity Type : Limit Maturity Maturity Date : 2045-07-08 Maturity Price : 21.10 Evaluated at bid price : 21.10 Bid-YTW : 5.80 % |
| BAM.PR.N | Perpetual-Discount | -2.12 % | YTW SCENARIO Maturity Type : Limit Maturity Maturity Date : 2045-07-08 Maturity Price : 20.80 Evaluated at bid price : 20.80 Bid-YTW : 5.76 % |
| RY.PR.Z | FixedReset | -2.11 % | YTW SCENARIO Maturity Type : Limit Maturity Maturity Date : 2045-07-08 Maturity Price : 22.18 Evaluated at bid price : 22.71 Bid-YTW : 3.48 % |
| HSE.PR.G | FixedReset | -2.09 % | YTW SCENARIO Maturity Type : Limit Maturity Maturity Date : 2045-07-08 Maturity Price : 22.73 Evaluated at bid price : 23.90 Bid-YTW : 4.53 % |
| PVS.PR.B | SplitShare | -2.08 % | YTW SCENARIO Maturity Type : Hard Maturity Maturity Date : 2019-01-10 Maturity Price : 25.00 Evaluated at bid price : 24.52 Bid-YTW : 5.10 % |
| BAM.PF.D | Perpetual-Discount | -2.06 % | YTW SCENARIO Maturity Type : Limit Maturity Maturity Date : 2045-07-08 Maturity Price : 21.44 Evaluated at bid price : 21.44 Bid-YTW : 5.76 % |
| ENB.PR.Y | FixedReset | -2.03 % | YTW SCENARIO Maturity Type : Limit Maturity Maturity Date : 2045-07-08 Maturity Price : 17.40 Evaluated at bid price : 17.40 Bid-YTW : 4.85 % |
| HSE.PR.E | FixedReset | -2.00 % | YTW SCENARIO Maturity Type : Limit Maturity Maturity Date : 2045-07-08 Maturity Price : 22.79 Evaluated at bid price : 24.00 Bid-YTW : 4.51 % |
| BAM.PF.A | FixedReset | -1.98 % | YTW SCENARIO Maturity Type : Limit Maturity Maturity Date : 2045-07-08 Maturity Price : 21.97 Evaluated at bid price : 22.32 Bid-YTW : 4.26 % |
| TD.PF.A | FixedReset | -1.96 % | YTW SCENARIO Maturity Type : Limit Maturity Maturity Date : 2045-07-08 Maturity Price : 21.70 Evaluated at bid price : 22.05 Bid-YTW : 3.59 % |
| TRP.PR.A | FixedReset | -1.95 % | YTW SCENARIO Maturity Type : Limit Maturity Maturity Date : 2045-07-08 Maturity Price : 19.60 Evaluated at bid price : 19.60 Bid-YTW : 3.61 % |
| TRP.PR.E | FixedReset | -1.81 % | YTW SCENARIO Maturity Type : Limit Maturity Maturity Date : 2045-07-08 Maturity Price : 21.37 Evaluated at bid price : 21.68 Bid-YTW : 3.84 % |
| FTS.PR.K | FixedReset | -1.45 % | YTW SCENARIO Maturity Type : Limit Maturity Maturity Date : 2045-07-08 Maturity Price : 21.03 Evaluated at bid price : 21.03 Bid-YTW : 3.63 % |
| BAM.PR.M | Perpetual-Discount | -1.42 % | YTW SCENARIO Maturity Type : Limit Maturity Maturity Date : 2045-07-08 Maturity Price : 20.85 Evaluated at bid price : 20.85 Bid-YTW : 5.74 % |
| HSE.PR.C | FixedReset | -1.35 % | YTW SCENARIO Maturity Type : Limit Maturity Maturity Date : 2045-07-08 Maturity Price : 22.47 Evaluated at bid price : 23.30 Bid-YTW : 4.30 % |
| BNS.PR.Y | FixedReset | -1.32 % | YTW SCENARIO Maturity Type : Hard Maturity Maturity Date : 2022-01-31 Maturity Price : 25.00 Evaluated at bid price : 22.50 Bid-YTW : 3.51 % |
| TRP.PR.B | FixedReset | -1.21 % | YTW SCENARIO Maturity Type : Limit Maturity Maturity Date : 2045-07-08 Maturity Price : 14.70 Evaluated at bid price : 14.70 Bid-YTW : 3.53 % |
| BMO.PR.Q | FixedReset | -1.18 % | YTW SCENARIO Maturity Type : Hard Maturity Maturity Date : 2022-01-31 Maturity Price : 25.00 Evaluated at bid price : 23.50 Bid-YTW : 3.37 % |
| MFC.PR.C | Deemed-Retractible | -1.17 % | YTW SCENARIO Maturity Type : Hard Maturity Maturity Date : 2025-01-31 Maturity Price : 25.00 Evaluated at bid price : 22.73 Bid-YTW : 5.81 % |
| IFC.PR.C | FixedReset | -1.10 % | YTW SCENARIO Maturity Type : Hard Maturity Maturity Date : 2025-01-31 Maturity Price : 25.00 Evaluated at bid price : 22.50 Bid-YTW : 4.88 % |
| SLF.PR.A | Deemed-Retractible | -1.05 % | YTW SCENARIO Maturity Type : Hard Maturity Maturity Date : 2025-01-31 Maturity Price : 25.00 Evaluated at bid price : 23.67 Bid-YTW : 5.52 % |
| MFC.PR.F | FixedReset | -1.04 % | YTW SCENARIO Maturity Type : Hard Maturity Maturity Date : 2025-01-31 Maturity Price : 25.00 Evaluated at bid price : 17.11 Bid-YTW : 7.02 % |
| MFC.PR.I | FixedReset | -1.03 % | YTW SCENARIO Maturity Type : Hard Maturity Maturity Date : 2025-01-31 Maturity Price : 25.00 Evaluated at bid price : 25.10 Bid-YTW : 3.81 % |
| BAM.PF.G | FixedReset | -1.02 % | YTW SCENARIO Maturity Type : Limit Maturity Maturity Date : 2045-07-08 Maturity Price : 22.39 Evaluated at bid price : 23.21 Bid-YTW : 4.08 % |
| SLF.PR.G | FixedReset | 1.84 % | YTW SCENARIO Maturity Type : Hard Maturity Maturity Date : 2025-01-31 Maturity Price : 25.00 Evaluated at bid price : 16.59 Bid-YTW : 7.18 % |
| TRP.PR.H | FloatingReset | 7.17 % | Basically a reversal of yesterday‘s nonsense. YTW SCENARIO Maturity Type : Limit Maturity Maturity Date : 2045-07-08 Maturity Price : 14.20 Evaluated at bid price : 14.20 Bid-YTW : 3.19 % |
| Volume Highlights | |||
| Issue | Index | Shares Traded |
Notes |
| ENB.PR.N | FixedReset | 169,275 | YTW SCENARIO Maturity Type : Limit Maturity Maturity Date : 2045-07-08 Maturity Price : 18.45 Evaluated at bid price : 18.45 Bid-YTW : 4.83 % |
| BNS.PR.L | Deemed-Retractible | 87,850 | YTW SCENARIO Maturity Type : Call Maturity Date : 2016-04-27 Maturity Price : 25.00 Evaluated at bid price : 25.20 Bid-YTW : 3.11 % |
| TRP.PR.D | FixedReset | 86,567 | YTW SCENARIO Maturity Type : Limit Maturity Maturity Date : 2045-07-08 Maturity Price : 21.30 Evaluated at bid price : 21.30 Bid-YTW : 3.88 % |
| RY.PR.C | Deemed-Retractible | 81,469 | YTW SCENARIO Maturity Type : Call Maturity Date : 2015-11-24 Maturity Price : 25.00 Evaluated at bid price : 25.30 Bid-YTW : 2.91 % |
| CU.PR.C | FixedReset | 72,954 | YTW SCENARIO Maturity Type : Limit Maturity Maturity Date : 2045-07-08 Maturity Price : 23.85 Evaluated at bid price : 24.17 Bid-YTW : 3.35 % |
| ENB.PR.F | FixedReset | 64,324 | YTW SCENARIO Maturity Type : Limit Maturity Maturity Date : 2045-07-08 Maturity Price : 17.22 Evaluated at bid price : 17.22 Bid-YTW : 4.98 % |
| There were 66 other index-included issues trading in excess of 10,000 shares. | |||
| Wide Spread Highlights | ||
| Issue | Index | Quote Data and Yield Notes |
| FTS.PR.M | FixedReset | Quote: 22.00 – 23.70 Spot Rate : 1.7000 Average : 1.0370 YTW SCENARIO |
| RY.PR.H | FixedReset | Quote: 22.11 – 22.85 Spot Rate : 0.7400 Average : 0.4450 YTW SCENARIO |
| BAM.PF.G | FixedReset | Quote: 23.21 – 23.64 Spot Rate : 0.4300 Average : 0.2869 YTW SCENARIO |
| ENB.PR.F | FixedReset | Quote: 17.22 – 17.73 Spot Rate : 0.5100 Average : 0.3695 YTW SCENARIO |
| HSE.PR.G | FixedReset | Quote: 23.90 – 24.29 Spot Rate : 0.3900 Average : 0.2501 YTW SCENARIO |
| GWO.PR.H | Deemed-Retractible | Quote: 23.80 – 24.23 Spot Rate : 0.4300 Average : 0.2903 YTW SCENARIO |