Walmart’s run into a little labour trouble after raising their in-house minimum wage because the tier above wants to keep their increment:
When Wal-Mart Stores Inc. chief Doug McMillon announced plans to boost store workers’ minimum wage earlier this year, he said the move was intended to improve morale and retain employees.
Yet for some of the hundreds of thousands of workers getting no raise, the policy is having the opposite effect.
In interviews and in hundreds of comments on Facebook, Wal-Mart employees are calling the move unfair to senior workers who got no increase and now make the same or close to what newer, less experienced colleagues earn. New workers started making a minimum of $9 an hour in April and will get at least $10 an hour in February.
“It is pitting people against each other,” said Charmaine Givens-Thomas, a 10-year veteran who makes $12 an hour at a store near Chicago and belongs to OUR Walmart, a union-backed group that has lobbied for better working conditions. “It hurts morale when people feel like they aren’t being appreciated. I hear people every day talking about looking for other jobs and wanting to remove themselves from Wal-Mart and a job that will make them feel like that.”
And, perhaps not very coincidentally, there are murmurings of disquiet about a US national $15 minimum wage:
As the proposed federal minimum wage goes up and up, economists support it less and less. In January 2014, seven Nobel laureates and eight ex-presidents of the American Economic Association signed a letter backing a federal minimum wage of $10.10 an hour by 2016, up from $7.25. They said it would “provide a much-needed boost” to low-income workers while causing “little or no” job loss. Fifteen dollars an hour is another story. None of those luminaries signed the letter in July that endorsed a Senate bill introduced by presidential candidate Bernie Sanders (D-Vt.) to raise the federal minimum to $15 an hour by 2020.
Regional economic differences are one reason a lot of economists are nervous about jumping to $15: A wage floor that’s right for New York or San Francisco could be too high for Brownsville, Texas; Gadsden, Ala.; or Ponce, Puerto Rico. In such places, $15 an hour “may have large negative employment effects,” Ronald Ehrenberg, a Cornell University labor economist, wrote in an e-mail. He was one of about 600 economists who signed the $10.10 letter last year. He says he wasn’t approached to sign the $15 letter but would have said no if asked.
…
A $15 minimum is just 67 percent of the median wage in high-cost Alaska, so it would have a modest effect if implemented today, lifting pay of people at the bottom but not affecting the middle rungs of the income ladder. In Puerto Rico, though, $15 is 155 percent of the median wage. If the federal minimum were raised to $15 today (rather than in 2020, as Sanders proposes), it would be 55 percent higher than the midpoint of what all Puerto Ricans earn. That would cause severe stress in a financially struggling territory already squeezed by the $7.25 minimum. Even within a single state, it’s hard to come up with a minimum that works everywhere. In California, the median wage varies from more than $28 an hour in Silicon Valley (technically San Benito and Santa Clara counties) to less than $14 in Visalia-Porterville, a farm town 190 miles away by car.
A portion of the justification cited in the Bernie Saunders endorsement letter is the 50-year trend in productivity:
The real, inflation-adjusted, value of the federal minimum wage has fallen dramatically over time. The real value of the federal minimum wage peaked in 1968 at 10.85 an hour, 50 percent above the current level. Moreover, since 1968, average U.S. labor productivity has risen by roughly 140 percent. This means that, if the federal minimum wage had risen in step with both inflation and average labor productivity since 1968, the federal minimum wage today would be $26.00 an hour. (References for all data cited in this petition can be found here: LINK)
So we can take a look at the link and see how their productivity increase was derived:
Labor productivity over time is measured by the BLS Labor Productivity and Costs program (LPC). The specific index used here is for the Business Sector. The index value (base year=2009) in 1968 is 43.503 and 105.998 for 2014, indicating a 143 percent increase in productivity (105.998 /43.503).
They didn’t go into any more detail than that, so we’ll ask FRED and see what the inflation-adjusted minimum wage looks like:

Click for Big
So the real minimum wage in the States is currently at its 1950 value and has been for the last twenty-five years. There was a significant peak in 1968, as the endorsement letter writers state; I assume this is because all the kids were hippies then (LAZY, SMELLY hippies) or were in Vietnam. But I will leave that to historians and content myself with pointing out that the selection of a starting point for their claim is not representative of long-term conditions.
It’s much the same in Ontario Livio Di Matteo on the Worthwhile Canadian Initiative blog:
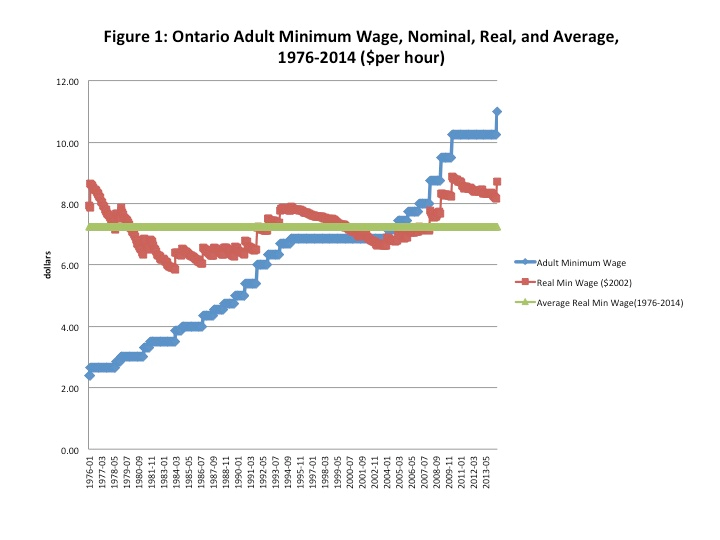
Click for Big
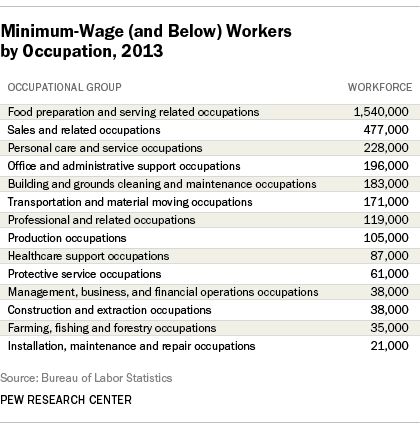
But the other thing they’re doing is sticking productivity into the mix as well. Now, according to the Pew Research Center:
According to the Bureau of Labor Statistics, last year 1.532 million hourly workers earned the federal minimum of $7.25 an hour; nearly 1.8 million more earned less than that because they fell under one of several exemptions (tipped employees, full-time students, certain disabled workers and others), for a total of 3.3 million hourly workers at or below the federal minimum.
That group represents 4.3% of the nation’s 75.9 million hourly-paid workers and 2.6% of all wage and salary workers. In 1979, when the BLS began regularly studying minimum-wage workers, they represented 13.4% of hourly workers and 7.9% of all wage and salary workers. (Bear in mind that the 3.3 million figure doesn’t include salaried workers, although BLS says relatively few salaried workers are paid at what would translate into below-minimum hourly rates. Also, 23 states, as well as the District of Columbia, have higher minimum wages than the federal standard; people who earned the state minimum wage in those jurisdictions aren’t included in the 3.3 million total.)
… and …
Click for Big
So – freely interpreting here – minimum wage earners are potato peelers, pizza makers, waitresses, store cashiers, manicurists, office cleaners and gardeners.
And my point is: how has the productivity of employees in these occupations increased over the last fifty years? There may have been some marginal improvement – gardeners can now use leaf-blowers and make far louder noises than they used to – but I’ll suggest that, by and large, the productivity in these occupations has not moved much and certainly has not increased by the 143% figure used to derive the justification for the $26.00 figure given in the Sanders endorsement letter.
In fact, I’ll go further and suggest that the uneven distribution of productivity gains over the past fifty years is what is causing income inequality in the first place. Or at least a chunk of it, the chunk that you see when you work at McDonalds and the guy across the street is a systems administrator for a medium sized company.
Now don’t get me wrong! I support an increased minimum wage and I would even like it to be indexed not to inflation, but to inflation +50bp (say), so that we can increase the incentive to modernize all these marginal jobs. If we want to redistribute the fruits of productivity gains – and I will not dismiss the idea outright – that is something we should be doing through the tax system, in what is usually referred to as a guaranteed annual income:
According to several Queen’s University professors, the cost of replacing social assistance (which includes welfare and disability support) and Old Age Security (which includes a top-up for low-income seniors), plus providing every adult with an annual income of $20,000 and children with an income guarantee of $6,000, would be $40-billion. The Fraser Institute calculates the total cost of Canada’s current income support system (payout plus administrative costs) at $185-billion in 2013.
Our own estimates, which build on existing social programs, range from a gross annual cost of $17-billion for a program that (in today’s dollars) is slightly more generous than was offered in Dauphin, to a “Cadillac” version costing $58-billion that would guarantee everyone a minimum income equal to the low-income cutoff and pay at least some benefits to people earning well above the low-income cutoff.
The cost of a GAI depends on how generous it is, how quickly benefits are phased out with additional income and how existing social programs are affected.
Sadly, however, the political trend is in the other direction – with some idiots touting narrowly targeted tax credits in order to create jobs for tax lawyers and CRA auditors, while other idiots tout means-tested benefits in order to impose ludicrous effective marginal tax rates on recipients to ensure they remain dependent and don’t get uppity. I’m sure I’ve discussed means-testing of benefits and marginal tax rates on PrefBlog, and referred to a Congressional Budget Office study on the matter, but can’t find the reference! [Update: try Illustrative Examples of Effective Marginal Tax Rates Faced by Married and Single Taxpayers: Supplemental Material for Effective Marginal Tax Rates for Low- and Moderate-Income Workers, which isn’t exactly the one I remember, but it’s close!]
Meanwhile, cord-cutters are cutting prices:
Cord-cutting millennials who shun cable TV have long plagued the entertainment industry. Now they’re wreaking havoc on Wall Street.
Media companies led by Walt Disney Co. lost more than $60 billion in market capitalization in two days on mounting evidence of shrinking demand for cable TV and networks like ESPN that make money from ads. So-called cord cutters, who quit paying for pay-TV packages of hundreds of channels and favor online streaming services like Netflix Inc., are undermining a business model that has sustained the TV industry for decades.
It took Disney, a company with a stellar record of sales and profit, to deliver the wake-up call and end Wall Street’s 6 1/2 year love affair with traditional media. Disney’s disappointing results Tuesday night led to what long-time cable analyst Craig Moffett called swift and unprecedented carnage. The S&P 500 Media Index has since dropped 11 percent — on pace to be the worst two-day slump since 2008.
… and Treasuries are jumpy:
For the past six years, a Federal Reserve rate interest-rate hike wasn’t on anyone’s radar screen. Now, even minor data points are provoking outsized reactions given a real possibility the central bank may raise rates next month for the first time in almost a decade.
The weak employment cost index report on July 31 sent Treasury 10-year yields tumbling four basis points in five minutes, more than six times the average move after the past year’s reports. On Wednesday, yields slid three basis points in 10 minutes on disappointing data on private-sector job creation, reversed course, then continued to climb after a strong reading on service-sector growth.
There was an interesting piece in the Globe regarding the potential for corporate ownership of law firms:
Australia’s Slater & Gordon Ltd. became the first law firm in the world to be listed on a stock exchange in 2007. And despite its critics, it has since been busy growing revenue at a rapid clip, gobbling up rivals at home and in Britain. It now has its eyes on Canada.
…
The concept was an issue in Law Society of Upper Canada elections earlier this year. The Ontario Trial Lawyers Association (OTLA), which represents personal injury lawyers likely to face competitive pressure if Slater & Gordon enters Canada, endorsed a list of candidates opposed to the idea. Twenty-seven of the 40 lawyers who won what are known as “bencher” seats on the law society’s governing body were OTLA-approved. A follow-up report on the idea is expected to come before the law society this fall.Proponents say allowing law firms to attract capital from non-lawyers means they can use it to expand and provide innovative new legal services, such as those offered in kiosks in department stores or via the Web. They say these new services will help deal with the “access to justice” problem, which sees many Canadians unable to afford a lawyer.
But naysayers warn the reforms would force lawyers to answer to bottom-line-focused shareholders, instead of just to their clients and the greater good. They say this would create new ethical and conflict-of-interest land mines, if the interests of a law firm’s owners and its clients clash. Critics also charge that there is no evidence these new structures help those who cannot afford a lawyer to hire one.
Of the naysayer’s points, only the second, regarding ethics and conflict-of-interest, carries much weight with me. To suggest that practitioner-owned firms think only of their clients and the greater good is to put these firms on rather a higher pedestal than I think is warranted; the third point is irrelevant because the onus is on the regulators to prove that harm is likely, rather than on innovators to prove that improvement is likely.
The Law Society of Upper Canada has published Alternative Business Structures and the Legal Profession in Ontario: A Discussion Paper in which is stated:
Legal service regulation ensures that clients have competent, independent legal representation provided with candour and confidentiality. It also protects society by ensuring that legal services are provided with fidelity to the cause of justice, the rule of law and the administration of justice. These professional values would have to be safeguarded in any move to liberalize ownership or structure including ABS.
Many of those who are sceptical of ABS express particular concern about protection of these professional values.[22] On the other hand, ABS proponents do not dismiss the importance of these professional values, but rather believe that these values can be properly protected in an ABS model.[23]
Footnote 22 refers to a paper by Nick Robinson of Harvard Law School titled When Lawyers Don’t Get All the Profits: Non-Lawyer Ownership of Legal Services, Access, and Professionalism:
With multiple countries now allowing for non-lawyer ownership of legal services, and other jurisdictions considering a similar shift, the legal profession is in the midst of a global regulatory moment. Where non-lawyer ownership has been allowed, personal injury firms have listed on stock exchanges, major insurance companies have bought law firms, and brands best known for their grocery stores have started offering legal services. Proponents argue that these developments will spur investment and innovation, promoting access to justice by making legal services more affordable and reliable. However, there has been little empirical research to test this proposition.
This article draws on case studies and quantitative data from the United Kingdom and Australia, where non-lawyer ownership has been allowed, as well as the United States – where parallels to such ownership have emerged in online and administrative law legal services. Based on this evidence, it argues that the benefits of non-lawyer ownership have been oversold with respect to access to civil legal services for poor and moderate-income populations and it identifies serious new professionalism challenges such ownership can create. While some form of non-lawyer ownership is likely to continue to spread, these conclusions cast doubt on the ability of non-lawyer ownership to substantially improve access to legal services, suggesting that alternative access strategies should be prioritized. They also point towards the need to carefully regulate non-lawyer ownership in some contexts.
Traditionally, academics have been wary that lawyers will capture the regulation of legal services, but non-lawyer ownership, which allows for others to profit from legal services as well, raises the likelihood that new actors may also capture the profession’s regulation. Given this environment, the article recommends that going forward a diverse set of stakeholders, drawing on as much empirical data as possible, develop a tailored approach to the regulation of non-lawyer ownership.
It’s an interesting debate and not much different, as far as I can tell, from the question of whether corporations should be allowed to own Portfolio Management companies. I think the disputing lawyers would be well advised to look at some of the bank-owned asset managers as a case study; I suspect that corporate ownership of law firms will lead to:
- increased access to
- plain vanilla, cookie-cutter legal advice
It was another poor day for the Canadian preferred share market, with PerpetualDiscounts down 38bp, FixedResets losing 46bp and DeemedRetractibles off 2bp. Enbridge issues were particularly notable on the unfortunate side of the lengthy Performance Highlights table. Volume was average.
For as long as the FixedReset market is so violently unsettled, I’ll keep publishing updates of the more interesting and meaningful series of FixedResets’ Implied Volatilities. This doesn’t include Enbridge because although Enbridge has a large number of issues outstanding, all of which are quite liquid, the range of Issue Reset Spreads is too small for decent conclusions. The low is 212bp (ENB.PR.H; second-lowest is ENB.PR.D at 237bp) and the high is a mere 268 for ENB.PF.G.
Remember that all rich /cheap assessments are:
» based on Implied Volatility Theory only
» are relative only to other FixedResets from the same issuer
» assume constant GOC-5 yield
» assume constant Implied Volatility
» assume constant spread
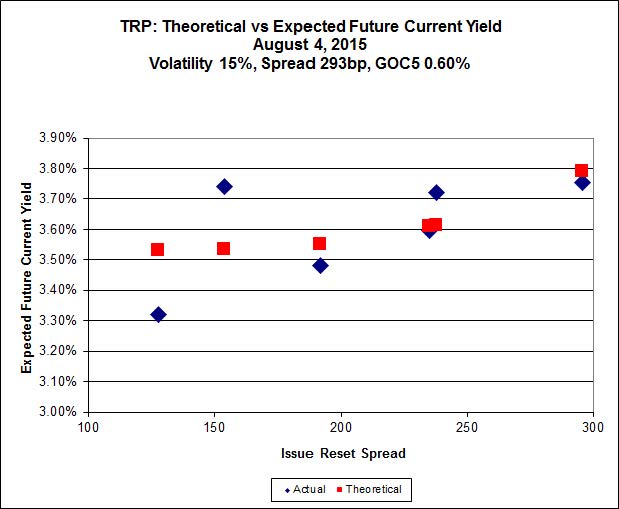
Here’s TRP:

Click for Big
TRP.PR.A, which resets 2019-12-31 at +192, is bid at 18.55 to be $0.71 rich, while TRP.PR.C, resetting 2016-1-30 at +154, is $1.17 cheap at its bid price of 14.10.
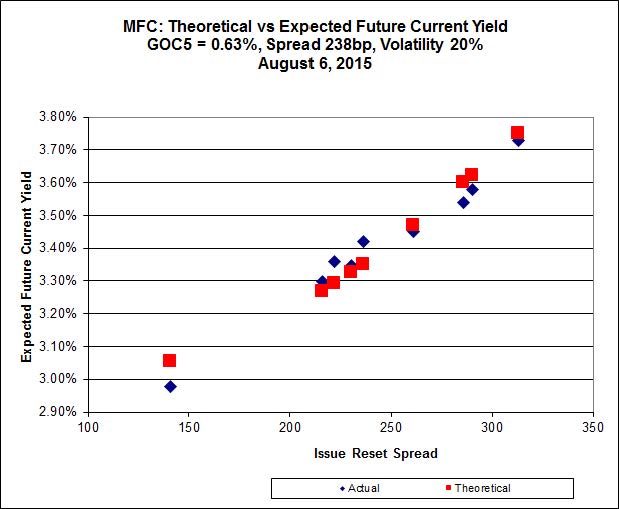
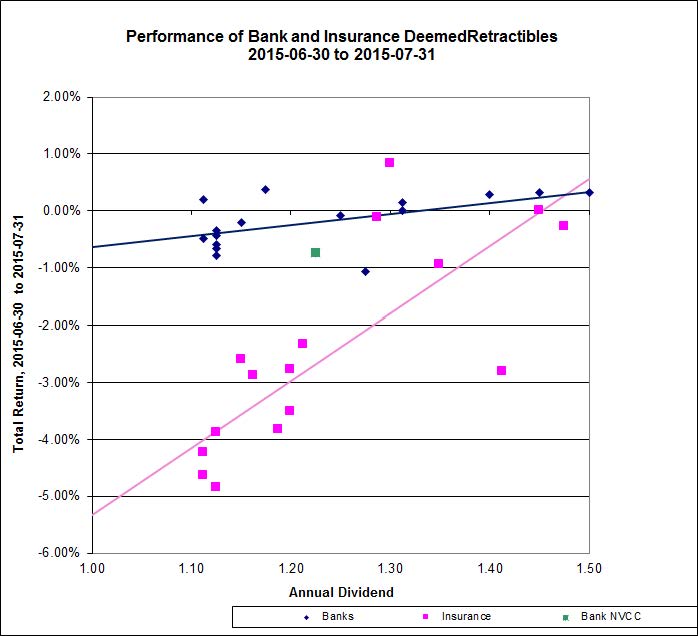
Click for Big
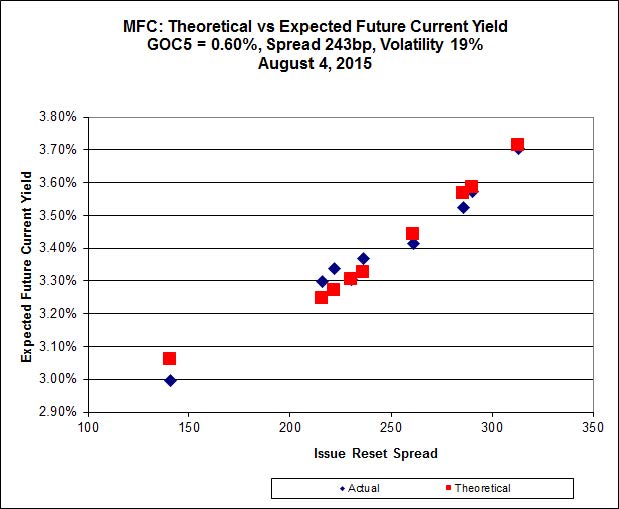
Another good fit today!
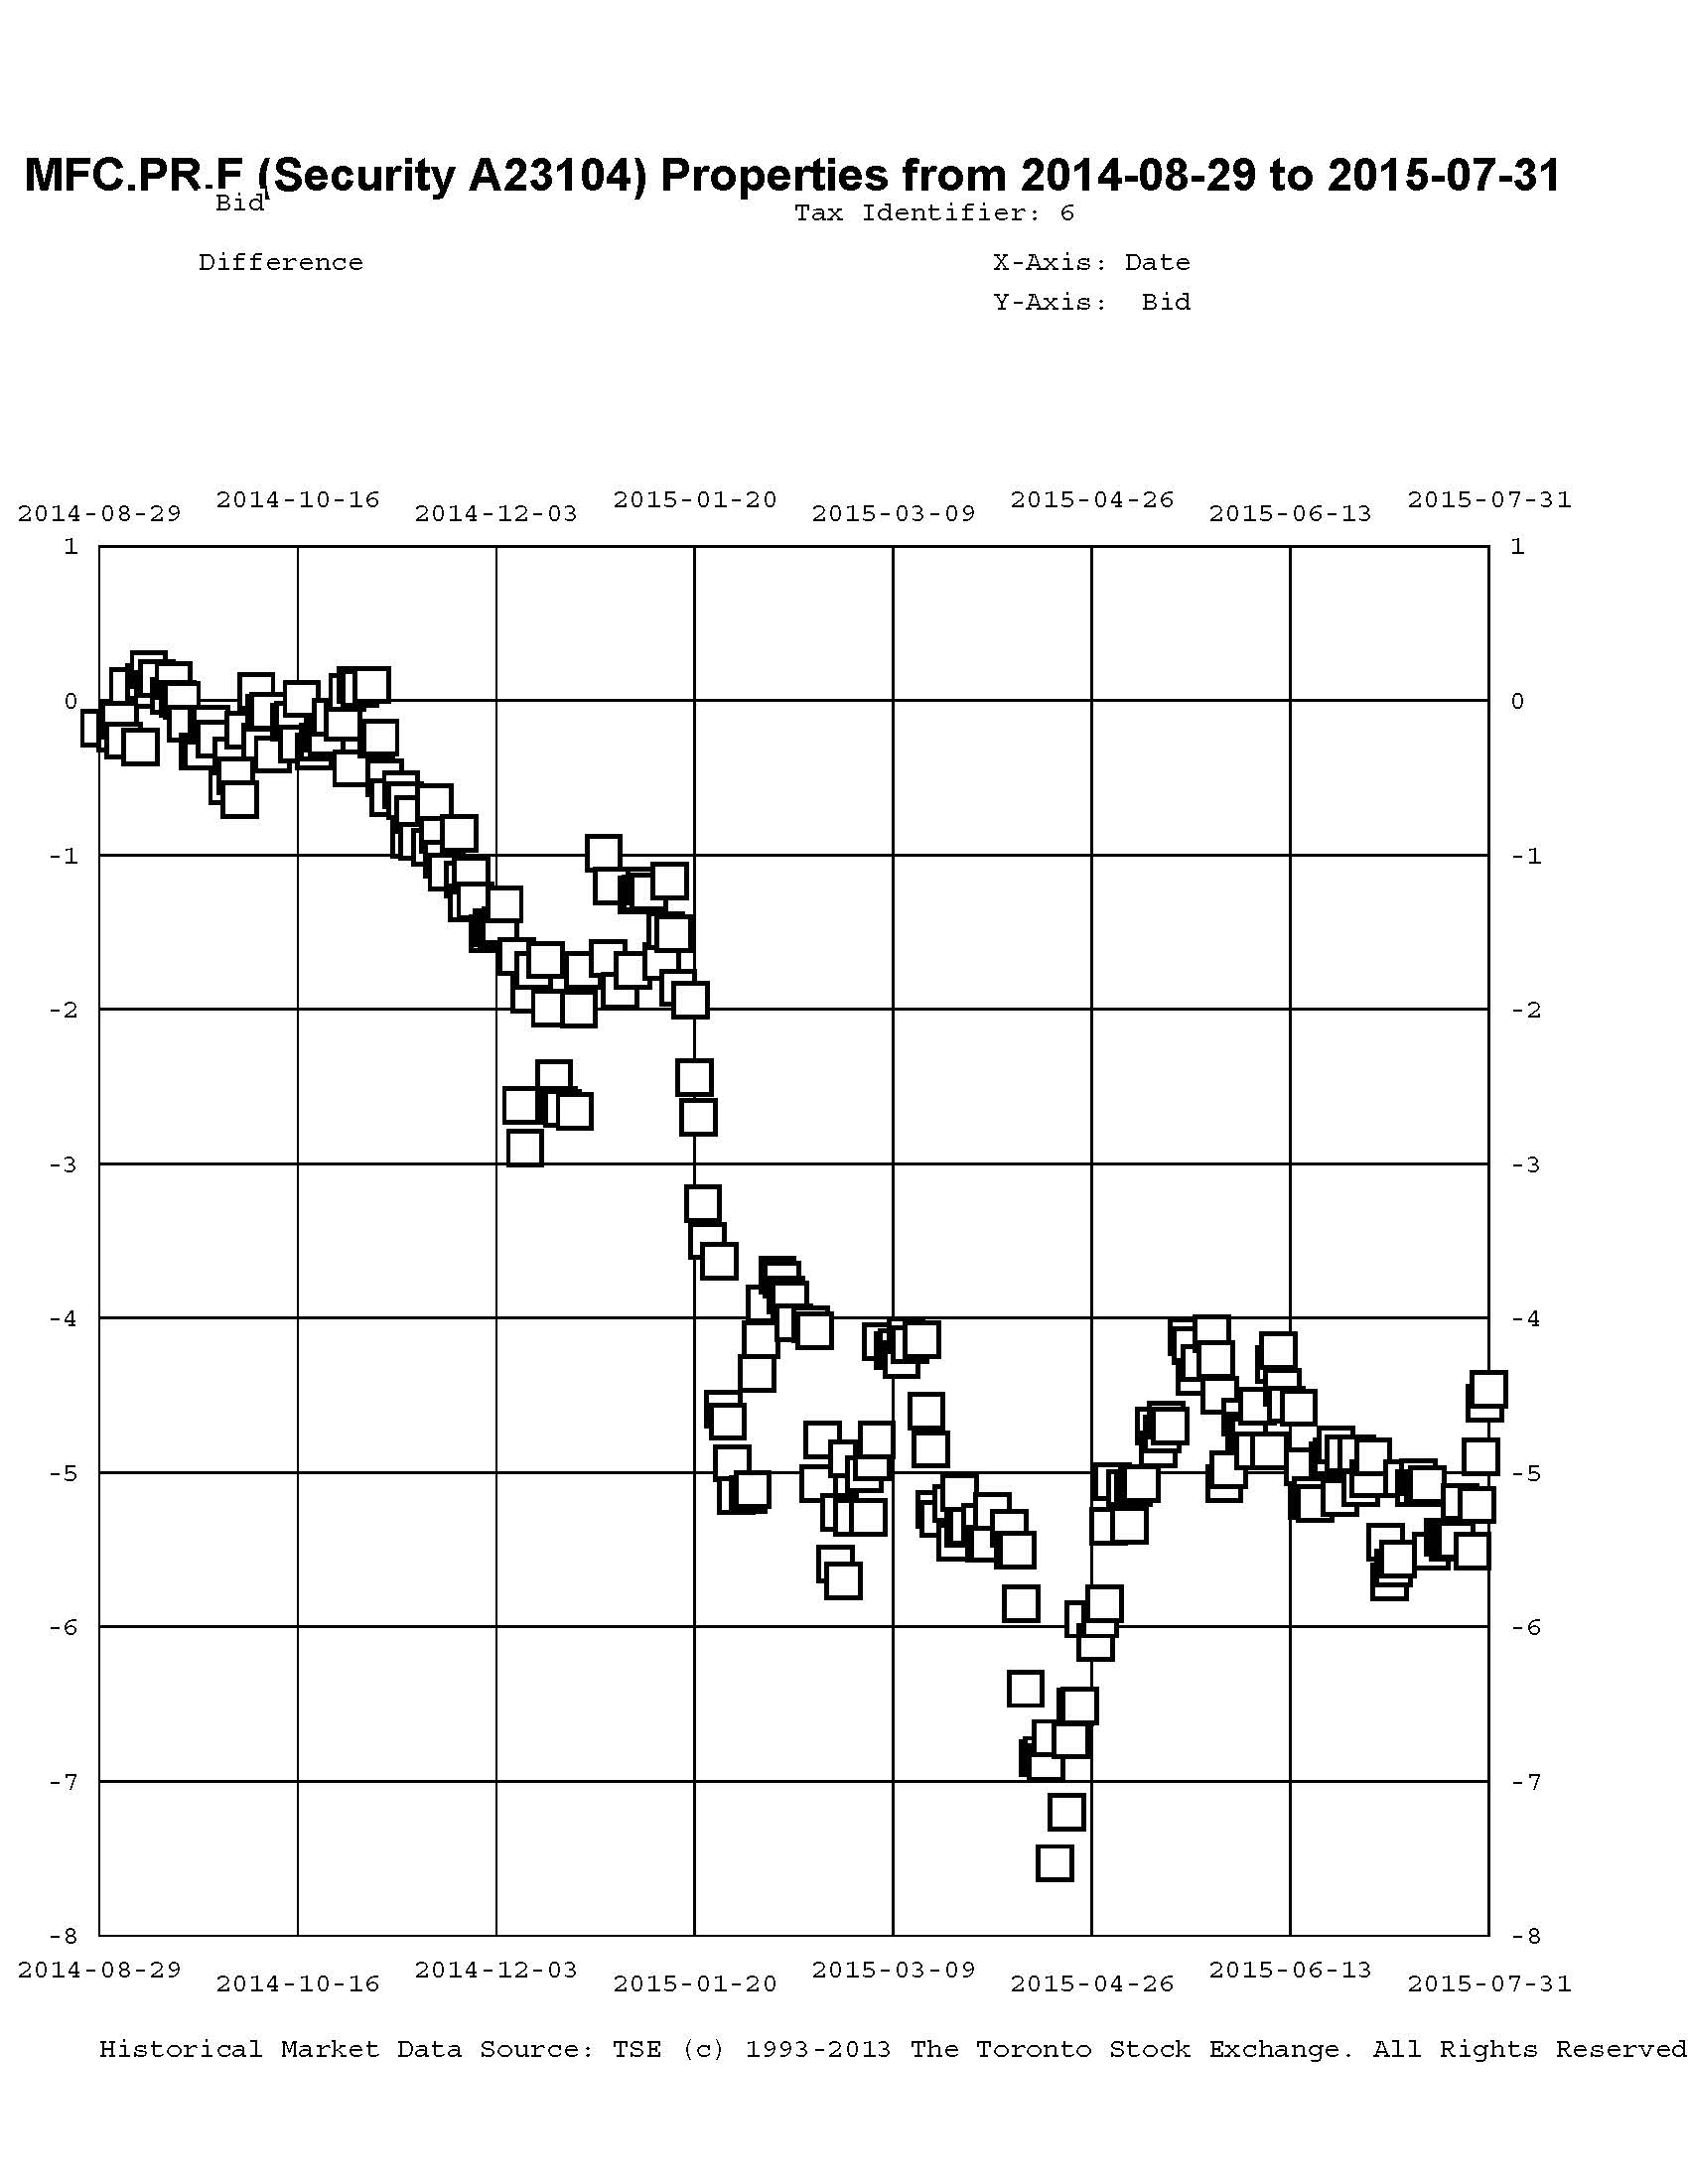
Most expensive is MFC.PR.F, resetting at +141bp on 2016-6-19, bid at 17.13 to be 0.44 rich, while MFC.PR.M, resetting at +236bp on 2019-122-19, is bid at 21.85 to be $0.46 cheap.
Click for Big
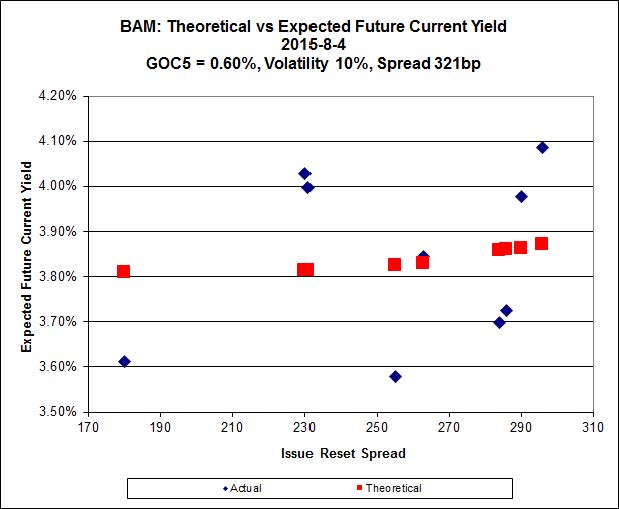
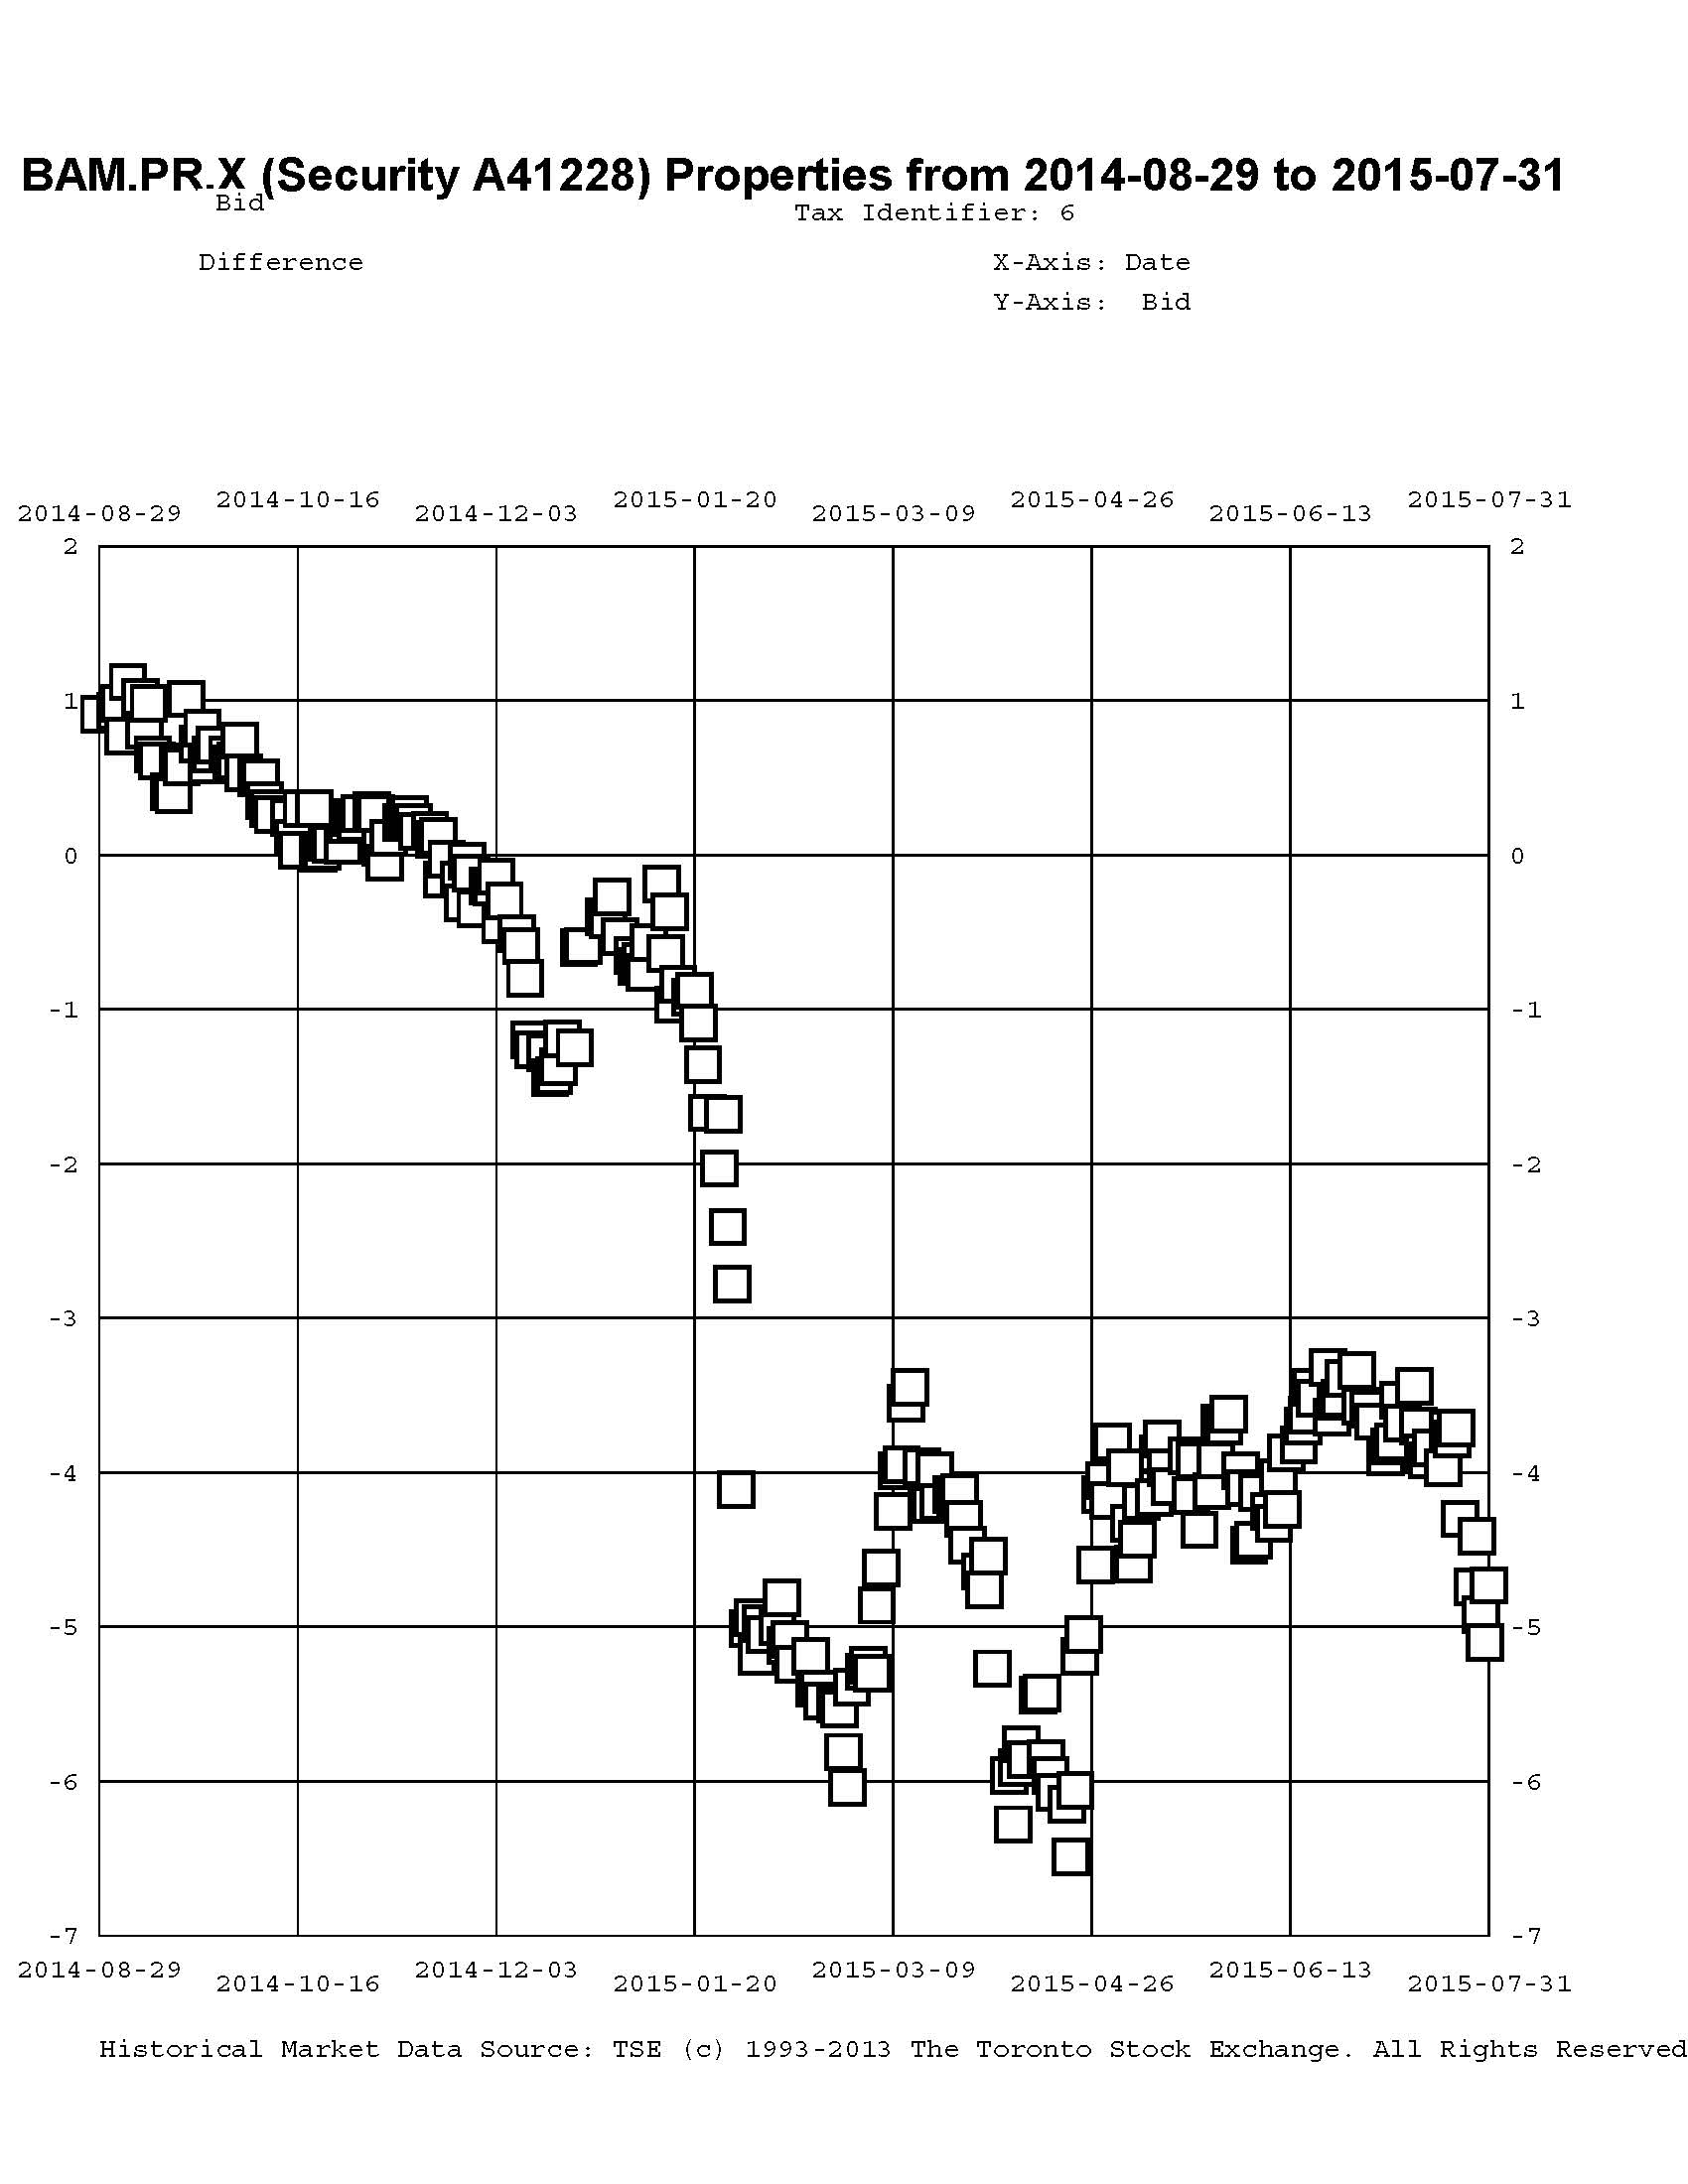
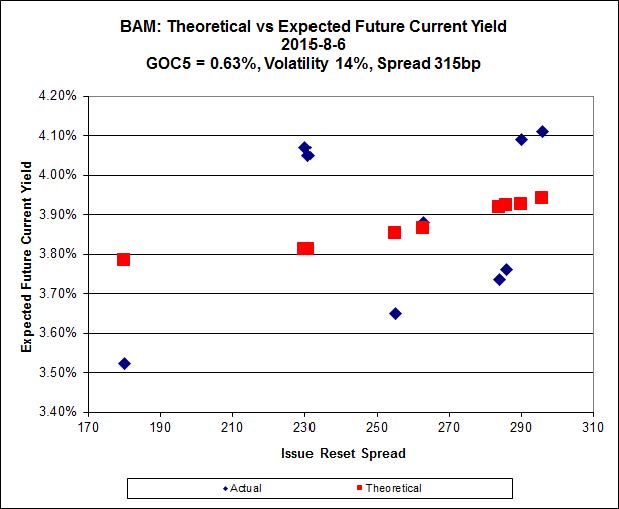
The fit on the BAM issues continues to be horrible.
The cheapest issue relative to its peers is BAM.PR.R, resetting at +230bp on 2016-6-30, bid at 18.00 to be $1.22 cheap. BAM.PF.X, resetting at +180bp on 2017-6-30 is bid at 17.25 and appears to be $1.19 rich.

Click for Big
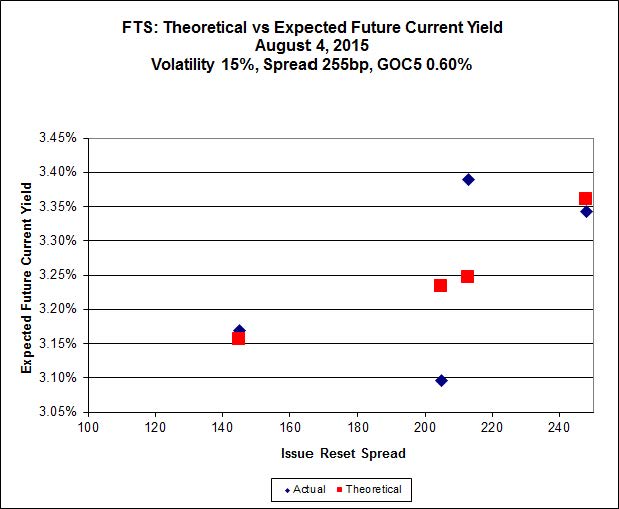
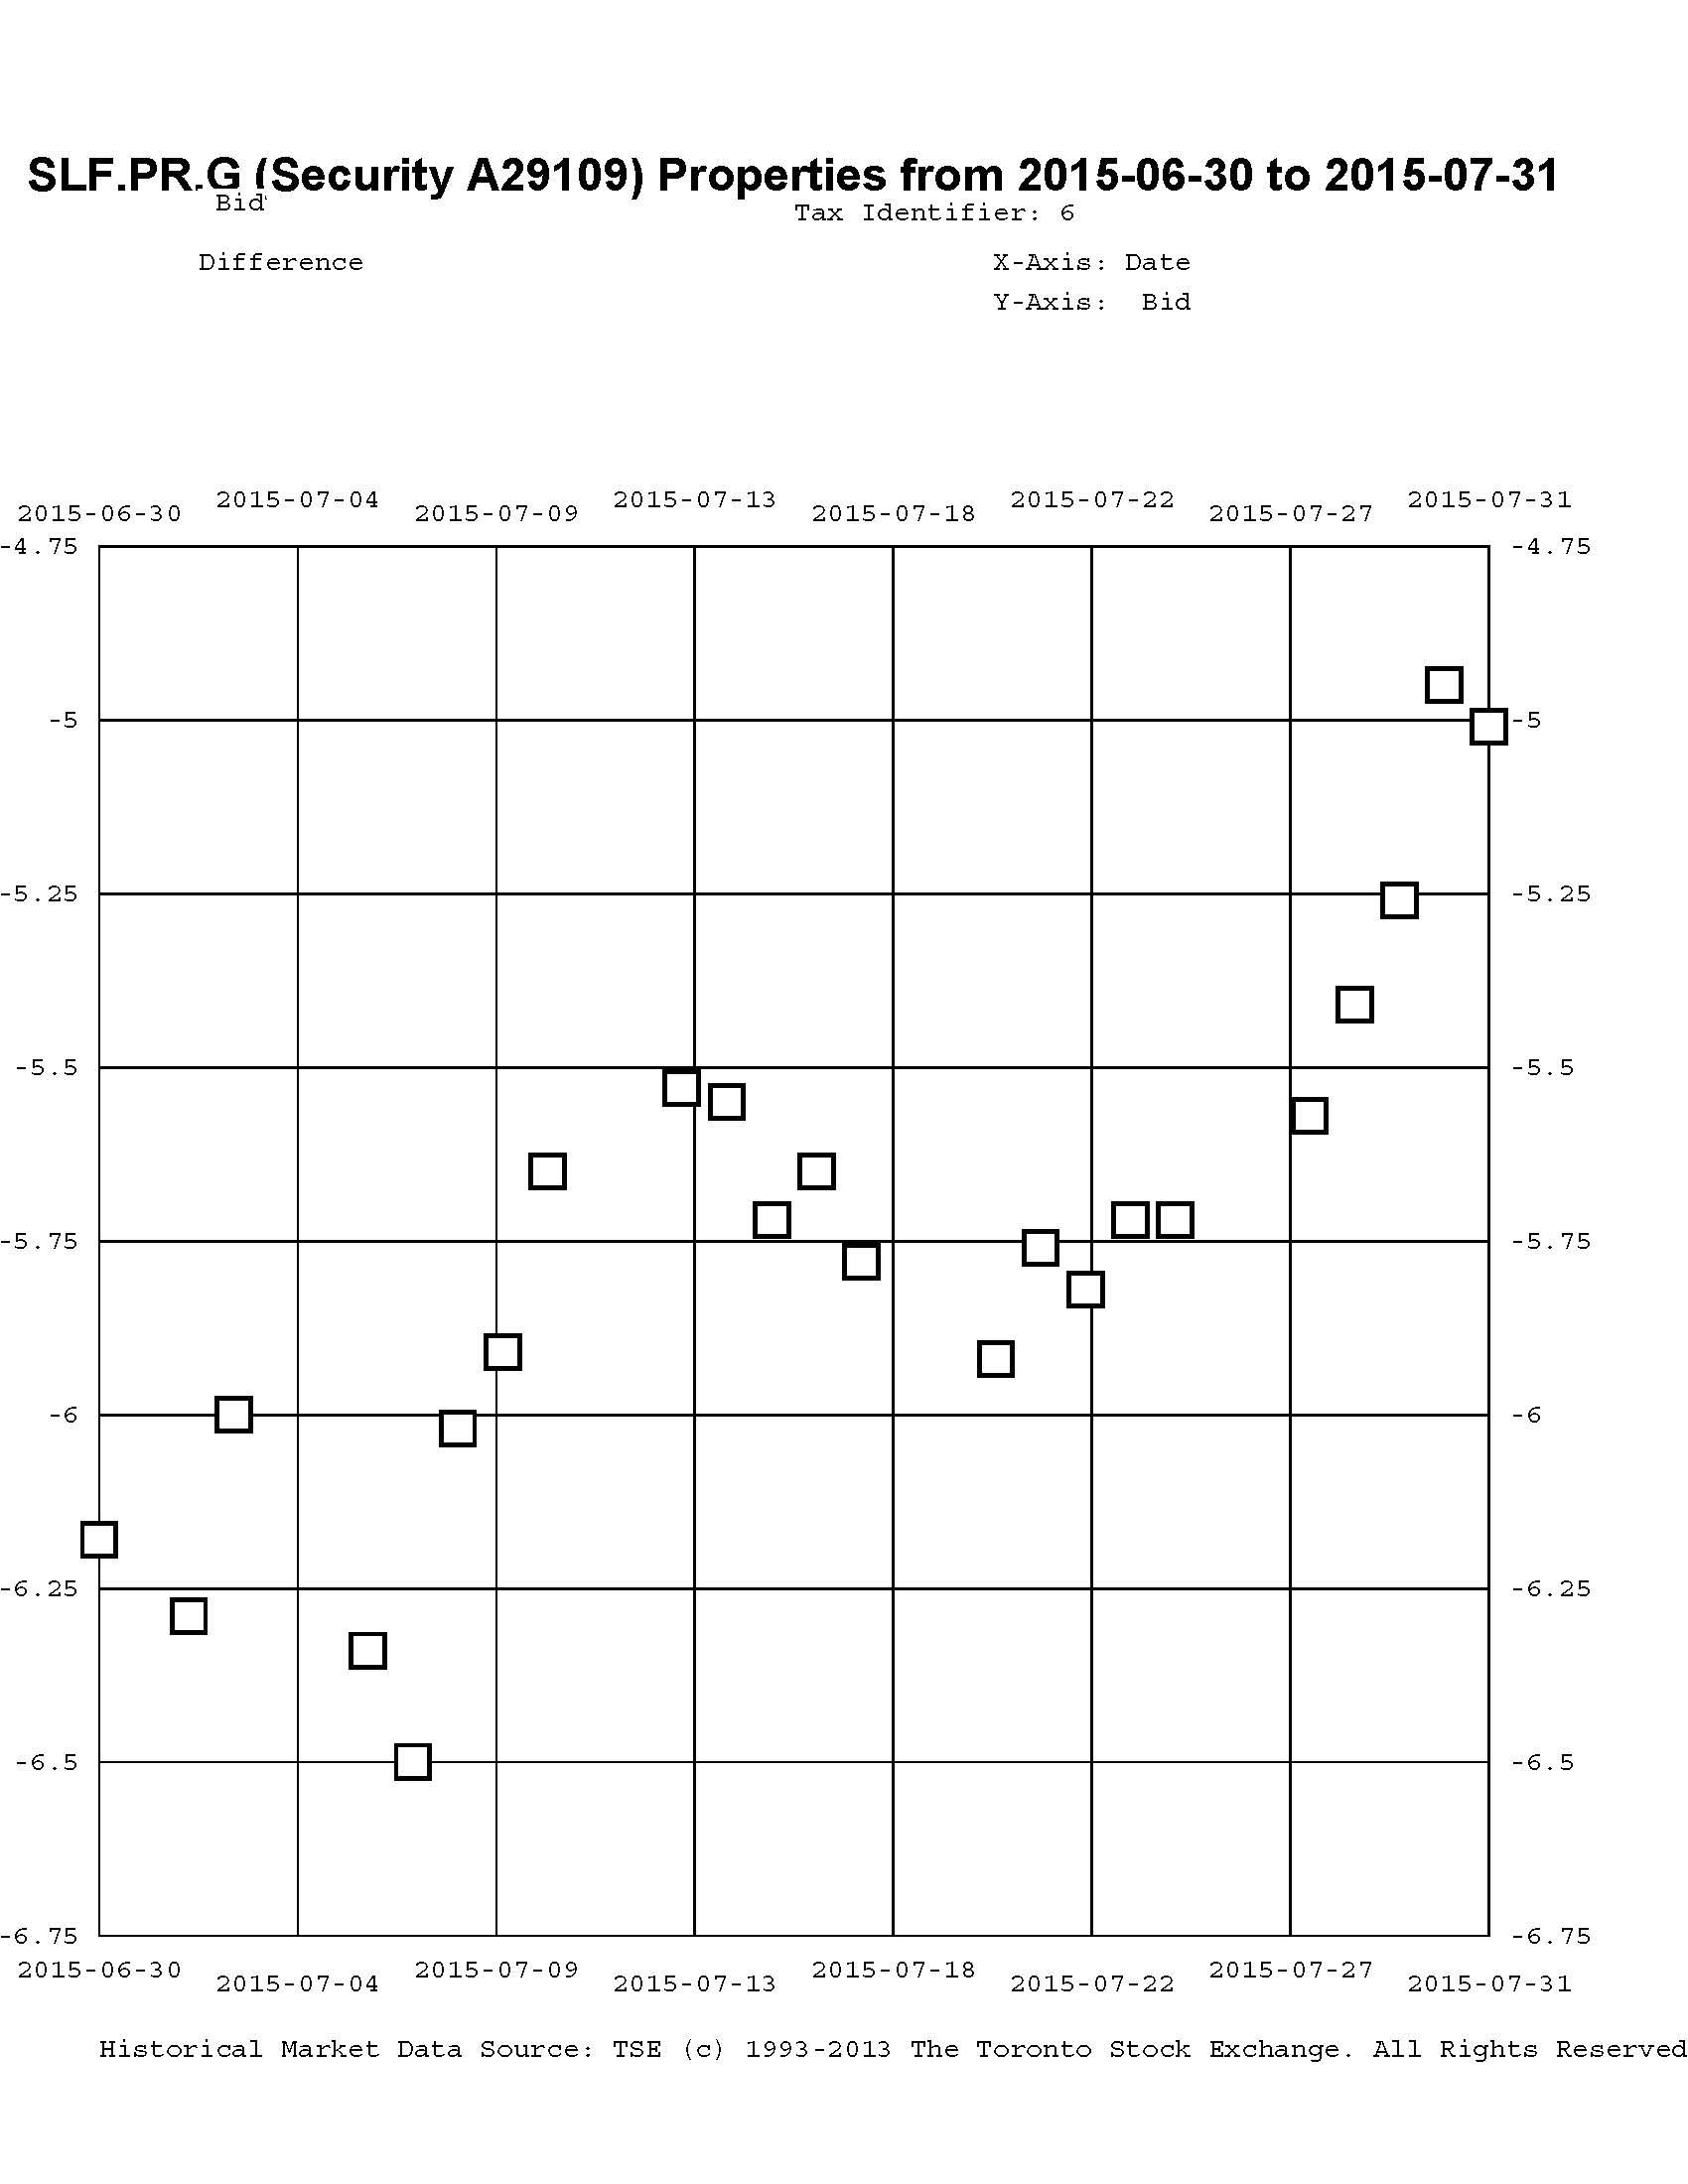
FTS.PR.K, with a spread of +205bp, and bid at 20.63, looks $0.42 expensive and resets 2019-3-1. FTS.PR.G, with a spread of +213bp and resetting 2018-9-1, is bid at 19.75 and is $0.99 cheap.

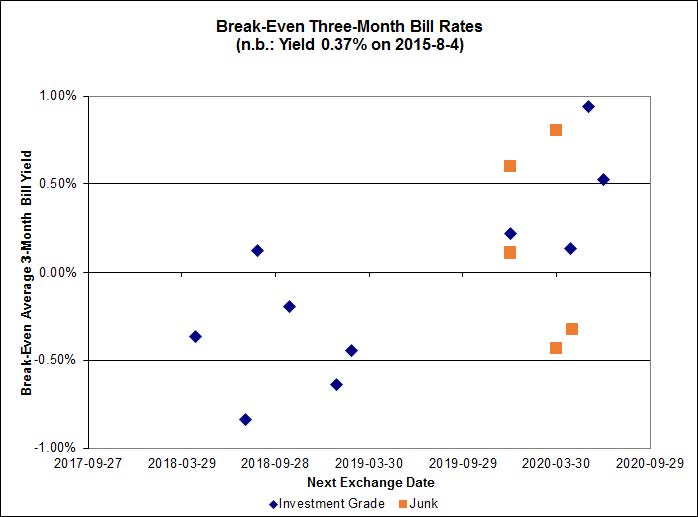
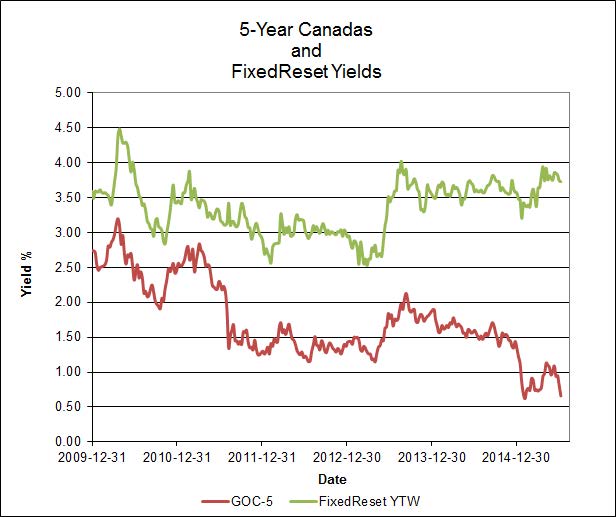
Click for Big
Investment-grade pairs predict an average three-month bill yield over the next five-odd years of -0.04%, with one outlier above 1.00%. There is one junk outlier above +1.00%.

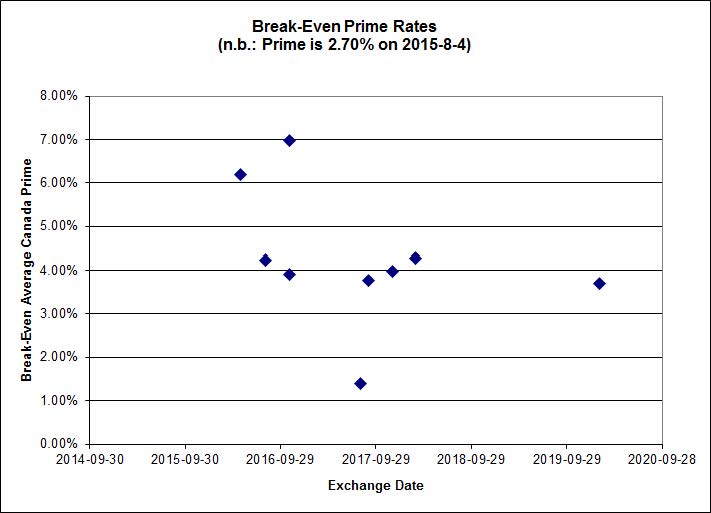
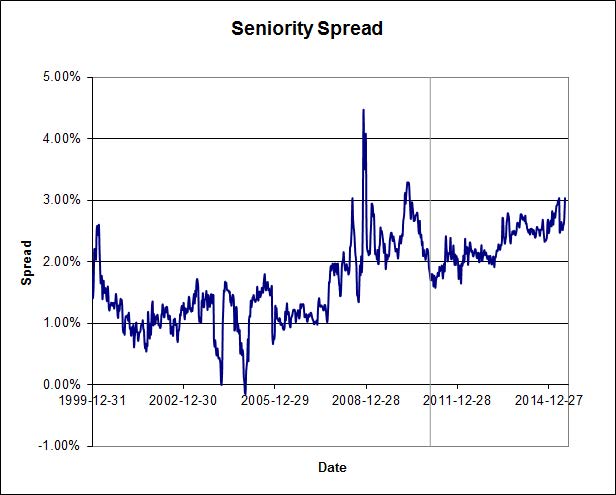
Click for Big
Shall we just say that this exhibits a high level of confidence in the continued rapacity of Canadian banks?
| HIMIPref™ Preferred Indices These values reflect the December 2008 revision of the HIMIPref™ Indices Values are provisional and are finalized monthly |
|||||||
| Index | Mean Current Yield (at bid) |
Median YTW |
Median Average Trading Value |
Median Mod Dur (YTW) |
Issues | Day’s Perf. | Index Value |
| Ratchet | 0.00 % | 0.00 % | 0 | 0.00 | 0 | 1.9964 % | 2,036.2 |
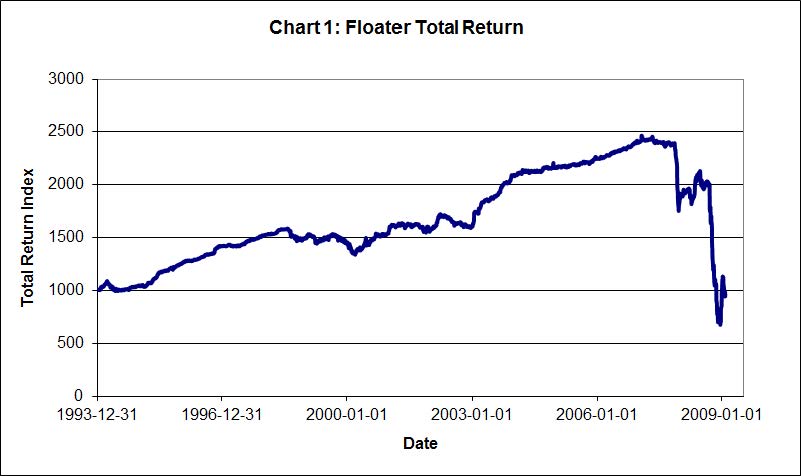
| FixedFloater | 0.00 % | 0.00 % | 0 | 0.00 | 0 | 1.9964 % | 3,560.3 |
| Floater | 3.60 % | 3.63 % | 55,481 | 18.20 | 3 | 1.9964 % | 2,164.7 |
| OpRet | 0.00 % | 0.00 % | 0 | 0.00 | 0 | 0.4585 % | 2,767.0 |
| SplitShare | 4.60 % | 4.80 % | 59,880 | 3.15 | 3 | 0.4585 % | 3,242.8 |
| Interest-Bearing | 0.00 % | 0.00 % | 0 | 0.00 | 0 | 0.4585 % | 2,530.1 |
| Perpetual-Premium | 5.72 % | 5.38 % | 65,117 | 2.09 | 9 | -0.1762 % | 2,484.9 |
| Perpetual-Discount | 5.42 % | 5.41 % | 81,761 | 14.70 | 28 | -0.3768 % | 2,602.0 |
| FixedReset | 4.71 % | 3.83 % | 209,406 | 16.00 | 87 | -0.4633 % | 2,231.3 |
| Deemed-Retractible | 5.12 % | 5.15 % | 106,205 | 5.47 | 34 | -0.0207 % | 2,579.1 |
| FloatingReset | 2.32 % | 3.29 % | 45,782 | 6.02 | 9 | -0.0099 % | 2,256.8 |
| Performance Highlights | |||
| Issue | Index | Change | Notes |
| POW.PR.B | Perpetual-Discount | -7.95 % | Looks like completely inadequate market-making on this issue, since the incredible volume of 6,480 shares appears to have overwhelmed the market making arrangements at the Exchange. The VWAP was 24.24; at 3:51pm there was a trade of 400 shares at 24.25; at 3:57, 100 shares at 23.88; at 3:59, 100 shares at 22.84; and again at 3:59, 200 shares at 22.83. So, while I have not checked whether this lamentable state of affairs is due to inadequate Toronto Stock Exchange reporting or inadequate Toronto Stock Exchange supervision of market-makers, I’ll bet a nickel the market-maker is just plain lazy, with a stupid supervisor. YTW SCENARIO Maturity Type : Limit Maturity Maturity Date : 2045-08-06 Maturity Price : 22.18 Evaluated at bid price : 22.46 Bid-YTW : 6.01 % |
| TRP.PR.C | FixedReset | -3.83 % | YTW SCENARIO Maturity Type : Limit Maturity Maturity Date : 2045-08-06 Maturity Price : 14.06 Evaluated at bid price : 14.06 Bid-YTW : 3.83 % |
| ENB.PR.D | FixedReset | -3.22 % | YTW SCENARIO Maturity Type : Limit Maturity Maturity Date : 2045-08-06 Maturity Price : 15.63 Evaluated at bid price : 15.63 Bid-YTW : 5.05 % |
| ENB.PR.F | FixedReset | -2.98 % | YTW SCENARIO Maturity Type : Limit Maturity Maturity Date : 2045-08-06 Maturity Price : 16.26 Evaluated at bid price : 16.26 Bid-YTW : 5.06 % |
| ENB.PR.P | FixedReset | -2.90 % | YTW SCENARIO Maturity Type : Limit Maturity Maturity Date : 2045-08-06 Maturity Price : 16.75 Evaluated at bid price : 16.75 Bid-YTW : 4.95 % |
| FTS.PR.K | FixedReset | -2.60 % | YTW SCENARIO Maturity Type : Limit Maturity Maturity Date : 2045-08-06 Maturity Price : 20.63 Evaluated at bid price : 20.63 Bid-YTW : 3.53 % |
| ENB.PF.C | FixedReset | -2.46 % | YTW SCENARIO Maturity Type : Limit Maturity Maturity Date : 2045-08-06 Maturity Price : 17.86 Evaluated at bid price : 17.86 Bid-YTW : 5.01 % |
| HSE.PR.C | FixedReset | -2.42 % | YTW SCENARIO Maturity Type : Limit Maturity Maturity Date : 2045-08-06 Maturity Price : 21.81 Evaluated at bid price : 22.20 Bid-YTW : 4.41 % |
| ENB.PF.E | FixedReset | -2.13 % | YTW SCENARIO Maturity Type : Limit Maturity Maturity Date : 2045-08-06 Maturity Price : 17.91 Evaluated at bid price : 17.91 Bid-YTW : 5.04 % |
| TRP.PR.E | FixedReset | -1.94 % | YTW SCENARIO Maturity Type : Limit Maturity Maturity Date : 2045-08-06 Maturity Price : 20.70 Evaluated at bid price : 20.70 Bid-YTW : 3.88 % |
| ENB.PF.A | FixedReset | -1.93 % | YTW SCENARIO Maturity Type : Limit Maturity Maturity Date : 2045-08-06 Maturity Price : 17.74 Evaluated at bid price : 17.74 Bid-YTW : 5.05 % |
| ENB.PR.T | FixedReset | -1.92 % | YTW SCENARIO Maturity Type : Limit Maturity Maturity Date : 2045-08-06 Maturity Price : 16.88 Evaluated at bid price : 16.88 Bid-YTW : 4.93 % |
| BMO.PR.W | FixedReset | -1.90 % | YTW SCENARIO Maturity Type : Limit Maturity Maturity Date : 2045-08-06 Maturity Price : 21.37 Evaluated at bid price : 21.67 Bid-YTW : 3.43 % |
| HSE.PR.A | FixedReset | -1.51 % | YTW SCENARIO Maturity Type : Limit Maturity Maturity Date : 2045-08-06 Maturity Price : 15.02 Evaluated at bid price : 15.02 Bid-YTW : 4.03 % |
| BAM.PF.A | FixedReset | -1.51 % | YTW SCENARIO Maturity Type : Limit Maturity Maturity Date : 2045-08-06 Maturity Price : 21.29 Evaluated at bid price : 21.58 Bid-YTW : 4.24 % |
| BAM.PR.T | FixedReset | -1.41 % | YTW SCENARIO Maturity Type : Limit Maturity Maturity Date : 2045-08-06 Maturity Price : 18.15 Evaluated at bid price : 18.15 Bid-YTW : 4.24 % |
| ENB.PR.Y | FixedReset | -1.33 % | YTW SCENARIO Maturity Type : Limit Maturity Maturity Date : 2045-08-06 Maturity Price : 17.05 Evaluated at bid price : 17.05 Bid-YTW : 4.76 % |
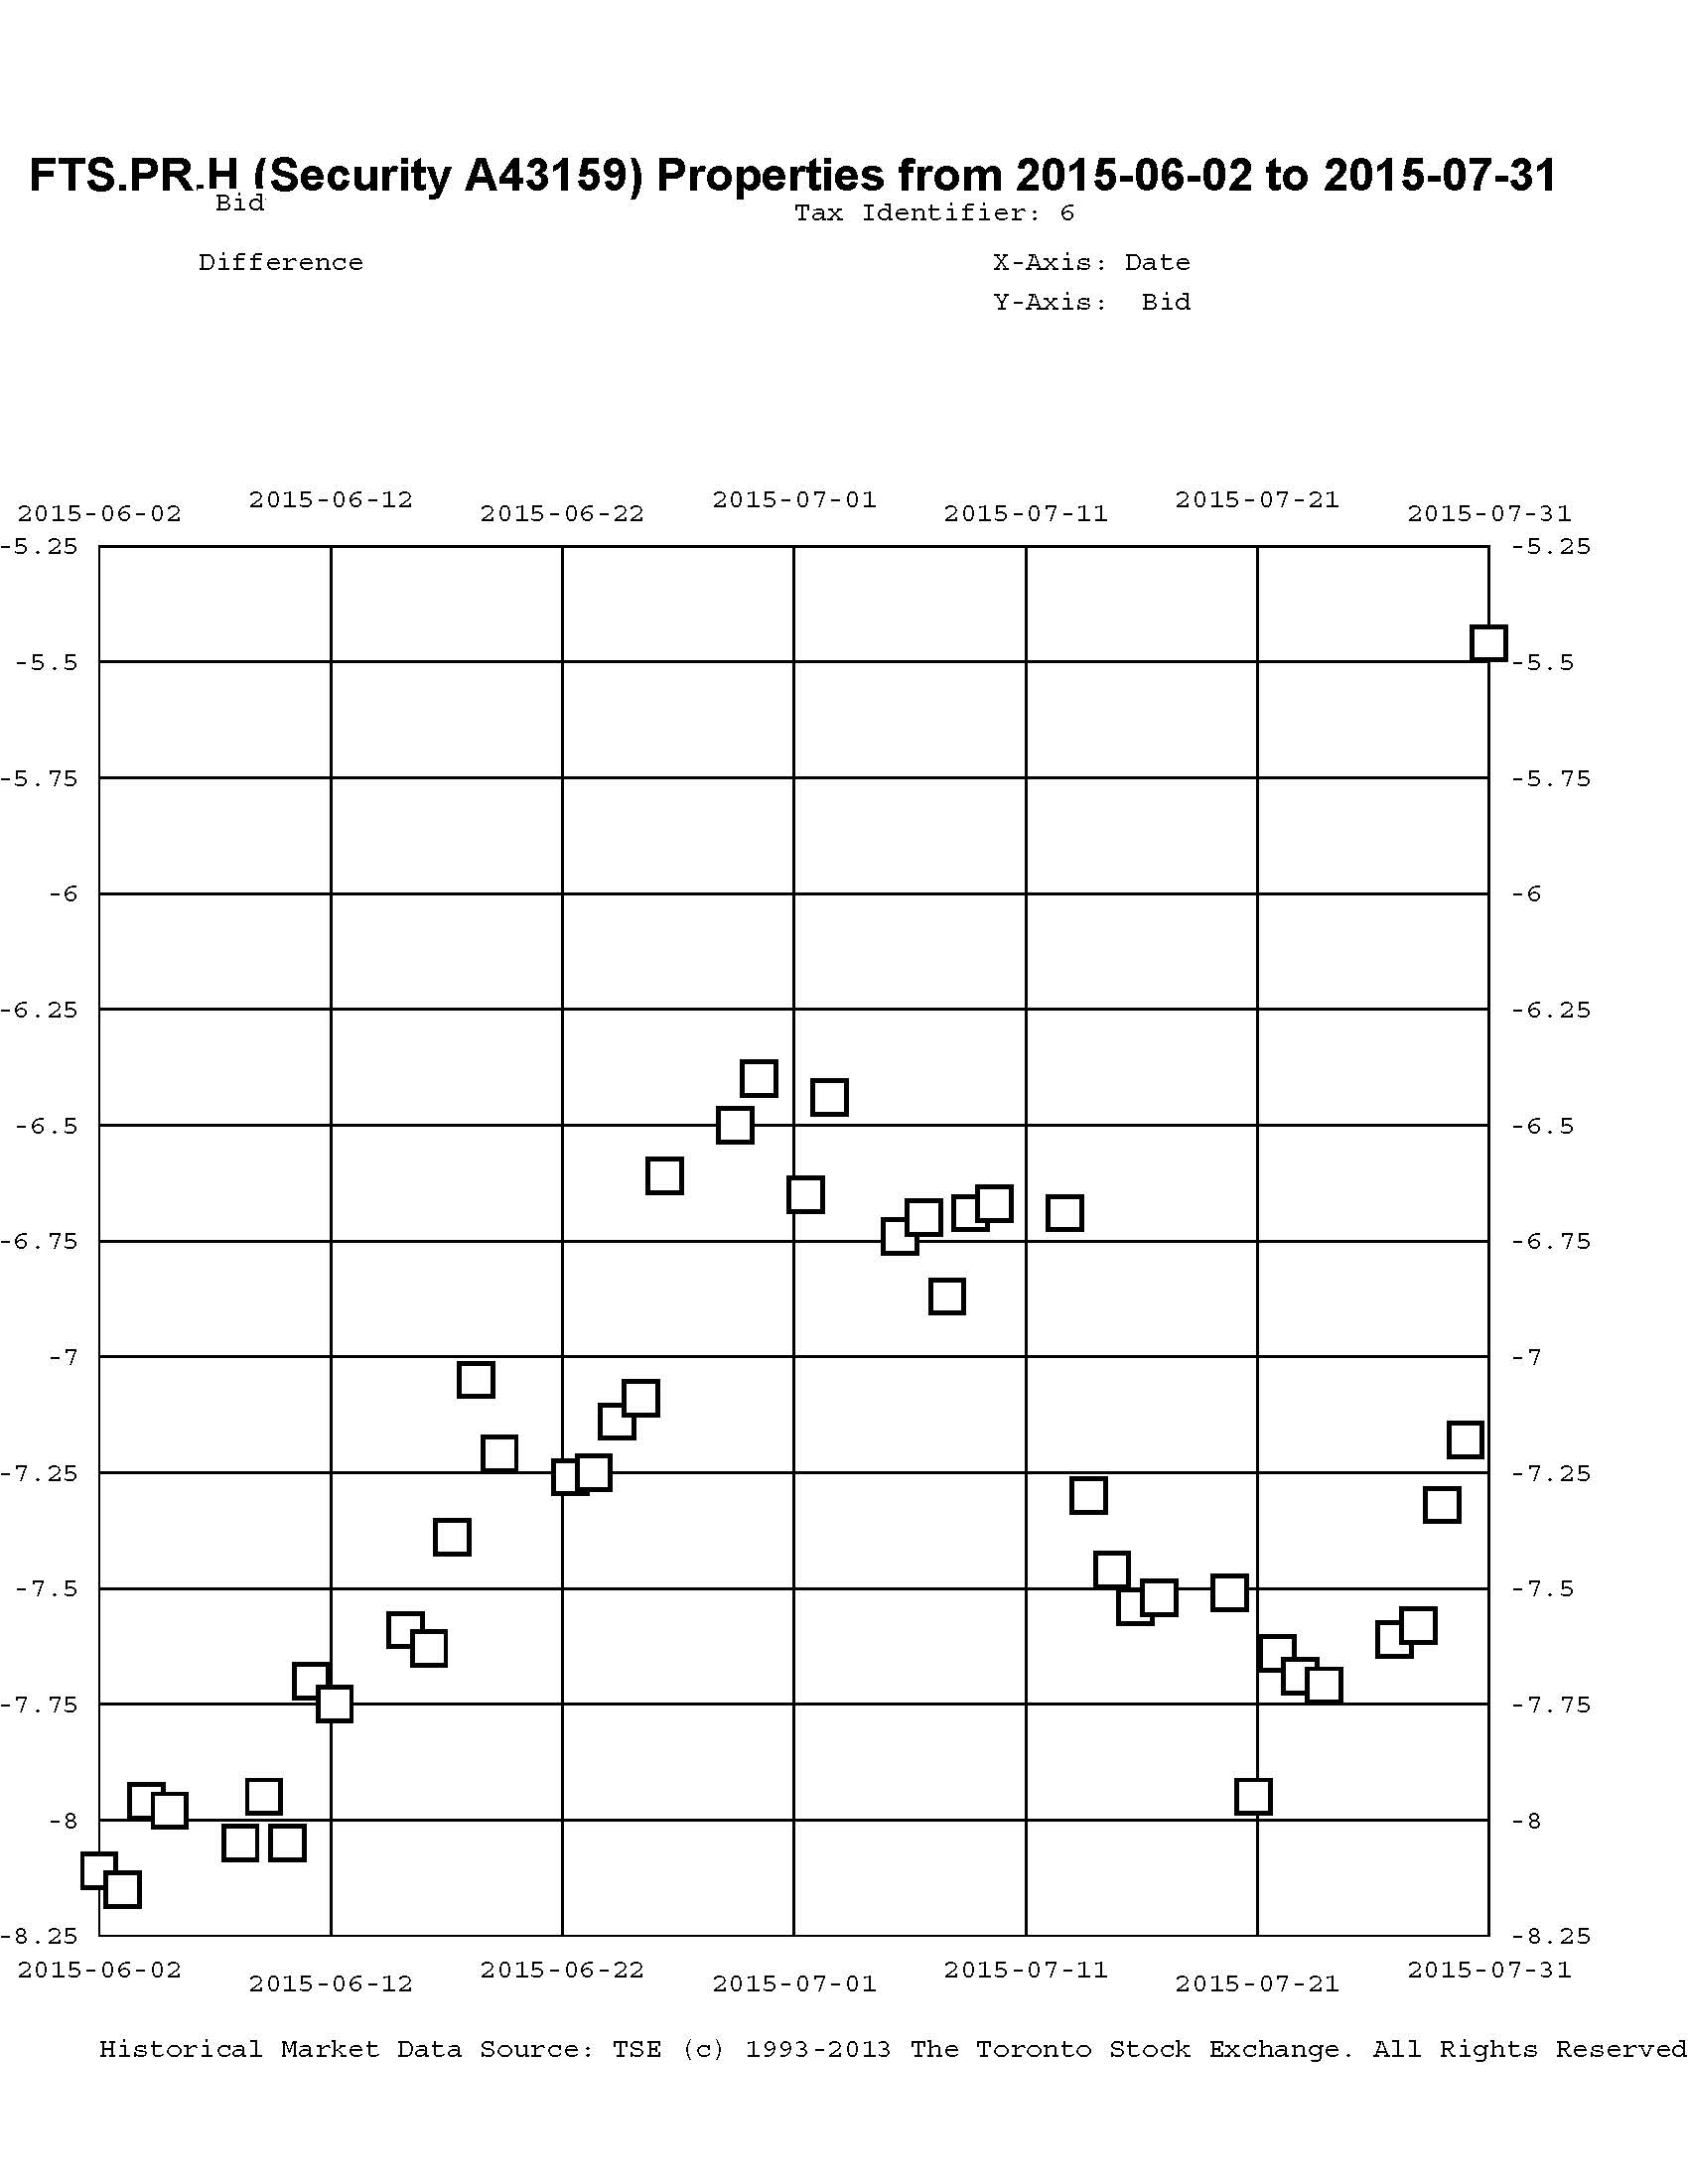
| FTS.PR.H | FixedReset | -1.22 % | YTW SCENARIO Maturity Type : Limit Maturity Maturity Date : 2045-08-06 Maturity Price : 16.25 Evaluated at bid price : 16.25 Bid-YTW : 3.32 % |
| BAM.PR.R | FixedReset | -1.21 % | YTW SCENARIO Maturity Type : Limit Maturity Maturity Date : 2045-08-06 Maturity Price : 18.00 Evaluated at bid price : 18.00 Bid-YTW : 4.19 % |
| CU.PR.C | FixedReset | -1.18 % | YTW SCENARIO Maturity Type : Limit Maturity Maturity Date : 2045-08-06 Maturity Price : 23.13 Evaluated at bid price : 23.50 Bid-YTW : 3.27 % |
| TRP.PR.B | FixedReset | -1.14 % | YTW SCENARIO Maturity Type : Limit Maturity Maturity Date : 2045-08-06 Maturity Price : 13.90 Evaluated at bid price : 13.90 Bid-YTW : 3.49 % |
| BMO.PR.T | FixedReset | -1.10 % | YTW SCENARIO Maturity Type : Limit Maturity Maturity Date : 2045-08-06 Maturity Price : 22.03 Evaluated at bid price : 22.50 Bid-YTW : 3.31 % |
| PWF.PR.R | Perpetual-Premium | -1.07 % | YTW SCENARIO Maturity Type : Limit Maturity Maturity Date : 2045-08-06 Maturity Price : 24.41 Evaluated at bid price : 24.90 Bid-YTW : 5.54 % |
| FTS.PR.G | FixedReset | -1.05 % | YTW SCENARIO Maturity Type : Limit Maturity Maturity Date : 2045-08-06 Maturity Price : 19.75 Evaluated at bid price : 19.75 Bid-YTW : 3.71 % |
| ENB.PR.N | FixedReset | -1.05 % | YTW SCENARIO Maturity Type : Limit Maturity Maturity Date : 2045-08-06 Maturity Price : 16.97 Evaluated at bid price : 16.97 Bid-YTW : 5.06 % |
| BAM.PF.D | Perpetual-Discount | -1.01 % | YTW SCENARIO Maturity Type : Limit Maturity Maturity Date : 2045-08-06 Maturity Price : 21.50 Evaluated at bid price : 21.50 Bid-YTW : 5.78 % |
| PVS.PR.D | SplitShare | 1.00 % | YTW SCENARIO Maturity Type : Hard Maturity Maturity Date : 2021-10-08 Maturity Price : 25.00 Evaluated at bid price : 24.24 Bid-YTW : 5.25 % |
| SLF.PR.H | FixedReset | 1.03 % | YTW SCENARIO Maturity Type : Hard Maturity Maturity Date : 2025-01-31 Maturity Price : 25.00 Evaluated at bid price : 19.60 Bid-YTW : 5.98 % |
| BAM.PR.B | Floater | 1.07 % | YTW SCENARIO Maturity Type : Limit Maturity Maturity Date : 2045-08-06 Maturity Price : 13.25 Evaluated at bid price : 13.25 Bid-YTW : 3.59 % |
| RY.PR.K | FloatingReset | 1.08 % | YTW SCENARIO Maturity Type : Hard Maturity Maturity Date : 2022-01-31 Maturity Price : 25.00 Evaluated at bid price : 23.50 Bid-YTW : 3.26 % |
| CU.PR.G | Perpetual-Discount | 1.42 % | YTW SCENARIO Maturity Type : Limit Maturity Maturity Date : 2045-08-06 Maturity Price : 21.50 Evaluated at bid price : 21.50 Bid-YTW : 5.33 % |
| BAM.PF.B | FixedReset | 1.99 % | YTW SCENARIO Maturity Type : Limit Maturity Maturity Date : 2045-08-06 Maturity Price : 21.01 Evaluated at bid price : 21.01 Bid-YTW : 4.09 % |
| BAM.PR.C | Floater | 2.13 % | YTW SCENARIO Maturity Type : Limit Maturity Maturity Date : 2045-08-06 Maturity Price : 12.97 Evaluated at bid price : 12.97 Bid-YTW : 3.67 % |
| BAM.PR.K | Floater | 2.82 % | YTW SCENARIO Maturity Type : Limit Maturity Maturity Date : 2045-08-06 Maturity Price : 13.12 Evaluated at bid price : 13.12 Bid-YTW : 3.63 % |
| Volume Highlights | |||
| Issue | Index | Shares Traded |
Notes |
| BMO.PR.K | Deemed-Retractible | 140,630 | Nesbitt crossed 40,000 at 25.40; TD crossed 100,000 at the same price. YTW SCENARIO Maturity Type : Call Maturity Date : 2015-11-25 Maturity Price : 25.25 Evaluated at bid price : 25.37 Bid-YTW : 2.74 % |
| MFC.PR.J | FixedReset | 117,700 | RBC crossed blocks of 40,000 and 65,000, both at 23.50. YTW SCENARIO Maturity Type : Hard Maturity Maturity Date : 2025-01-31 Maturity Price : 25.00 Evaluated at bid price : 23.48 Bid-YTW : 4.30 % |
| BNS.PR.O | Deemed-Retractible | 100,600 | Scotia crossed 100,000 at 25.65. YTW SCENARIO Maturity Type : Call Maturity Date : 2016-04-27 Maturity Price : 25.25 Evaluated at bid price : 25.52 Bid-YTW : 4.14 % |
| BNS.PR.B | FloatingReset | 78,897 | TD crossed 77,200 at 23.20. YTW SCENARIO Maturity Type : Hard Maturity Maturity Date : 2022-01-31 Maturity Price : 25.00 Evaluated at bid price : 23.15 Bid-YTW : 3.29 % |
| MFC.PR.G | FixedReset | 55,425 | RBC crossed 21,900 at 24.65. YTW SCENARIO Maturity Type : Hard Maturity Maturity Date : 2025-01-31 Maturity Price : 25.00 Evaluated at bid price : 24.65 Bid-YTW : 3.87 % |
| SLF.PR.H | FixedReset | 53,339 | RBC crossed 40,000 at 19.60. YTW SCENARIO Maturity Type : Hard Maturity Maturity Date : 2025-01-31 Maturity Price : 25.00 Evaluated at bid price : 19.60 Bid-YTW : 5.98 % |
| There were 33 other index-included issues trading in excess of 10,000 shares. | |||
| Wide Spread Highlights | ||
| Issue | Index | Quote Data and Yield Notes |
| POW.PR.B | Perpetual-Discount | Quote: 22.46 – 24.25 Spot Rate : 1.7900 Average : 1.0132 YTW SCENARIO |
| BAM.PR.B | Floater | Quote: 13.25 – 14.25 Spot Rate : 1.0000 Average : 0.5912 YTW SCENARIO |
| BMO.PR.W | FixedReset | Quote: 21.67 – 22.26 Spot Rate : 0.5900 Average : 0.3650 YTW SCENARIO |
| TRP.PR.C | FixedReset | Quote: 14.06 – 14.69 Spot Rate : 0.6300 Average : 0.4129 YTW SCENARIO |
| MFC.PR.N | FixedReset | Quote: 21.88 – 23.00 Spot Rate : 1.1200 Average : 0.9053 YTW SCENARIO |
| TRP.PR.F | FloatingReset | Quote: 16.85 – 17.50 Spot Rate : 0.6500 Average : 0.4432 YTW SCENARIO |