Archive for October, 2018

BNS.PR.I Firm on Modest Volume

Friday, October 12th, 2018

The Bank of Nova Scotia has announced:

that it has completed the domestic public offering of Non-cumulative 5-Year Rate Reset Preferred Shares Series 40 (Non-Viability Contingent Capital (NVCC)) (the “Preferred Shares Series 40”).

Scotiabank sold 12 million Preferred Shares Series 40 at a price of $25.00 per share and holders will be entitled to receive a non-cumulative quarterly fixed dividend for the initial period ending January 26, 2024 yielding 4.85% per annum, as and when declared by the Board of Directors of Scotiabank. The gross proceeds of the offering were $300 million.

The offering was made through a syndicate of underwriters led by Scotia Capital Inc. The Preferred Shares Series 40 commenced trading on the Toronto Stock Exchange today under the symbol BNS.PR.I.

On January 27, 2024 and on January 27 every five years thereafter, Scotiabank may, at its option, subject to regulatory approval, redeem all or any number of the then outstanding Preferred Shares Series 40 at a redemption price of $25 per share. Thereafter, the dividend rate will reset every five years at a rate equal to 2.43% over the 5-year Government of Canada bond yield. Holders of Preferred Shares Series 40 will, subject to certain conditions, have the right to convert all or any part of their shares to Non-cumulative Floating Rate Preferred Shares Series 41 (Non-Viability Contingent Capital (NVCC)) (the “Preferred Shares Series 41”) of Scotiabank on January 27, 2024 and on January 27 every five years thereafter.

Holders of the Preferred Shares Series 41 will be entitled to receive a non-cumulative quarterly floating dividend at a rate equal to the 3-month Government of Canada Treasury Bill yield plus 2.43%, as and when declared by the Board of Directors of Scotiabank. Holders of Preferred Shares Series 41 will, subject to certain conditions, have the right to convert all or any part of their shares to Preferred Shares Series 40 on January 27, 2029 and on January 27 every five years thereafter.

BNS.PR.I is a FixedReset, 4.85%+243, NVCC, issue that was announced 2018-10-2. It will be tracked by HIMIPref™ and has been assigned to the FixedReset-Discount sub-index.

The issue traded 644,420 shares today in a range of 24.90-97 before closing at 24.93-97. Vital statistics are:

BNS.PR.I FixedReset Disc YTW SCENARIO
Maturity Type : Limit Maturity
Maturity Date : 2048-10-12
Maturity Price : 23.12
Evaluated at bid price : 24.93
Bid-YTW : 4.76 %

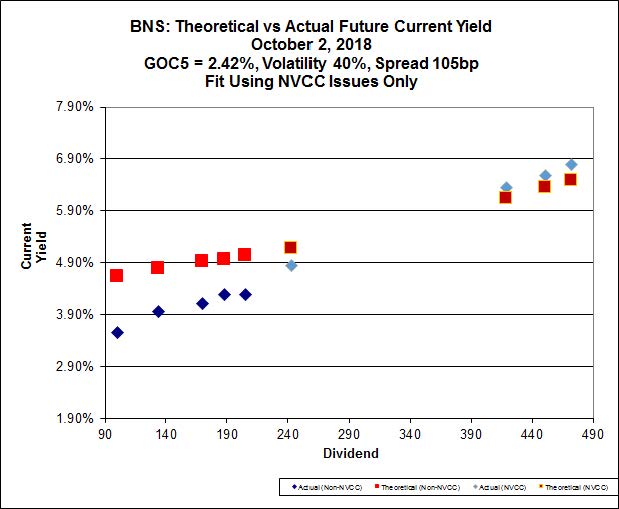
The new issue is quite expensive according to Implied Volatility Analysis:

impvol_bns_181012
Click for Big

According to this analysis, the fair value of the new issue on October 12 is 23.05, down from the October 2 fair value of 23.43. However, it should be noted that the analysis is forced to do some major extrapolation, as the only other BNS FixedReset NVCC-compliant issues are BNS.PR.E, BNS.PR.G and BNS.PR.H, all of which have Issue Reset Spreads in excess of 400bp. On the other hand, the issue seems well aligned with the NVCC non-compliant issues, whereas it should be well above the regression line they form.

The ludicrously high figure of Implied Volatility is something I take to mean that the underlying assumption of the Black-Scholes model, that of no directionality of prices, is not accepted by the market; the market seems to be taking the view that since things seem rosy now, they will always be rosy and everything will trade near par in the future.

I balk at ascribing a 100% probability to the ‘all issues will be called, or at least exhibit price stability’ hypothesis. There may still be a few old geezers amongst the Assiduous Readers of this blog who can still (faintly) remember the Great Bear Market of 2014-16, in which quite a few similar assumptions made earlier turned out to be slightly inaccurate. The extra cushion implied by an Issue Reset Spread that is well over the market spread is worth something, even if nothing gets called. Or, to put it another way, one can buy a whole lot of downside protection for very little extra money, relative to this issue.

October 12, 2018

Friday, October 12th, 2018

Trump continues to attack the Fed:

President Trump responded to falling stock prices on Thursday by continuing to throw rocks at the Federal Reserve, which he has described as “crazy,” “loco,” “going wild” and “out of control” for slowly raising interest rates against the backdrop of a booming economy.

No other modern president has publicly attacked the Fed with such venom or frequency. Indeed, some scholars said the only close historical parallel was with President Andrew Jackson, who campaigned successfully in the 1830s to close the Fed’s predecessor, the Second Bank of the United States.

“I think the Fed has gone crazy,” he told reporters on Wednesday afternoon. Later in the day, speaking with Fox News, he continued to increase the heat. “The Fed is going wild,” he said. “I don’t know what their problem is. They are raising interest rates and it’s ridiculous.”

“It’s not right,” he said Thursday. “It’s not necessary, and I think I know more about it than they do.”

I’m not sure how much support he’ll find for that last assertion!

Liquidity is often discussed on PrefBlog. It may be becoming an issue in the Indian equity market:

Fund managers who’d hoped for private-equity type returns by discovering jewels buried in the haystacks of public markets were essentially souping up performance by forgoing liquidity. Now that the markets are punishing them for that recklessness, the search for the elusive alpha is over — in infrastructure; power; banking and finance; small-, mid- and micro-cap shares; transport and logistics; value stocks; state owned firms; business cycles; and every other fad.

A rush for the exits may cause its own problems, especially when it comes to handling redemption pressures. On conservative estimates, it would take more than 30 days to offload a quarter of the net assets of one small Indian infrastructure fund, Bloomberg’s liquidity tools show. A fifth of a large tax-saver fund would need more than 180 days to dismantle, so thin is the liquidity of the stocks it holds. (By contrast, a typical index fund tracking the Nifty 50 can be
entirely liquidated in less than three days.)

HIMIPref™ Preferred Indices
These values reflect the December 2008 revision of the HIMIPref™ Indices

Values are provisional and are finalized monthly
Index Mean
Current
Yield
(at bid)
Median
YTW
Median
Average
Trading
Value
Median
Mod Dur
(YTW)
Issues Day’s Perf. Index Value
Ratchet 0.00 % 0.00 % 0 0.00 0 -0.4438 % 3,105.3
FixedFloater 0.00 % 0.00 % 0 0.00 0 -0.4438 % 5,698.1
Floater 3.50 % 3.71 % 40,599 18.07 4 -0.4438 % 3,283.8
OpRet 0.00 % 0.00 % 0 0.00 0 -0.1270 % 3,222.0
SplitShare 4.62 % 4.72 % 55,223 4.73 5 -0.1270 % 3,847.8
Interest-Bearing 0.00 % 0.00 % 0 0.00 0 -0.1270 % 3,002.2
Perpetual-Premium 5.62 % -1.90 % 59,087 0.14 12 -0.0731 % 2,914.5
Perpetual-Discount 5.54 % 5.67 % 68,941 14.44 21 -0.1303 % 2,959.4
FixedReset Disc 4.21 % 5.09 % 141,285 15.42 44 0.0030 % 2,587.4
Deemed-Retractible 5.27 % 6.59 % 65,017 5.28 27 -0.0160 % 2,935.6
FloatingReset 3.60 % 3.80 % 41,265 5.57 4 -0.1393 % 2,845.9
FixedReset Prem 4.89 % 4.32 % 224,634 2.84 34 -0.1188 % 2,560.6
FixedReset Bank Non 3.20 % 3.71 % 68,069 0.36 9 -0.1131 % 2,574.7
FixedReset Ins Non 4.40 % 5.46 % 103,507 5.38 22 0.0572 % 2,546.1
Performance Highlights
Issue Index Change Notes
PWF.PR.A Floater -1.61 % YTW SCENARIO
Maturity Type : Limit Maturity
Maturity Date : 2048-10-12
Maturity Price : 21.40
Evaluated at bid price : 21.40
Bid-YTW : 3.05 %
IFC.PR.E Deemed-Retractible -1.56 % YTW SCENARIO
Maturity Type : Hard Maturity
Maturity Date : 2025-01-31
Maturity Price : 25.00
Evaluated at bid price : 23.33
Bid-YTW : 6.59 %
MFC.PR.Q FixedReset Ins Non -1.21 % YTW SCENARIO
Maturity Type : Hard Maturity
Maturity Date : 2025-01-31
Maturity Price : 25.00
Evaluated at bid price : 23.71
Bid-YTW : 5.84 %
BAM.PR.C Floater -1.07 % YTW SCENARIO
Maturity Type : Limit Maturity
Maturity Date : 2048-10-12
Maturity Price : 17.55
Evaluated at bid price : 17.55
Bid-YTW : 3.71 %
MFC.PR.C Deemed-Retractible 1.01 % YTW SCENARIO
Maturity Type : Hard Maturity
Maturity Date : 2025-01-31
Maturity Price : 25.00
Evaluated at bid price : 20.00
Bid-YTW : 8.81 %
MFC.PR.N FixedReset Ins Non 1.06 % YTW SCENARIO
Maturity Type : Hard Maturity
Maturity Date : 2025-01-31
Maturity Price : 25.00
Evaluated at bid price : 22.95
Bid-YTW : 6.14 %
TRP.PR.C FixedReset Disc 1.08 % YTW SCENARIO
Maturity Type : Limit Maturity
Maturity Date : 2048-10-12
Maturity Price : 17.76
Evaluated at bid price : 17.76
Bid-YTW : 5.24 %
HSE.PR.G FixedReset Prem 1.15 % YTW SCENARIO
Maturity Type : Call
Maturity Date : 2020-06-30
Maturity Price : 25.00
Evaluated at bid price : 24.71
Bid-YTW : 5.45 %
CU.PR.F Perpetual-Discount 1.33 % YTW SCENARIO
Maturity Type : Limit Maturity
Maturity Date : 2048-10-12
Maturity Price : 20.58
Evaluated at bid price : 20.58
Bid-YTW : 5.55 %
BAM.PF.F FixedReset Disc 1.35 % YTW SCENARIO
Maturity Type : Limit Maturity
Maturity Date : 2048-10-12
Maturity Price : 24.30
Evaluated at bid price : 24.72
Bid-YTW : 5.28 %
BAM.PR.R FixedReset Disc 1.49 % YTW SCENARIO
Maturity Type : Limit Maturity
Maturity Date : 2048-10-12
Maturity Price : 21.18
Evaluated at bid price : 21.18
Bid-YTW : 5.27 %
BAM.PR.X FixedReset Disc 2.28 % YTW SCENARIO
Maturity Type : Limit Maturity
Maturity Date : 2048-10-12
Maturity Price : 19.30
Evaluated at bid price : 19.30
Bid-YTW : 5.07 %
Volume Highlights
Issue Index Shares
Traded
Notes
BNS.PR.I FixedReset Disc 644,420 YTW SCENARIO
Maturity Type : Limit Maturity
Maturity Date : 2048-10-12
Maturity Price : 23.12
Evaluated at bid price : 24.93
Bid-YTW : 4.76 %
TRP.PR.J FixedReset Prem 92,175 YTW SCENARIO
Maturity Type : Call
Maturity Date : 2021-05-31
Maturity Price : 25.00
Evaluated at bid price : 26.06
Bid-YTW : 4.07 %
SLF.PR.I FixedReset Ins Non 82,820 YTW SCENARIO
Maturity Type : Hard Maturity
Maturity Date : 2025-01-31
Maturity Price : 25.00
Evaluated at bid price : 24.06
Bid-YTW : 5.13 %
MFC.PR.R FixedReset Ins Non 77,906 YTW SCENARIO
Maturity Type : Call
Maturity Date : 2022-03-19
Maturity Price : 25.00
Evaluated at bid price : 25.24
Bid-YTW : 4.67 %
TD.PF.A FixedReset Disc 68,100 YTW SCENARIO
Maturity Type : Limit Maturity
Maturity Date : 2048-10-12
Maturity Price : 22.61
Evaluated at bid price : 23.13
Bid-YTW : 4.94 %
TD.PF.K FixedReset Prem 65,900 YTW SCENARIO
Maturity Type : Call
Maturity Date : 2023-10-31
Maturity Price : 25.00
Evaluated at bid price : 25.07
Bid-YTW : 4.80 %
There were 37 other index-included issues trading in excess of 10,000 shares.
Wide Spread Highlights
Issue Index Quote Data and Yield Notes
MFC.PR.Q FixedReset Ins Non Quote: 23.71 – 24.07
Spot Rate : 0.3600
Average : 0.2452

YTW SCENARIO
Maturity Type : Hard Maturity
Maturity Date : 2025-01-31
Maturity Price : 25.00
Evaluated at bid price : 23.71
Bid-YTW : 5.84 %

BAM.PF.J FixedReset Prem Quote: 25.10 – 25.45
Spot Rate : 0.3500
Average : 0.2509

YTW SCENARIO
Maturity Type : Call
Maturity Date : 2022-12-31
Maturity Price : 25.00
Evaluated at bid price : 25.10
Bid-YTW : 4.71 %

EMA.PR.H FixedReset Prem Quote: 25.16 – 25.43
Spot Rate : 0.2700
Average : 0.1833

YTW SCENARIO
Maturity Type : Limit Maturity
Maturity Date : 2048-10-12
Maturity Price : 23.23
Evaluated at bid price : 25.16
Bid-YTW : 4.85 %

BMO.PR.Y FixedReset Bank Non Quote: 24.55 – 24.82
Spot Rate : 0.2700
Average : 0.1864

YTW SCENARIO
Maturity Type : Limit Maturity
Maturity Date : 2048-10-12
Maturity Price : 23.44
Evaluated at bid price : 24.55
Bid-YTW : 5.05 %

TD.PF.J FixedReset Prem Quote: 24.75 – 25.02
Spot Rate : 0.2700
Average : 0.1907

YTW SCENARIO
Maturity Type : Call
Maturity Date : 2023-04-30
Maturity Price : 25.00
Evaluated at bid price : 24.75
Bid-YTW : 4.91 %

TD.PF.C FixedReset Disc Quote: 23.08 – 23.32
Spot Rate : 0.2400
Average : 0.1617

YTW SCENARIO
Maturity Type : Limit Maturity
Maturity Date : 2048-10-12
Maturity Price : 22.63
Evaluated at bid price : 23.08
Bid-YTW : 4.94 %

CCS : Outlook Stable, says S&P

Friday, October 12th, 2018

Standard & Poor’s has announced:

  • •The Co-operators’ P/C operations have lagged the performance of the broader P/C sector and improvement in profitability and scale of the life operations have lagged original expectations.
  • •We are revising our outlook on Co-operators and its core operating subsidiaries to stable from positive, and affirming our ratings.
  • •The stable outlook reflects our expectation that Co-operators will maintain at least very strong capitalization and strong competitive position despite challenges expanding its life insurance operations and P/C underwriting performance.

… S&P Global Ratings said today it revised its outlook on Co-operators Financial Services Ltd. (Co-operators) and
its core operating life and property/casualty (P/C) insurance subsidiaries to stable from positive. We also affirmed our ‘BBB’ long-term issuer credit rating, senior unsecured debt rating, and preferred stock rating on Co-operators, and our ‘A-‘ financial strength rating on Co-operators’ core operating life and P/C insurance subsidiaries.

Co-operator General is typically the earnings engine for the group. However, given the company’s accelerated growth in a challenging P/C market, specifically Ontario auto, we expect underwriting performance for the P/C operations to lag the Canadian P/C market. Additionally, more frequent weather-related losses continue to strain the bottom line. For the first half of 2018, Co-operators General had a combined ratio of 107.7%, which was approximately 6 points worse than the 101.7% combined ratio the industry posted. This underperformance follows up 2017 results, when the company posted a combined ratio of 102.4% compared to the industry’s 96.4%. We expect underwriting performance to improve from year-to-date results, but lag the overall industry as Co-operators works through earning rate increases for both property and auto lines of business. The company will likely gain market share given publicly stated actions from competitors to reduce share in Ontario auto, which can improve their market position assuming they ultimately reach rate adequacy and improve the underwriting performance with minimal movement in retentions.

The outlook is stable. We expect profitability for the group to be driven by the P/C group, albeit at lower levels because of growth in difficult markets including Ontario and Alberta auto, and the frequency of weather-related
losses.

The affected issue is CCS.PR.C

October 11, 2018

Thursday, October 11th, 2018

More carnage and destruction today:

Initial hopes that the stock market would stabilize after Wednesday’s sharp sell-off were dashed on Thursday: U.S., Canadian, Asian and European stocks slid further, contributing to the most challenging atmosphere for stocks since February and raising questions about how long the rout will last – and how deep it will go.

These concerns are reverberating worldwide. The S&P 500 fell 57.32 points, or 2.1 per cent, to 2728.36, one day after registering its worst decline in eight months. The Dow Jones Industrial Average fell 545.91 points or 2.1 per cent, to 25,052.83 − bringing its two-day decline to more than 1,300 points.

In Canada, the S&P/TSX Composite Index fell 200.27 points or 1.3 per cent, to 15,317.13. Britain’s FTSE 100 fell 1.9 per cent and Japan’s Nikkei 225 fell 3.9 per cent.

HIMIPref™ Preferred Indices
These values reflect the December 2008 revision of the HIMIPref™ Indices

Values are provisional and are finalized monthly
Index Mean
Current
Yield
(at bid)
Median
YTW
Median
Average
Trading
Value
Median
Mod Dur
(YTW)
Issues Day’s Perf. Index Value
Ratchet 0.00 % 0.00 % 0 0.00 0 -1.1302 % 3,119.2
FixedFloater 0.00 % 0.00 % 0 0.00 0 -1.1302 % 5,723.5
Floater 3.48 % 3.67 % 40,035 18.16 4 -1.1302 % 3,298.5
OpRet 0.00 % 0.00 % 0 0.00 0 -0.2138 % 3,226.1
SplitShare 4.61 % 4.72 % 54,661 4.74 5 -0.2138 % 3,852.6
Interest-Bearing 0.00 % 0.00 % 0 0.00 0 -0.2138 % 3,006.0
Perpetual-Premium 5.61 % -2.09 % 58,954 0.14 12 -0.1724 % 2,916.7
Perpetual-Discount 5.53 % 5.66 % 68,919 14.42 21 -0.1720 % 2,963.3
FixedReset Disc 4.19 % 5.12 % 132,607 15.27 43 -0.7133 % 2,587.3
Deemed-Retractible 5.27 % 6.28 % 65,788 5.28 27 -0.1771 % 2,936.1
FloatingReset 3.58 % 3.77 % 41,562 5.58 4 -0.6804 % 2,849.9
FixedReset Prem 4.88 % 4.25 % 224,411 3.05 34 -0.2852 % 2,563.6
FixedReset Bank Non 3.20 % 4.01 % 68,815 0.37 9 -0.0588 % 2,577.6
FixedReset Ins Non 4.41 % 5.53 % 104,288 5.35 22 -0.6970 % 2,544.7
Performance Highlights
Issue Index Change Notes
HSE.PR.C FixedReset Disc -3.09 % YTW SCENARIO
Maturity Type : Limit Maturity
Maturity Date : 2048-10-11
Maturity Price : 23.31
Evaluated at bid price : 23.80
Bid-YTW : 5.80 %
BAM.PR.B Floater -2.83 % YTW SCENARIO
Maturity Type : Limit Maturity
Maturity Date : 2048-10-11
Maturity Price : 17.50
Evaluated at bid price : 17.50
Bid-YTW : 3.72 %
HSE.PR.G FixedReset Prem -2.36 % YTW SCENARIO
Maturity Type : Limit Maturity
Maturity Date : 2048-10-11
Maturity Price : 24.11
Evaluated at bid price : 24.43
Bid-YTW : 6.02 %
PWF.PR.P FixedReset Disc -2.30 % YTW SCENARIO
Maturity Type : Limit Maturity
Maturity Date : 2048-10-11
Maturity Price : 19.15
Evaluated at bid price : 19.15
Bid-YTW : 5.03 %
MFC.PR.N FixedReset Ins Non -2.28 % YTW SCENARIO
Maturity Type : Hard Maturity
Maturity Date : 2025-01-31
Maturity Price : 25.00
Evaluated at bid price : 22.71
Bid-YTW : 6.40 %
MFC.PR.M FixedReset Ins Non -2.19 % YTW SCENARIO
Maturity Type : Hard Maturity
Maturity Date : 2025-01-31
Maturity Price : 25.00
Evaluated at bid price : 22.81
Bid-YTW : 6.44 %
BAM.PR.C Floater -2.04 % YTW SCENARIO
Maturity Type : Limit Maturity
Maturity Date : 2048-10-11
Maturity Price : 17.74
Evaluated at bid price : 17.74
Bid-YTW : 3.67 %
TRP.PR.C FixedReset Disc -2.01 % YTW SCENARIO
Maturity Type : Limit Maturity
Maturity Date : 2048-10-11
Maturity Price : 17.57
Evaluated at bid price : 17.57
Bid-YTW : 5.39 %
BIP.PR.A FixedReset Disc -1.89 % YTW SCENARIO
Maturity Type : Limit Maturity
Maturity Date : 2048-10-11
Maturity Price : 23.51
Evaluated at bid price : 23.88
Bid-YTW : 6.18 %
BMO.PR.T FixedReset Disc -1.85 % YTW SCENARIO
Maturity Type : Limit Maturity
Maturity Date : 2048-10-11
Maturity Price : 22.81
Evaluated at bid price : 23.40
Bid-YTW : 5.01 %
CU.PR.F Perpetual-Discount -1.79 % YTW SCENARIO
Maturity Type : Limit Maturity
Maturity Date : 2048-10-11
Maturity Price : 20.31
Evaluated at bid price : 20.31
Bid-YTW : 5.62 %
RY.PR.M FixedReset Disc -1.67 % YTW SCENARIO
Maturity Type : Limit Maturity
Maturity Date : 2048-10-11
Maturity Price : 23.22
Evaluated at bid price : 24.20
Bid-YTW : 5.07 %
MFC.PR.L FixedReset Ins Non -1.62 % YTW SCENARIO
Maturity Type : Hard Maturity
Maturity Date : 2025-01-31
Maturity Price : 25.00
Evaluated at bid price : 21.85
Bid-YTW : 7.15 %
BAM.PR.X FixedReset Disc -1.46 % YTW SCENARIO
Maturity Type : Limit Maturity
Maturity Date : 2048-10-11
Maturity Price : 18.87
Evaluated at bid price : 18.87
Bid-YTW : 5.26 %
IAG.PR.G FixedReset Ins Non -1.41 % YTW SCENARIO
Maturity Type : Call
Maturity Date : 2022-06-30
Maturity Price : 25.00
Evaluated at bid price : 23.76
Bid-YTW : 5.33 %
SLF.PR.G FixedReset Ins Non -1.40 % YTW SCENARIO
Maturity Type : Hard Maturity
Maturity Date : 2025-01-31
Maturity Price : 25.00
Evaluated at bid price : 19.70
Bid-YTW : 7.77 %
IFC.PR.C FixedReset Ins Non -1.34 % YTW SCENARIO
Maturity Type : Hard Maturity
Maturity Date : 2025-01-31
Maturity Price : 25.00
Evaluated at bid price : 23.55
Bid-YTW : 5.40 %
W.PR.K FixedReset Prem -1.33 % YTW SCENARIO
Maturity Type : Call
Maturity Date : 2021-01-15
Maturity Price : 25.00
Evaluated at bid price : 25.16
Bid-YTW : 4.95 %
PWF.PR.T FixedReset Disc -1.27 % YTW SCENARIO
Maturity Type : Limit Maturity
Maturity Date : 2048-10-11
Maturity Price : 23.17
Evaluated at bid price : 24.09
Bid-YTW : 4.97 %
MFC.PR.F FixedReset Ins Non -1.26 % YTW SCENARIO
Maturity Type : Hard Maturity
Maturity Date : 2025-01-31
Maturity Price : 25.00
Evaluated at bid price : 18.00
Bid-YTW : 9.07 %
BAM.PR.K Floater -1.25 % YTW SCENARIO
Maturity Type : Limit Maturity
Maturity Date : 2048-10-11
Maturity Price : 17.37
Evaluated at bid price : 17.37
Bid-YTW : 3.75 %
BAM.PF.C Perpetual-Discount -1.24 % YTW SCENARIO
Maturity Type : Limit Maturity
Maturity Date : 2048-10-11
Maturity Price : 20.74
Evaluated at bid price : 20.74
Bid-YTW : 5.90 %
BMO.PR.W FixedReset Disc -1.23 % YTW SCENARIO
Maturity Type : Limit Maturity
Maturity Date : 2048-10-11
Maturity Price : 22.75
Evaluated at bid price : 23.26
Bid-YTW : 5.01 %
SLF.PR.H FixedReset Ins Non -1.16 % YTW SCENARIO
Maturity Type : Hard Maturity
Maturity Date : 2025-01-31
Maturity Price : 25.00
Evaluated at bid price : 21.35
Bid-YTW : 6.67 %
TRP.PR.F FloatingReset -1.14 % YTW SCENARIO
Maturity Type : Limit Maturity
Maturity Date : 2048-10-11
Maturity Price : 20.88
Evaluated at bid price : 20.88
Bid-YTW : 4.24 %
BMO.PR.S FixedReset Disc -1.09 % YTW SCENARIO
Maturity Type : Limit Maturity
Maturity Date : 2048-10-11
Maturity Price : 22.94
Evaluated at bid price : 23.64
Bid-YTW : 5.07 %
RY.PR.H FixedReset Disc -1.01 % YTW SCENARIO
Maturity Type : Limit Maturity
Maturity Date : 2048-10-11
Maturity Price : 23.00
Evaluated at bid price : 23.60
Bid-YTW : 4.99 %
MFC.PR.C Deemed-Retractible -1.00 % YTW SCENARIO
Maturity Type : Hard Maturity
Maturity Date : 2025-01-31
Maturity Price : 25.00
Evaluated at bid price : 19.80
Bid-YTW : 9.00 %
MFC.PR.Q FixedReset Ins Non 1.05 % YTW SCENARIO
Maturity Type : Hard Maturity
Maturity Date : 2025-01-31
Maturity Price : 25.00
Evaluated at bid price : 24.00
Bid-YTW : 5.63 %
PWF.PR.A Floater 1.16 % YTW SCENARIO
Maturity Type : Limit Maturity
Maturity Date : 2048-10-11
Maturity Price : 21.49
Evaluated at bid price : 21.75
Bid-YTW : 2.98 %
Volume Highlights
Issue Index Shares
Traded
Notes
BMO.PR.C FixedReset Prem 114,900 YTW SCENARIO
Maturity Type : Call
Maturity Date : 2022-05-25
Maturity Price : 25.00
Evaluated at bid price : 25.26
Bid-YTW : 4.38 %
BNS.PR.Q FixedReset Bank Non 99,100 YTW SCENARIO
Maturity Type : Call
Maturity Date : 2018-11-24
Maturity Price : 25.00
Evaluated at bid price : 24.98
Bid-YTW : 2.98 %
TD.PF.K FixedReset Prem 86,611 YTW SCENARIO
Maturity Type : Call
Maturity Date : 2023-10-31
Maturity Price : 25.00
Evaluated at bid price : 25.07
Bid-YTW : 4.80 %
BIP.PR.F FixedReset Prem 74,852 YTW SCENARIO
Maturity Type : Call
Maturity Date : 2023-12-31
Maturity Price : 25.00
Evaluated at bid price : 25.06
Bid-YTW : 5.17 %
SLF.PR.H FixedReset Ins Non 66,300 YTW SCENARIO
Maturity Type : Hard Maturity
Maturity Date : 2025-01-31
Maturity Price : 25.00
Evaluated at bid price : 21.35
Bid-YTW : 6.67 %
BNS.PR.Z FixedReset Bank Non 63,275 YTW SCENARIO
Maturity Type : Hard Maturity
Maturity Date : 2022-01-31
Maturity Price : 25.00
Evaluated at bid price : 23.69
Bid-YTW : 4.26 %
There were 45 other index-included issues trading in excess of 10,000 shares.
Wide Spread Highlights
Issue Index Quote Data and Yield Notes
HSE.PR.G FixedReset Prem Quote: 24.43 – 25.19
Spot Rate : 0.7600
Average : 0.4468

YTW SCENARIO
Maturity Type : Limit Maturity
Maturity Date : 2048-10-11
Maturity Price : 24.11
Evaluated at bid price : 24.43
Bid-YTW : 6.02 %

BAM.PR.K Floater Quote: 17.37 – 18.32
Spot Rate : 0.9500
Average : 0.6762

YTW SCENARIO
Maturity Type : Limit Maturity
Maturity Date : 2048-10-11
Maturity Price : 17.37
Evaluated at bid price : 17.37
Bid-YTW : 3.75 %

IAG.PR.A Deemed-Retractible Quote: 21.30 – 22.02
Spot Rate : 0.7200
Average : 0.4632

YTW SCENARIO
Maturity Type : Hard Maturity
Maturity Date : 2025-01-31
Maturity Price : 25.00
Evaluated at bid price : 21.30
Bid-YTW : 7.68 %

BAM.PR.B Floater Quote: 17.50 – 18.17
Spot Rate : 0.6700
Average : 0.4484

YTW SCENARIO
Maturity Type : Limit Maturity
Maturity Date : 2048-10-11
Maturity Price : 17.50
Evaluated at bid price : 17.50
Bid-YTW : 3.72 %

MFC.PR.M FixedReset Ins Non Quote: 22.81 – 23.43
Spot Rate : 0.6200
Average : 0.4056

YTW SCENARIO
Maturity Type : Hard Maturity
Maturity Date : 2025-01-31
Maturity Price : 25.00
Evaluated at bid price : 22.81
Bid-YTW : 6.44 %

CU.PR.F Perpetual-Discount Quote: 20.31 – 20.88
Spot Rate : 0.5700
Average : 0.3788

YTW SCENARIO
Maturity Type : Limit Maturity
Maturity Date : 2048-10-11
Maturity Price : 20.31
Evaluated at bid price : 20.31
Bid-YTW : 5.62 %

October 10, 2018

Wednesday, October 10th, 2018

Carnage and ruin today:

Wall Street suffered its worst day in eight months on Wednesday, and the TSX didn’t do much better, suggesting that the new North American trade agreement and the parade of upbeat U.S. economic reports have taken a back seat to what investors fear is coming next: Rising borrowing costs and squeezed profit margins.

Global stocks were pummeled just days after U.S. indexes celebrated fresh record highs, amid simmering concerns about rising bond yields, increased trade tensions between China and the United States and speculation that corporate financial results will soon disappoint. U.S. technology stocks and Canadian energy names were among equities hardest hit.

The S&P 500 fell 94.66 points, or 3.3 per cent, to 2785.68, touching a three-month low. The Dow Jones Industrial Average fell 831.83 points or 3.2 per cent, to 25,598.74.

The turbulence occurred well beyond U.S. markets though. U.K. stocks fell 1.3 per cent and German stocks fell 2.2 per cent.

In Canada, the S&P/TSX Composite Index fell 336.65 points or 2.1 per cent, to 15,517.40. The latest dip continued a losing streak for Canadian stocks that began last week soon after political leaders tentatively agreed to the United States-Mexico-Canada Agreement (USMCA), removing a key concern over North American trade.

Wes Gray had some interesting remarks in the Globe, by which I mean I agree with them:

Despite heightened awareness around fees and their power to destroy long-term returns, Canadians saving for retirement are still parking their money in traditional mutual funds, the vast majority of which carry management expense ratios of 2 per cent or more. “Down in the States, if you had a fund that charged 2 per cent plus, you’d get murdered,” Mr. Gray said.

In the U.S., everything’s getting more transparent. Canadians are pretty bright folks and yet their financial system is like North Korea. We know the reason – the banks control everything. Canada just seems so prime to move into the future but for some reason it’s slow on the uptake. A lot of it comes down to distribution channels where you never get to see the real fees. We would love to help people be more cognizant of fees and not just believing whatever the bankers are telling you.

The FDIC has released a paper by Haelim Anderson, Daniel Barth and Dong Beom Choi titled Reducing Moral Hazard at the Expense of Market Discipline: The Effectiveness of Double Liability Before and During the Great Depression:

Prior to the Great Depression, regulators imposed double liability on bank shareholders to ensure financial stability and protect depositors. Under double liability, shareholders of failing banks lost their initial investment and had to pay up to the par value of the stock in order to compensate depositors.We examine whether double liability was effective at mitigating bank risks and providing a safety net for depositors before and during the Great Depression. We first develop a model that demonstrates two competing effects of double liability: a direct effect that constrains bank risk-taking due to increased skin in the game, and an indirect effect that promotes risk-taking due to weaker monitoring by better-protected depositors. We then test the model’s predictions using a novel identification strategy that compares state Federal Reserve member banks and national banks in New York and New Jersey. We find no evidence that double liability reduced bank risk prior to the Great Depression, but do find evidence that deposits in double-liability banks were stickier and less susceptible to runs during the Great Depression. Our findings suggest that the banking system was inherently fragile under double liability because of the conflict between shareholder incentive alignment and depositor market discipline; the depositor protection feature of double liability reduced the threat of funding outflows but may have undermined its effectiveness as a regulatory tool for reducing bank risk.

In this paper, we study the effectiveness of double liability as a regulatory tool for reducing bank risk and as a safety net for protecting depositors. We begin by providing a simple model that characterizes two competing effects of double liability on bank risk-taking. The first is a reduction in moral hazard that results from shareholders’ increased skin in the game (Esty (1998), Grossman (2001), Mitchener and Richardson (2013), Koudijs, Salisbury, and Sran (2018)). However, double liability also reduces market discipline by depositors, who receive more protection from losses in the event of a bank failure. All else equal, this weakened market discipline may actually promote bank risk-taking.

Actually, the first question that occurs to me is: how seriously can we take the shareholders’ promise to pony up cash for a failed enterprise? Early in my career I was fascinated by the Husky Energy deposit receipt fiasco, in which deposit receipts were issued for $X at a time when the stock was trading at $2X (the remaining $X of the share purchase price was due about a year later; it was a forward contract, not an option!). The stock promptly fell below $X, resulting in a negative value for the deposit receipts and with much excitement trading began with negative prices … i.e., the purchaser of a receipt got the position AND a sum of money from the seller.

I’ve never been able to find anything on the internet about this, presumably because it happened before the internet existed. The regulators should be funding and publicizing a study on the matter, but you’re going to have to search a long time before you find a regulator with any interest in doing a decent job.

There were a LOT of defaults when the receipts came due; it proved to be difficult to find many of the purchasers whose only known address was a foreign post-office box. I wouldn’t put any credence in any promises to pay double liability unless there was a ferocious regulatory regime in which the depositaries required a matching cash deposit at all times, which kind of defeats the purpose of setting up the system as a ‘capital call’ in the first place.

PerpetualDiscounts now yield 5.65%, equivalent to 7.34% at the standard equivalency factor of 1.3x. Long corporates now yield a little more than 4.20%, so the pre-tax, interest-equivalent spread (in this context, the “Seniority Spread”) is now about 315bp, a slight (and perhaps spurious) widening from the 310bp reported October 3.

So, to answer Assiduous Reader MF, who asked:

I am surprised by the resilience of perpetual prices. I thought that with increased long bond rates that they would drop.

… PerpetualDiscounts are basically maintaining their spreads against long corporates, which is more or less what they should be doing. I expect some narrowing of spreads as overall yield conditions normalize, but we haven’t seen it yet!

HIMIPref™ Preferred Indices
These values reflect the December 2008 revision of the HIMIPref™ Indices

Values are provisional and are finalized monthly
Index Mean
Current
Yield
(at bid)
Median
YTW
Median
Average
Trading
Value
Median
Mod Dur
(YTW)
Issues Day’s Perf. Index Value
Ratchet 0.00 % 0.00 % 0 0.00 0 -1.6606 % 3,154.8
FixedFloater 0.00 % 0.00 % 0 0.00 0 -1.6606 % 5,788.9
Floater 3.44 % 3.59 % 39,543 18.33 4 -1.6606 % 3,336.2
OpRet 0.00 % 0.00 % 0 0.00 0 0.2859 % 3,233.0
SplitShare 4.60 % 4.59 % 55,520 4.74 5 0.2859 % 3,860.9
Interest-Bearing 0.00 % 0.00 % 0 0.00 0 0.2859 % 3,012.4
Perpetual-Premium 5.60 % -2.28 % 59,026 0.14 12 -0.0861 % 2,921.7
Perpetual-Discount 5.52 % 5.65 % 64,850 14.44 21 -0.3137 % 2,968.4
FixedReset Disc 4.16 % 5.11 % 131,339 15.23 43 0.2039 % 2,605.9
Deemed-Retractible 5.26 % 6.18 % 66,397 5.29 27 -0.0351 % 2,941.3
FloatingReset 3.55 % 3.74 % 40,542 5.58 4 -0.3104 % 2,869.4
FixedReset Prem 4.87 % 4.23 % 220,629 2.84 34 -0.0092 % 2,570.9
FixedReset Bank Non 3.20 % 3.98 % 67,521 0.37 9 -0.0316 % 2,579.1
FixedReset Ins Non 4.38 % 5.38 % 100,084 5.32 22 0.0745 % 2,562.5
Performance Highlights
Issue Index Change Notes
BAM.PR.K Floater -3.51 % YTW SCENARIO
Maturity Type : Limit Maturity
Maturity Date : 2048-10-10
Maturity Price : 17.59
Evaluated at bid price : 17.59
Bid-YTW : 3.70 %
CU.PR.G Perpetual-Discount -1.68 % YTW SCENARIO
Maturity Type : Limit Maturity
Maturity Date : 2048-10-10
Maturity Price : 20.50
Evaluated at bid price : 20.50
Bid-YTW : 5.57 %
PWF.PR.A Floater -1.65 % YTW SCENARIO
Maturity Type : Limit Maturity
Maturity Date : 2048-10-10
Maturity Price : 21.50
Evaluated at bid price : 21.50
Bid-YTW : 3.04 %
PWF.PR.Q FloatingReset -1.61 % YTW SCENARIO
Maturity Type : Limit Maturity
Maturity Date : 2048-10-10
Maturity Price : 21.35
Evaluated at bid price : 21.35
Bid-YTW : 3.74 %
MFC.PR.N FixedReset Ins Non -1.11 % YTW SCENARIO
Maturity Type : Hard Maturity
Maturity Date : 2025-01-31
Maturity Price : 25.00
Evaluated at bid price : 23.24
Bid-YTW : 5.97 %
PWF.PR.L Perpetual-Discount -1.10 % YTW SCENARIO
Maturity Type : Limit Maturity
Maturity Date : 2048-10-10
Maturity Price : 22.18
Evaluated at bid price : 22.46
Bid-YTW : 5.68 %
MFC.PR.Q FixedReset Ins Non -1.08 % YTW SCENARIO
Maturity Type : Hard Maturity
Maturity Date : 2025-01-31
Maturity Price : 25.00
Evaluated at bid price : 23.75
Bid-YTW : 5.82 %
SLF.PR.E Deemed-Retractible -1.05 % YTW SCENARIO
Maturity Type : Hard Maturity
Maturity Date : 2025-01-31
Maturity Price : 25.00
Evaluated at bid price : 20.78
Bid-YTW : 8.03 %
PWF.PR.P FixedReset Disc -1.01 % YTW SCENARIO
Maturity Type : Limit Maturity
Maturity Date : 2048-10-10
Maturity Price : 19.60
Evaluated at bid price : 19.60
Bid-YTW : 4.91 %
RY.PR.H FixedReset Disc 1.02 % YTW SCENARIO
Maturity Type : Limit Maturity
Maturity Date : 2048-10-10
Maturity Price : 23.24
Evaluated at bid price : 23.84
Bid-YTW : 4.94 %
MFC.PR.B Deemed-Retractible 1.02 % YTW SCENARIO
Maturity Type : Hard Maturity
Maturity Date : 2025-01-31
Maturity Price : 25.00
Evaluated at bid price : 20.71
Bid-YTW : 8.30 %
PVS.PR.F SplitShare 1.03 % YTW SCENARIO
Maturity Type : Hard Maturity
Maturity Date : 2024-09-30
Maturity Price : 25.00
Evaluated at bid price : 25.41
Bid-YTW : 4.59 %
GWO.PR.N FixedReset Ins Non 1.08 % YTW SCENARIO
Maturity Type : Hard Maturity
Maturity Date : 2025-01-31
Maturity Price : 25.00
Evaluated at bid price : 18.80
Bid-YTW : 8.26 %
GWO.PR.P Deemed-Retractible 1.20 % YTW SCENARIO
Maturity Type : Hard Maturity
Maturity Date : 2025-01-31
Maturity Price : 25.00
Evaluated at bid price : 24.41
Bid-YTW : 5.92 %
RY.PR.J FixedReset Disc 1.35 % YTW SCENARIO
Maturity Type : Call
Maturity Date : 2020-05-24
Maturity Price : 25.00
Evaluated at bid price : 24.79
Bid-YTW : 4.45 %
BAM.PR.X FixedReset Disc 1.48 % YTW SCENARIO
Maturity Type : Limit Maturity
Maturity Date : 2048-10-10
Maturity Price : 19.15
Evaluated at bid price : 19.15
Bid-YTW : 5.18 %
MFC.PR.H FixedReset Ins Non 1.53 % YTW SCENARIO
Maturity Type : Hard Maturity
Maturity Date : 2025-01-31
Maturity Price : 25.00
Evaluated at bid price : 24.60
Bid-YTW : 5.99 %
Volume Highlights
Issue Index Shares
Traded
Notes
CM.PR.S FixedReset Disc 99,690 YTW SCENARIO
Maturity Type : Limit Maturity
Maturity Date : 2048-10-10
Maturity Price : 22.81
Evaluated at bid price : 23.97
Bid-YTW : 4.96 %
MFC.PR.G FixedReset Ins Non 75,497 YTW SCENARIO
Maturity Type : Call
Maturity Date : 2021-12-19
Maturity Price : 25.00
Evaluated at bid price : 24.15
Bid-YTW : 5.16 %
MFC.PR.O FixedReset Ins Non 72,540 YTW SCENARIO
Maturity Type : Call
Maturity Date : 2021-06-19
Maturity Price : 25.00
Evaluated at bid price : 25.80
Bid-YTW : 4.49 %
TRP.PR.A FixedReset Disc 65,050 YTW SCENARIO
Maturity Type : Limit Maturity
Maturity Date : 2048-10-10
Maturity Price : 20.60
Evaluated at bid price : 20.60
Bid-YTW : 5.25 %
BMO.PR.D FixedReset Prem 62,849 YTW SCENARIO
Maturity Type : Call
Maturity Date : 2022-08-25
Maturity Price : 25.00
Evaluated at bid price : 25.20
Bid-YTW : 4.36 %
BMO.PR.E FixedReset Prem 61,309 YTW SCENARIO
Maturity Type : Call
Maturity Date : 2023-11-25
Maturity Price : 25.00
Evaluated at bid price : 25.40
Bid-YTW : 4.59 %
There were 45 other index-included issues trading in excess of 10,000 shares.
Wide Spread Highlights
Issue Index Quote Data and Yield Notes
MFC.PR.C Deemed-Retractible Quote: 20.00 – 21.19
Spot Rate : 1.1900
Average : 0.7515

YTW SCENARIO
Maturity Type : Hard Maturity
Maturity Date : 2025-01-31
Maturity Price : 25.00
Evaluated at bid price : 20.00
Bid-YTW : 8.80 %

MFC.PR.R FixedReset Ins Non Quote: 25.23 – 25.90
Spot Rate : 0.6700
Average : 0.3672

YTW SCENARIO
Maturity Type : Call
Maturity Date : 2022-03-19
Maturity Price : 25.00
Evaluated at bid price : 25.23
Bid-YTW : 4.67 %

BAM.PR.K Floater Quote: 17.59 – 18.20
Spot Rate : 0.6100
Average : 0.3759

YTW SCENARIO
Maturity Type : Limit Maturity
Maturity Date : 2048-10-10
Maturity Price : 17.59
Evaluated at bid price : 17.59
Bid-YTW : 3.70 %

TD.PF.D FixedReset Disc Quote: 24.57 – 25.00
Spot Rate : 0.4300
Average : 0.2651

YTW SCENARIO
Maturity Type : Call
Maturity Date : 2020-07-31
Maturity Price : 25.00
Evaluated at bid price : 24.57
Bid-YTW : 4.50 %

PWF.PR.A Floater Quote: 21.50 – 21.90
Spot Rate : 0.4000
Average : 0.2894

YTW SCENARIO
Maturity Type : Limit Maturity
Maturity Date : 2048-10-10
Maturity Price : 21.50
Evaluated at bid price : 21.50
Bid-YTW : 3.04 %

CM.PR.Q FixedReset Disc Quote: 24.61 – 24.97
Spot Rate : 0.3600
Average : 0.2572

YTW SCENARIO
Maturity Type : Call
Maturity Date : 2020-07-31
Maturity Price : 25.00
Evaluated at bid price : 24.61
Bid-YTW : 4.41 %

October 9, 2018

Tuesday, October 9th, 2018

Three cheers for well thought out financial controls!

Prosecutors in Copenhagen say it was an elaborate ruse, one that ultimately cost taxpayers more than $2 billion — a spectacular sum for Denmark, the equivalent of a $110 billion loss in the far larger American economy.

The country had fallen victim to a dubious financial maneuver at the intersection of the tax system and capital markets, a dizzyingly complex transaction known as a “cum-ex” trade.

The trade is focused on one of the dullest, most overlooked acts in any financial system — the request for refunds on taxes withheld on dividends. Under Danish law, the government automatically collects taxes on dividends paid out by companies to their shareholders. If the shareholders live in the United States, they are eligible for a refund on some or all of those taxes.

A tiny department in SKAT, run by one man, approved thousands of applications for refunds.

After the financial meltdown, dozens of German banks desperate for a new source of profits eagerly facilitated cum-ex trades, fueled by capital from all over the world.

Traders made off with more than $11 billion, according to officials there. Cum-ex would reap fortunes from the governments in Austria, Belgium and Switzerland, too.

In 2013, all that stood between Solo Capital and Denmark’s treasury was the bespectacled, gray-haired veteran of SKAT, Sven Nielsen. After two colleagues retired, he was the last person in the Dividend Department. Complicating matters, he lacked the tools to perform the most basic due diligence when reviewing refund applications.

The agency was in the midst of a yearslong and often disastrous overhaul, meant to digitize the system and reduce head count. The priority was helping Danish taxpayers, not foreign shareholders. Mr. Nielsen didn’t even have a database to check whether an individual pension plan actually owned the shares it claimed, said Lisbeth Romer, who was Mr. Nielsen’s boss until she retired in 2013.

“Sven’s job was reduced to bookkeeping, essentially, checking if a form was filled out properly,” she said. “A monkey could do it.”

I don’t get it, I really don’t. If the fraud is for a few million, OK. It happens. Figure out how it happened, plug the hole and try to catch the perpetuators. But $2-billion in a small economy? Didn’t anybody notice there was a tiny little discrepancy between the amount of dividend taxes withheld and the amount of the total claims on that money?

It reminds me of the Barings Bank fiasco, in which every single senior manager and executive solemnly swore that yes, they knew Nick Leeson, one single guy on a sleepy arbitrage desk, was making roughly 25% of the bank’s reported profit. No, they had no idea of how he was doing it. Clowns. They should be grateful I’ve considered them grossly incompetent, because they wouldn’t like the other choice so much.

HIMIPref™ Preferred Indices
These values reflect the December 2008 revision of the HIMIPref™ Indices

Values are provisional and are finalized monthly
Index Mean
Current
Yield
(at bid)
Median
YTW
Median
Average
Trading
Value
Median
Mod Dur
(YTW)
Issues Day’s Perf. Index Value
Ratchet 0.00 % 0.00 % 0 0.00 0 -0.3128 % 3,208.1
FixedFloater 0.00 % 0.00 % 0 0.00 0 -0.3128 % 5,886.7
Floater 3.39 % 3.57 % 40,175 18.38 4 -0.3128 % 3,392.5
OpRet 0.00 % 0.00 % 0 0.00 0 -0.1902 % 3,223.8
SplitShare 4.62 % 4.79 % 53,939 4.74 5 -0.1902 % 3,849.9
Interest-Bearing 0.00 % 0.00 % 0 0.00 0 -0.1902 % 3,003.8
Perpetual-Premium 5.60 % -5.76 % 69,250 0.09 12 -0.0286 % 2,924.2
Perpetual-Discount 5.51 % 5.61 % 65,505 14.50 21 -0.2381 % 2,977.7
FixedReset Disc 4.17 % 5.11 % 131,496 15.28 43 -0.2796 % 2,600.6
Deemed-Retractible 5.26 % 6.20 % 62,364 5.29 27 -0.9338 % 2,942.3
FloatingReset 3.54 % 3.65 % 41,945 5.59 4 -0.1018 % 2,878.3
FixedReset Prem 4.87 % 4.19 % 221,293 2.85 34 -0.0847 % 2,571.2
FixedReset Bank Non 3.19 % 3.85 % 66,982 0.37 9 -0.0079 % 2,579.9
FixedReset Ins Non 4.39 % 5.46 % 95,804 5.24 22 0.0118 % 2,560.6
Performance Highlights
Issue Index Change Notes
GWO.PR.H Deemed-Retractible -2.79 % YTW SCENARIO
Maturity Type : Hard Maturity
Maturity Date : 2025-01-31
Maturity Price : 25.00
Evaluated at bid price : 21.59
Bid-YTW : 7.69 %
GWO.PR.R Deemed-Retractible -2.67 % YTW SCENARIO
Maturity Type : Hard Maturity
Maturity Date : 2025-01-31
Maturity Price : 25.00
Evaluated at bid price : 21.53
Bid-YTW : 7.69 %
GWO.PR.P Deemed-Retractible -2.55 % YTW SCENARIO
Maturity Type : Hard Maturity
Maturity Date : 2025-01-31
Maturity Price : 25.00
Evaluated at bid price : 24.12
Bid-YTW : 6.15 %
MFC.PR.B Deemed-Retractible -2.38 % YTW SCENARIO
Maturity Type : Hard Maturity
Maturity Date : 2025-01-31
Maturity Price : 25.00
Evaluated at bid price : 20.50
Bid-YTW : 8.49 %
SLF.PR.C Deemed-Retractible -2.13 % YTW SCENARIO
Maturity Type : Hard Maturity
Maturity Date : 2025-01-31
Maturity Price : 25.00
Evaluated at bid price : 20.69
Bid-YTW : 8.05 %
SLF.PR.D Deemed-Retractible -2.13 % YTW SCENARIO
Maturity Type : Hard Maturity
Maturity Date : 2025-01-31
Maturity Price : 25.00
Evaluated at bid price : 20.69
Bid-YTW : 8.05 %
SLF.PR.B Deemed-Retractible -2.01 % YTW SCENARIO
Maturity Type : Hard Maturity
Maturity Date : 2025-01-31
Maturity Price : 25.00
Evaluated at bid price : 21.90
Bid-YTW : 7.36 %
TRP.PR.C FixedReset Disc -1.77 % YTW SCENARIO
Maturity Type : Limit Maturity
Maturity Date : 2048-10-09
Maturity Price : 17.78
Evaluated at bid price : 17.78
Bid-YTW : 5.32 %
BAM.PR.X FixedReset Disc -1.72 % YTW SCENARIO
Maturity Type : Limit Maturity
Maturity Date : 2048-10-09
Maturity Price : 18.87
Evaluated at bid price : 18.87
Bid-YTW : 5.26 %
TRP.PR.G FixedReset Disc -1.69 % YTW SCENARIO
Maturity Type : Call
Maturity Date : 2020-11-30
Maturity Price : 25.00
Evaluated at bid price : 24.41
Bid-YTW : 5.20 %
TRP.PR.B FixedReset Disc -1.48 % YTW SCENARIO
Maturity Type : Limit Maturity
Maturity Date : 2048-10-09
Maturity Price : 17.30
Evaluated at bid price : 17.30
Bid-YTW : 5.23 %
RY.PR.J FixedReset Disc -1.45 % YTW SCENARIO
Maturity Type : Limit Maturity
Maturity Date : 2048-10-09
Maturity Price : 24.13
Evaluated at bid price : 24.46
Bid-YTW : 5.21 %
IAG.PR.A Deemed-Retractible -1.43 % YTW SCENARIO
Maturity Type : Hard Maturity
Maturity Date : 2025-01-31
Maturity Price : 25.00
Evaluated at bid price : 21.44
Bid-YTW : 7.54 %
MFC.PR.H FixedReset Ins Non -1.38 % YTW SCENARIO
Maturity Type : Hard Maturity
Maturity Date : 2025-01-31
Maturity Price : 25.00
Evaluated at bid price : 24.23
Bid-YTW : 6.28 %
W.PR.K FixedReset Prem -1.35 % YTW SCENARIO
Maturity Type : Call
Maturity Date : 2021-01-15
Maturity Price : 25.00
Evaluated at bid price : 25.50
Bid-YTW : 4.30 %
GWO.PR.I Deemed-Retractible -1.34 % YTW SCENARIO
Maturity Type : Hard Maturity
Maturity Date : 2025-01-31
Maturity Price : 25.00
Evaluated at bid price : 20.59
Bid-YTW : 8.20 %
GWO.PR.G Deemed-Retractible -1.30 % YTW SCENARIO
Maturity Type : Hard Maturity
Maturity Date : 2025-01-31
Maturity Price : 25.00
Evaluated at bid price : 23.47
Bid-YTW : 6.46 %
GWO.PR.S Deemed-Retractible -1.23 % YTW SCENARIO
Maturity Type : Hard Maturity
Maturity Date : 2025-01-31
Maturity Price : 25.00
Evaluated at bid price : 24.00
Bid-YTW : 6.09 %
HSE.PR.E FixedReset Prem -1.15 % YTW SCENARIO
Maturity Type : Call
Maturity Date : 2020-03-31
Maturity Price : 25.00
Evaluated at bid price : 25.01
Bid-YTW : 4.58 %
CU.PR.F Perpetual-Discount -1.14 % YTW SCENARIO
Maturity Type : Limit Maturity
Maturity Date : 2048-10-09
Maturity Price : 20.75
Evaluated at bid price : 20.75
Bid-YTW : 5.50 %
BAM.PF.F FixedReset Disc -1.13 % YTW SCENARIO
Maturity Type : Limit Maturity
Maturity Date : 2048-10-09
Maturity Price : 24.13
Evaluated at bid price : 24.59
Bid-YTW : 5.39 %
BAM.PR.R FixedReset Disc -1.09 % YTW SCENARIO
Maturity Type : Limit Maturity
Maturity Date : 2048-10-09
Maturity Price : 20.95
Evaluated at bid price : 20.95
Bid-YTW : 5.40 %
MFC.PR.Q FixedReset Ins Non -1.03 % YTW SCENARIO
Maturity Type : Hard Maturity
Maturity Date : 2025-01-31
Maturity Price : 25.00
Evaluated at bid price : 24.01
Bid-YTW : 5.61 %
POW.PR.B Perpetual-Discount -1.00 % YTW SCENARIO
Maturity Type : Limit Maturity
Maturity Date : 2048-10-09
Maturity Price : 23.39
Evaluated at bid price : 23.68
Bid-YTW : 5.67 %
TD.PF.B FixedReset Disc 1.13 % YTW SCENARIO
Maturity Type : Limit Maturity
Maturity Date : 2048-10-09
Maturity Price : 23.01
Evaluated at bid price : 23.63
Bid-YTW : 4.94 %
TD.PF.C FixedReset Disc 1.66 % YTW SCENARIO
Maturity Type : Limit Maturity
Maturity Date : 2048-10-09
Maturity Price : 22.79
Evaluated at bid price : 23.25
Bid-YTW : 4.98 %
IAG.PR.G FixedReset Ins Non 2.29 % YTW SCENARIO
Maturity Type : Call
Maturity Date : 2022-06-30
Maturity Price : 25.00
Evaluated at bid price : 24.10
Bid-YTW : 4.90 %
TD.PF.J FixedReset Prem 4.56 % YTW SCENARIO
Maturity Type : Call
Maturity Date : 2023-04-30
Maturity Price : 25.00
Evaluated at bid price : 25.22
Bid-YTW : 4.44 %
Volume Highlights
Issue Index Shares
Traded
Notes
TD.PF.K FixedReset Prem 211,995 YTW SCENARIO
Maturity Type : Call
Maturity Date : 2023-10-31
Maturity Price : 25.00
Evaluated at bid price : 25.05
Bid-YTW : 4.81 %
MFC.PR.R FixedReset Ins Non 132,934 YTW SCENARIO
Maturity Type : Call
Maturity Date : 2022-03-19
Maturity Price : 25.00
Evaluated at bid price : 25.19
Bid-YTW : 4.72 %
CM.PR.P FixedReset Disc 75,400 YTW SCENARIO
Maturity Type : Limit Maturity
Maturity Date : 2048-10-09
Maturity Price : 22.61
Evaluated at bid price : 23.06
Bid-YTW : 5.00 %
RY.PR.Q FixedReset Prem 73,871 YTW SCENARIO
Maturity Type : Call
Maturity Date : 2021-05-24
Maturity Price : 25.00
Evaluated at bid price : 26.35
Bid-YTW : 3.62 %
MFC.PR.I FixedReset Ins Non 67,763 YTW SCENARIO
Maturity Type : Call
Maturity Date : 2022-09-19
Maturity Price : 25.00
Evaluated at bid price : 24.40
Bid-YTW : 5.13 %
BAM.PR.R FixedReset Disc 55,925 YTW SCENARIO
Maturity Type : Limit Maturity
Maturity Date : 2048-10-09
Maturity Price : 20.95
Evaluated at bid price : 20.95
Bid-YTW : 5.40 %
There were 45 other index-included issues trading in excess of 10,000 shares.
Wide Spread Highlights
Issue Index Quote Data and Yield Notes
MFC.PR.K FixedReset Ins Non Quote: 21.87 – 23.99
Spot Rate : 2.1200
Average : 1.1651

YTW SCENARIO
Maturity Type : Hard Maturity
Maturity Date : 2025-01-31
Maturity Price : 25.00
Evaluated at bid price : 21.87
Bid-YTW : 7.27 %

MFC.PR.H FixedReset Ins Non Quote: 24.23 – 25.45
Spot Rate : 1.2200
Average : 0.8331

YTW SCENARIO
Maturity Type : Hard Maturity
Maturity Date : 2025-01-31
Maturity Price : 25.00
Evaluated at bid price : 24.23
Bid-YTW : 6.28 %

MFC.PR.G FixedReset Ins Non Quote: 24.02 – 24.89
Spot Rate : 0.8700
Average : 0.5433

YTW SCENARIO
Maturity Type : Call
Maturity Date : 2021-12-19
Maturity Price : 25.00
Evaluated at bid price : 24.02
Bid-YTW : 5.34 %

GWO.PR.H Deemed-Retractible Quote: 21.59 – 22.30
Spot Rate : 0.7100
Average : 0.4580

YTW SCENARIO
Maturity Type : Hard Maturity
Maturity Date : 2025-01-31
Maturity Price : 25.00
Evaluated at bid price : 21.59
Bid-YTW : 7.69 %

GWO.PR.I Deemed-Retractible Quote: 20.59 – 21.23
Spot Rate : 0.6400
Average : 0.4015

YTW SCENARIO
Maturity Type : Hard Maturity
Maturity Date : 2025-01-31
Maturity Price : 25.00
Evaluated at bid price : 20.59
Bid-YTW : 8.20 %

GWO.PR.P Deemed-Retractible Quote: 24.12 – 24.59
Spot Rate : 0.4700
Average : 0.2904

YTW SCENARIO
Maturity Type : Hard Maturity
Maturity Date : 2025-01-31
Maturity Price : 25.00
Evaluated at bid price : 24.12
Bid-YTW : 6.15 %

October 5, 2018

Friday, October 5th, 2018

The American jobs report yielded signs that the labour market has reached an inflection point:

The jobs report came in below expectations, but wasn’t a major headline grabber, even as unemployment dropped to its lowest rate since 1969, as the strong labor market is well known at this point.

The most notable aspect of the report was the strong sequential wage trends “that put wage growth on track to cross 3% in October, supported by broadening wage pressures across sectors,” writes Morgan Stanley ’s Robert Rosener.

… which had an effect on Treasuries:

Treasury yields hit fresh multiyear peaks on Friday, extending their weeklong ascent, after a key jobs report showed tightening labor markets were leading to wage gains—a bearish development for bond bulls.

The Bureau of Labor Statistics reported the U.S. had added 134,000 jobs in September, below the 168,000 jobs expected from economists polled by MarketWatch. July’s and August’s numbers were increased. The unemployment rate fell to 3.7%, its lowest level since 1969. While, the average hourly earnings rose 0.3%, after a stellar 0.4% gain the previous month.

The 10-year Treasury note yield … rose 3 basis points to a seven-year high of 3.227%, contributing to a weeklong climb of 17.1 basis points, its largest such rise since February. The 30-year bond yield … rose 4.2 basis points to 3.396%, extending its weeklong rise to 20 basis points, its biggest such climb since the week of President Donald Trump’s election.

The shorter-end of the bond market showed a more modest rise. The 2-year note yield … rose 0.8 basis point to 2.888%, its highest since 2008. The short-dated maturity posted a weeklong yield gain of 7 basis points. Bond prices move in the opposite direction of yields.

In Canada we’re still grinding away at unemployment:

Canada’s job market gained 63,000 positions in September, edging the unemployment rate lower to 5.9 per cent, and offsetting job losses in August, Statistics Canada reported Friday.

September’s increase in employment was largely driven by gains in part-time work, with part-time jobs up by around 80,000, the agency said in its monthly labour force survey.

And Five-year Canadas popped up to 2.49% to close the week.

The increase in yields must have been good for FixedResets, eh? Well … um … profit-taking! FixedResets were hit by profit-taking! Unless it was something else. Manulife issues got whacked … perhaps by those pesky short-sellers. No wonder Elon Musk hates them so much!

HIMIPref™ Preferred Indices
These values reflect the December 2008 revision of the HIMIPref™ Indices

Values are provisional and are finalized monthly
Index Mean
Current
Yield
(at bid)
Median
YTW
Median
Average
Trading
Value
Median
Mod Dur
(YTW)
Issues Day’s Perf. Index Value
Ratchet 0.00 % 0.00 % 0 0.00 0 0.4188 % 3,218.2
FixedFloater 0.00 % 0.00 % 0 0.00 0 0.4188 % 5,905.2
Floater 3.38 % 3.55 % 38,853 18.44 4 0.4188 % 3,403.2
OpRet 0.00 % 0.00 % 0 0.00 0 0.0793 % 3,229.9
SplitShare 4.61 % 4.70 % 55,232 4.75 5 0.0793 % 3,857.2
Interest-Bearing 0.00 % 0.00 % 0 0.00 0 0.0793 % 3,009.6
Perpetual-Premium 5.56 % -3.24 % 53,999 0.09 12 -0.0427 % 2,925.0
Perpetual-Discount 5.47 % 5.61 % 64,321 14.48 21 -0.3500 % 2,984.8
FixedReset Disc 4.16 % 4.95 % 129,773 15.48 43 -0.2507 % 2,607.9
Deemed-Retractible 5.21 % 6.19 % 62,162 5.31 27 -0.5656 % 2,970.1
FloatingReset 3.43 % 3.57 % 41,538 5.62 4 0.2991 % 2,881.3
FixedReset Prem 4.86 % 3.94 % 219,806 2.83 34 -0.1892 % 2,573.4
FixedReset Bank Non 3.19 % 3.91 % 67,893 0.38 9 0.0994 % 2,580.1
FixedReset Ins Non 4.37 % 5.37 % 94,885 5.40 22 -1.5035 % 2,560.3
Performance Highlights
Issue Index Change Notes
TD.PF.J FixedReset Prem -4.20 % YTW SCENARIO
Maturity Type : Limit Maturity
Maturity Date : 2048-10-05
Maturity Price : 22.97
Evaluated at bid price : 24.40
Bid-YTW : 5.07 %
MFC.PR.K FixedReset Ins Non -4.17 % YTW SCENARIO
Maturity Type : Hard Maturity
Maturity Date : 2025-01-31
Maturity Price : 25.00
Evaluated at bid price : 22.04
Bid-YTW : 6.96 %
MFC.PR.B Deemed-Retractible -3.23 % YTW SCENARIO
Maturity Type : Hard Maturity
Maturity Date : 2025-01-31
Maturity Price : 25.00
Evaluated at bid price : 21.00
Bid-YTW : 8.01 %
MFC.PR.L FixedReset Ins Non -3.16 % YTW SCENARIO
Maturity Type : Hard Maturity
Maturity Date : 2025-01-31
Maturity Price : 25.00
Evaluated at bid price : 22.40
Bid-YTW : 6.53 %
MFC.PR.C Deemed-Retractible -3.07 % YTW SCENARIO
Maturity Type : Hard Maturity
Maturity Date : 2025-01-31
Maturity Price : 25.00
Evaluated at bid price : 20.21
Bid-YTW : 8.58 %
MFC.PR.H FixedReset Ins Non -2.89 % YTW SCENARIO
Maturity Type : Hard Maturity
Maturity Date : 2025-01-31
Maturity Price : 25.00
Evaluated at bid price : 24.57
Bid-YTW : 5.86 %
MFC.PR.I FixedReset Ins Non -2.65 % YTW SCENARIO
Maturity Type : Call
Maturity Date : 2022-09-19
Maturity Price : 25.00
Evaluated at bid price : 24.28
Bid-YTW : 5.25 %
MFC.PR.R FixedReset Ins Non -2.63 % YTW SCENARIO
Maturity Type : Call
Maturity Date : 2022-03-19
Maturity Price : 25.00
Evaluated at bid price : 25.21
Bid-YTW : 4.68 %
MFC.PR.O FixedReset Ins Non -2.55 % YTW SCENARIO
Maturity Type : Call
Maturity Date : 2021-06-19
Maturity Price : 25.00
Evaluated at bid price : 25.63
Bid-YTW : 4.73 %
MFC.PR.G FixedReset Ins Non -2.47 % YTW SCENARIO
Maturity Type : Call
Maturity Date : 2021-12-19
Maturity Price : 25.00
Evaluated at bid price : 24.07
Bid-YTW : 5.25 %
IAG.PR.G FixedReset Ins Non -2.40 % YTW SCENARIO
Maturity Type : Hard Maturity
Maturity Date : 2025-01-31
Maturity Price : 25.00
Evaluated at bid price : 23.56
Bid-YTW : 5.46 %
MFC.PR.M FixedReset Ins Non -2.39 % YTW SCENARIO
Maturity Type : Hard Maturity
Maturity Date : 2025-01-31
Maturity Price : 25.00
Evaluated at bid price : 23.30
Bid-YTW : 5.91 %
MFC.PR.Q FixedReset Ins Non -2.37 % YTW SCENARIO
Maturity Type : Hard Maturity
Maturity Date : 2025-01-31
Maturity Price : 25.00
Evaluated at bid price : 24.26
Bid-YTW : 5.37 %
MFC.PR.F FixedReset Ins Non -2.13 % YTW SCENARIO
Maturity Type : Hard Maturity
Maturity Date : 2025-01-31
Maturity Price : 25.00
Evaluated at bid price : 18.35
Bid-YTW : 8.60 %
NA.PR.G FixedReset Prem -2.11 % YTW SCENARIO
Maturity Type : Limit Maturity
Maturity Date : 2048-10-05
Maturity Price : 23.16
Evaluated at bid price : 25.01
Bid-YTW : 5.08 %
MFC.PR.J FixedReset Ins Non -1.92 % YTW SCENARIO
Maturity Type : Hard Maturity
Maturity Date : 2025-01-31
Maturity Price : 25.00
Evaluated at bid price : 24.55
Bid-YTW : 5.34 %
BAM.PR.M Perpetual-Discount -1.67 % YTW SCENARIO
Maturity Type : Limit Maturity
Maturity Date : 2048-10-05
Maturity Price : 20.57
Evaluated at bid price : 20.57
Bid-YTW : 5.82 %
BAM.PF.B FixedReset Disc -1.57 % YTW SCENARIO
Maturity Type : Limit Maturity
Maturity Date : 2048-10-05
Maturity Price : 23.02
Evaluated at bid price : 23.80
Bid-YTW : 5.18 %
GWO.PR.T Deemed-Retractible -1.43 % YTW SCENARIO
Maturity Type : Hard Maturity
Maturity Date : 2025-01-31
Maturity Price : 25.00
Evaluated at bid price : 23.41
Bid-YTW : 6.45 %
HSE.PR.C FixedReset Disc -1.41 % YTW SCENARIO
Maturity Type : Limit Maturity
Maturity Date : 2048-10-05
Maturity Price : 24.10
Evaluated at bid price : 24.50
Bid-YTW : 5.51 %
MFC.PR.N FixedReset Ins Non -1.40 % YTW SCENARIO
Maturity Type : Hard Maturity
Maturity Date : 2025-01-31
Maturity Price : 25.00
Evaluated at bid price : 23.27
Bid-YTW : 5.82 %
BAM.PR.N Perpetual-Discount -1.39 % YTW SCENARIO
Maturity Type : Limit Maturity
Maturity Date : 2048-10-05
Maturity Price : 20.56
Evaluated at bid price : 20.56
Bid-YTW : 5.82 %
BAM.PF.G FixedReset Disc -1.20 % YTW SCENARIO
Maturity Type : Limit Maturity
Maturity Date : 2048-10-05
Maturity Price : 23.52
Evaluated at bid price : 24.65
Bid-YTW : 5.15 %
PWF.PR.T FixedReset Disc -1.17 % YTW SCENARIO
Maturity Type : Limit Maturity
Maturity Date : 2048-10-05
Maturity Price : 23.55
Evaluated at bid price : 24.41
Bid-YTW : 4.83 %
GWO.PR.I Deemed-Retractible -1.09 % YTW SCENARIO
Maturity Type : Hard Maturity
Maturity Date : 2025-01-31
Maturity Price : 25.00
Evaluated at bid price : 20.87
Bid-YTW : 7.93 %
GWO.PR.N FixedReset Ins Non -1.01 % YTW SCENARIO
Maturity Type : Hard Maturity
Maturity Date : 2025-01-31
Maturity Price : 25.00
Evaluated at bid price : 18.55
Bid-YTW : 8.39 %
SLF.PR.H FixedReset Ins Non -1.01 % YTW SCENARIO
Maturity Type : Hard Maturity
Maturity Date : 2025-01-31
Maturity Price : 25.00
Evaluated at bid price : 21.62
Bid-YTW : 6.35 %
CU.PR.F Perpetual-Discount 1.11 % YTW SCENARIO
Maturity Type : Limit Maturity
Maturity Date : 2048-10-05
Maturity Price : 20.99
Evaluated at bid price : 20.99
Bid-YTW : 5.43 %
BAM.PR.B Floater 1.72 % YTW SCENARIO
Maturity Type : Limit Maturity
Maturity Date : 2048-10-05
Maturity Price : 18.34
Evaluated at bid price : 18.34
Bid-YTW : 3.55 %
IFC.PR.A FixedReset Ins Non 1.72 % YTW SCENARIO
Maturity Type : Hard Maturity
Maturity Date : 2025-01-31
Maturity Price : 25.00
Evaluated at bid price : 20.65
Bid-YTW : 7.07 %
TRP.PR.F FloatingReset 1.73 % YTW SCENARIO
Maturity Type : Limit Maturity
Maturity Date : 2048-10-05
Maturity Price : 21.16
Evaluated at bid price : 21.16
Bid-YTW : 4.08 %
Volume Highlights
Issue Index Shares
Traded
Notes
BAM.PF.D Perpetual-Discount 136,289 YTW SCENARIO
Maturity Type : Limit Maturity
Maturity Date : 2048-10-05
Maturity Price : 21.10
Evaluated at bid price : 21.10
Bid-YTW : 5.85 %
MFC.PR.M FixedReset Ins Non 94,121 YTW SCENARIO
Maturity Type : Hard Maturity
Maturity Date : 2025-01-31
Maturity Price : 25.00
Evaluated at bid price : 23.30
Bid-YTW : 5.91 %
MFC.PR.R FixedReset Ins Non 86,172 YTW SCENARIO
Maturity Type : Call
Maturity Date : 2022-03-19
Maturity Price : 25.00
Evaluated at bid price : 25.21
Bid-YTW : 4.68 %
GWO.PR.T Deemed-Retractible 71,750 YTW SCENARIO
Maturity Type : Hard Maturity
Maturity Date : 2025-01-31
Maturity Price : 25.00
Evaluated at bid price : 23.41
Bid-YTW : 6.45 %
PWF.PR.H Perpetual-Premium 68,936 YTW SCENARIO
Maturity Type : Call
Maturity Date : 2018-11-04
Maturity Price : 25.00
Evaluated at bid price : 25.56
Bid-YTW : -8.67 %
RY.PR.J FixedReset Disc 53,222 YTW SCENARIO
Maturity Type : Call
Maturity Date : 2020-05-24
Maturity Price : 25.00
Evaluated at bid price : 24.82
Bid-YTW : 4.34 %
There were 27 other index-included issues trading in excess of 10,000 shares.
Wide Spread Highlights
Issue Index Quote Data and Yield Notes
TD.PF.J FixedReset Prem Quote: 24.40 – 25.40
Spot Rate : 1.0000
Average : 0.6129

YTW SCENARIO
Maturity Type : Limit Maturity
Maturity Date : 2048-10-05
Maturity Price : 22.97
Evaluated at bid price : 24.40
Bid-YTW : 5.07 %

MFC.PR.H FixedReset Ins Non Quote: 24.57 – 25.23
Spot Rate : 0.6600
Average : 0.4088

YTW SCENARIO
Maturity Type : Hard Maturity
Maturity Date : 2025-01-31
Maturity Price : 25.00
Evaluated at bid price : 24.57
Bid-YTW : 5.86 %

TRP.PR.E FixedReset Disc Quote: 22.85 – 23.80
Spot Rate : 0.9500
Average : 0.7541

YTW SCENARIO
Maturity Type : Limit Maturity
Maturity Date : 2048-10-05
Maturity Price : 22.37
Evaluated at bid price : 22.85
Bid-YTW : 5.07 %

MFC.PR.F FixedReset Ins Non Quote: 18.35 – 18.85
Spot Rate : 0.5000
Average : 0.3205

YTW SCENARIO
Maturity Type : Hard Maturity
Maturity Date : 2025-01-31
Maturity Price : 25.00
Evaluated at bid price : 18.35
Bid-YTW : 8.60 %

MFC.PR.O FixedReset Ins Non Quote: 25.63 – 26.09
Spot Rate : 0.4600
Average : 0.2919

YTW SCENARIO
Maturity Type : Call
Maturity Date : 2021-06-19
Maturity Price : 25.00
Evaluated at bid price : 25.63
Bid-YTW : 4.73 %

HSE.PR.C FixedReset Disc Quote: 24.50 – 24.99
Spot Rate : 0.4900
Average : 0.3232

YTW SCENARIO
Maturity Type : Limit Maturity
Maturity Date : 2048-10-05
Maturity Price : 24.10
Evaluated at bid price : 24.50
Bid-YTW : 5.51 %

TRI.PR.B Downgraded to P-3(high) by S&P

Friday, October 5th, 2018

Standard & Poor’s has announced:

  • •Toronto-based information services company Thomson Reuters Corp. completed the sale of its Financial & Risk (F&R) business, selling a controlling 55% equity interest to Blackstone Group alongside affiliates of Canada Pension Plan and GIC).
  • •We view the divesture of the F&R business, which accounted for more than half of Thomson Reuters’ consolidated revenue and EBITDA in 2017, as a loss of the scale and diversification benefits that we previously factored into our rating.
  • •We are lowering our issuer credit rating on Thomson Reuters and our senior unsecured issue-level ratings by one notch to ‘BBB’ from ‘BBB+’. We affirmed our ‘A-2’ short-term commercial paper rating.
  • •The stable outlook reflects our expectation for modest organic revenue growth in the low- to mid-single-digit percentage range, EBITDA margins steadily rise to the mid-20% over the next two years as the company reduces costs and improves its operating efficiency, and that the company will maintain adjusted debt to EBITDA leverage below 3x.

NEW YORK (S&P Global Ratings) Oct. 4, 2018–S&P Global Ratings today lowered its long-term issuer credit rating on Toronto-based information services company Thomson Reuters Corp. to ‘BBB’ from ‘BBB+’ and affirmed its ‘A-2’ short-term issuer credit rating. The rating outlook is stable. We also lowered the issue-level ratings on the company’s senior unsecured debt to ‘BBB’ from ‘BBB+’. We removed the ratings from CreditWatch negative, where we placed them n Jan. 31, 2018, following the company’s announcement of the sale of majority stake in its F&R business.

We also lowered our Canadian scale preferred share rating to ‘P-3(High)’ from ‘P-2(Low)’, lowered our preferred share issue rating to ‘BB+’ from ‘BBB-‘ and affirmed our ‘A-2′ short-term rating on the company’s U.S. commercial paper facility.

The downgrade reflects the divesture of the F&R business, which accounted for more than half of Thomson Reuters’ consolidated revenue and EBITDA in 2017. As a result of this sale, we believe the company is losing the scale and diversification benefits that we previously factored into our rating.

As reported on PrefBlog, S&P placed TRI on Watch-Negative in January, 2018. DBRS downgraded the issue to Pfd-3(high) in October 2013.

The sole affected issue is TRI.PR.B

October 4, 2018

Thursday, October 4th, 2018
HIMIPref™ Preferred Indices
These values reflect the December 2008 revision of the HIMIPref™ Indices

Values are provisional and are finalized monthly
Index Mean
Current
Yield
(at bid)
Median
YTW
Median
Average
Trading
Value
Median
Mod Dur
(YTW)
Issues Day’s Perf. Index Value
Ratchet 0.00 % 0.00 % 0 0.00 0 -0.4431 % 3,204.7
FixedFloater 0.00 % 0.00 % 0 0.00 0 -0.4431 % 5,880.5
Floater 3.39 % 3.57 % 40,193 18.41 4 -0.4431 % 3,389.0
OpRet 0.00 % 0.00 % 0 0.00 0 -0.0238 % 3,227.4
SplitShare 4.61 % 4.74 % 53,996 4.75 5 -0.0238 % 3,854.2
Interest-Bearing 0.00 % 0.00 % 0 0.00 0 -0.0238 % 3,007.2
Perpetual-Premium 5.55 % -3.90 % 50,002 0.09 12 0.0033 % 2,926.3
Perpetual-Discount 5.45 % 5.59 % 61,453 14.50 21 -0.3323 % 2,995.3
FixedReset Disc 4.14 % 4.93 % 130,516 15.42 43 0.3274 % 2,614.4
Deemed-Retractible 5.18 % 6.14 % 60,316 5.32 27 -0.1004 % 2,987.0
FloatingReset 3.44 % 3.59 % 41,973 5.62 4 -0.4808 % 2,872.7
FixedReset Prem 4.84 % 4.10 % 219,220 2.83 34 -0.0971 % 2,578.2
FixedReset Bank Non 3.19 % 3.82 % 68,727 0.39 9 -0.0226 % 2,577.6
FixedReset Ins Non 4.30 % 5.05 % 88,905 5.40 22 -0.1696 % 2,599.4
Performance Highlights
Issue Index Change Notes
BAM.PR.K Floater -1.83 % YTW SCENARIO
Maturity Type : Limit Maturity
Maturity Date : 2048-10-04
Maturity Price : 18.20
Evaluated at bid price : 18.20
Bid-YTW : 3.57 %
IFC.PR.A FixedReset Ins Non -1.74 % YTW SCENARIO
Maturity Type : Hard Maturity
Maturity Date : 2025-01-31
Maturity Price : 25.00
Evaluated at bid price : 20.30
Bid-YTW : 7.39 %
TRP.PR.F FloatingReset -1.70 % YTW SCENARIO
Maturity Type : Limit Maturity
Maturity Date : 2048-10-04
Maturity Price : 20.80
Evaluated at bid price : 20.80
Bid-YTW : 4.15 %
MFC.PR.K FixedReset Ins Non -1.63 % YTW SCENARIO
Maturity Type : Hard Maturity
Maturity Date : 2025-01-31
Maturity Price : 25.00
Evaluated at bid price : 23.00
Bid-YTW : 6.15 %
CU.PR.F Perpetual-Discount -1.61 % YTW SCENARIO
Maturity Type : Limit Maturity
Maturity Date : 2048-10-04
Maturity Price : 20.76
Evaluated at bid price : 20.76
Bid-YTW : 5.49 %
TD.PF.C FixedReset Disc -1.56 % YTW SCENARIO
Maturity Type : Limit Maturity
Maturity Date : 2048-10-04
Maturity Price : 22.86
Evaluated at bid price : 23.32
Bid-YTW : 4.89 %
BAM.PF.I FixedReset Prem -1.51 % YTW SCENARIO
Maturity Type : Call
Maturity Date : 2022-03-31
Maturity Price : 25.00
Evaluated at bid price : 25.51
Bid-YTW : 4.21 %
BAM.PF.C Perpetual-Discount -1.21 % YTW SCENARIO
Maturity Type : Limit Maturity
Maturity Date : 2048-10-04
Maturity Price : 21.14
Evaluated at bid price : 21.14
Bid-YTW : 5.78 %
TD.PF.B FixedReset Disc -1.17 % YTW SCENARIO
Maturity Type : Limit Maturity
Maturity Date : 2048-10-04
Maturity Price : 23.04
Evaluated at bid price : 23.66
Bid-YTW : 4.86 %
BAM.PR.C Floater -1.08 % YTW SCENARIO
Maturity Type : Limit Maturity
Maturity Date : 2048-10-04
Maturity Price : 18.25
Evaluated at bid price : 18.25
Bid-YTW : 3.57 %
PWF.PR.Q FloatingReset -1.05 % YTW SCENARIO
Maturity Type : Limit Maturity
Maturity Date : 2048-10-04
Maturity Price : 21.39
Evaluated at bid price : 21.72
Bid-YTW : 3.59 %
BAM.PF.G FixedReset Disc 1.22 % YTW SCENARIO
Maturity Type : Call
Maturity Date : 2020-06-30
Maturity Price : 25.00
Evaluated at bid price : 24.95
Bid-YTW : 4.68 %
BAM.PR.B Floater 1.29 % YTW SCENARIO
Maturity Type : Limit Maturity
Maturity Date : 2048-10-04
Maturity Price : 18.03
Evaluated at bid price : 18.03
Bid-YTW : 3.61 %
BMO.PR.T FixedReset Disc 1.59 % YTW SCENARIO
Maturity Type : Limit Maturity
Maturity Date : 2048-10-04
Maturity Price : 23.04
Evaluated at bid price : 23.63
Bid-YTW : 4.82 %
TRP.PR.G FixedReset Disc 1.72 % YTW SCENARIO
Maturity Type : Call
Maturity Date : 2020-11-30
Maturity Price : 25.00
Evaluated at bid price : 24.82
Bid-YTW : 4.34 %
BAM.PF.F FixedReset Disc 1.88 % YTW SCENARIO
Maturity Type : Call
Maturity Date : 2019-09-30
Maturity Price : 25.00
Evaluated at bid price : 24.92
Bid-YTW : 4.93 %
BMO.PR.W FixedReset Disc 2.13 % YTW SCENARIO
Maturity Type : Limit Maturity
Maturity Date : 2048-10-04
Maturity Price : 22.98
Evaluated at bid price : 23.49
Bid-YTW : 4.82 %
BAM.PR.T FixedReset Disc 2.14 % YTW SCENARIO
Maturity Type : Limit Maturity
Maturity Date : 2048-10-04
Maturity Price : 21.50
Evaluated at bid price : 21.50
Bid-YTW : 5.15 %
Volume Highlights
Issue Index Shares
Traded
Notes
TD.PF.K FixedReset Prem 224,195 YTW SCENARIO
Maturity Type : Call
Maturity Date : 2023-10-31
Maturity Price : 25.00
Evaluated at bid price : 25.10
Bid-YTW : 4.75 %
MFC.PR.O FixedReset Ins Non 104,500 YTW SCENARIO
Maturity Type : Call
Maturity Date : 2021-06-19
Maturity Price : 25.00
Evaluated at bid price : 26.30
Bid-YTW : 3.69 %
TD.PF.B FixedReset Disc 94,522 YTW SCENARIO
Maturity Type : Limit Maturity
Maturity Date : 2048-10-04
Maturity Price : 23.04
Evaluated at bid price : 23.66
Bid-YTW : 4.86 %
MFC.PR.Q FixedReset Ins Non 71,500 YTW SCENARIO
Maturity Type : Hard Maturity
Maturity Date : 2025-01-31
Maturity Price : 25.00
Evaluated at bid price : 24.85
Bid-YTW : 4.92 %
TD.PF.D FixedReset Disc 69,400 YTW SCENARIO
Maturity Type : Call
Maturity Date : 2020-07-31
Maturity Price : 25.00
Evaluated at bid price : 24.87
Bid-YTW : 4.28 %
RY.PR.H FixedReset Disc 58,800 YTW SCENARIO
Maturity Type : Limit Maturity
Maturity Date : 2048-10-04
Maturity Price : 23.24
Evaluated at bid price : 23.83
Bid-YTW : 4.80 %
There were 35 other index-included issues trading in excess of 10,000 shares.
Wide Spread Highlights
Issue Index Quote Data and Yield Notes
TRP.PR.E FixedReset Disc Quote: 22.82 – 23.80
Spot Rate : 0.9800
Average : 0.5393

YTW SCENARIO
Maturity Type : Limit Maturity
Maturity Date : 2048-10-04
Maturity Price : 22.13
Evaluated at bid price : 22.82
Bid-YTW : 5.07 %

IFC.PR.E Deemed-Retractible Quote: 23.85 – 24.80
Spot Rate : 0.9500
Average : 0.5486

YTW SCENARIO
Maturity Type : Hard Maturity
Maturity Date : 2025-01-31
Maturity Price : 25.00
Evaluated at bid price : 23.85
Bid-YTW : 6.14 %

TD.PF.C FixedReset Disc Quote: 23.32 – 23.95
Spot Rate : 0.6300
Average : 0.3418

YTW SCENARIO
Maturity Type : Limit Maturity
Maturity Date : 2048-10-04
Maturity Price : 22.86
Evaluated at bid price : 23.32
Bid-YTW : 4.89 %

TD.PF.B FixedReset Disc Quote: 23.66 – 24.09
Spot Rate : 0.4300
Average : 0.2372

YTW SCENARIO
Maturity Type : Limit Maturity
Maturity Date : 2048-10-04
Maturity Price : 23.04
Evaluated at bid price : 23.66
Bid-YTW : 4.86 %

EIT.PR.A SplitShare Quote: 25.06 – 25.56
Spot Rate : 0.5000
Average : 0.3135

YTW SCENARIO
Maturity Type : Soft Maturity
Maturity Date : 2024-03-14
Maturity Price : 25.00
Evaluated at bid price : 25.06
Bid-YTW : 4.83 %

BAM.PF.I FixedReset Prem Quote: 25.51 – 25.88
Spot Rate : 0.3700
Average : 0.2229

YTW SCENARIO
Maturity Type : Call
Maturity Date : 2022-03-31
Maturity Price : 25.00
Evaluated at bid price : 25.51
Bid-YTW : 4.21 %

MAPF Performance: September, 2018

Wednesday, October 3rd, 2018

Malachite Aggressive Preferred Fund’s Net Asset Value per Unit as of the close September 28, 2018, was $10.2965 after a distribution of 0.110815 per Unit.

Returns to September 28, 2018
Period MAPF BMO-CM “50” Preferred Share Index TXPR*
Total Return
CPD – according to Blackrock
One Month -0.19% -0.39% -0.33% N/A
Three Months +1.52% +1.33% +1.60% N/A
One Year +10.26% +6.46% +5.10% +4.54%
Two Years (annualized) +17.60% +12.76% +10.64% N/A
Three Years (annualized) +14.64% +11.51% +9.93% +9.42%
Four Years (annualized) +4.36% +2.91% +1.65% N/A
Five Years (annualized) +5.39% +3.15% +2.40% +1.99%
Six Years (annualized) +4.27% +2.71% +1.83% N/A
Seven Years (annualized) +5.43% +3.23% +2.49% N/A
Eight Years (annualized) +5.10% +3.81% +2.83% N/A
Nine Years (annualized) +6.20% +4.47% +3.50% N/A
Ten Years (annualized) +10.78% +5.03% +4.04% +3.50%
Eleven Years (annualized) +9.37% +3.91% +3.08%  
Twelve Years (annualized) +8.66% +3.41%    
Thirteen Years (annualized) +8.45% +3.45%    
Fourteen Years (annualized) +8.36% +3.58%    
Fifteen Years (annualized) +8.82% +3.68%    
Sixteen Years (annualized) +10.14% +3.89%    
Seventeen Years (annualized) +9.19% +3.86%    
MAPF returns assume reinvestment of distributions, and are shown after expenses but before fees.
The full name of the BMO-CM “50” index is the BMO Capital Markets “50” Preferred Share Index. It is calculated without accounting for fees.
“TXPR” is the S&P/TSX Preferred Share Index. It is calculated without accounting for fees, but does assume reinvestment of dividends.
CPD Returns are for the NAV and are after all fees and expenses. Reinvestment of dividends is assumed.
Figures for National Bank Preferred Equity Income Fund (formerly Omega Preferred Equity) (which are after all fees and expenses) for 1-, 3- and 12-months are -0.19%, +1.41% and +4.47%, respectively, according to Morningstar after all fees & expenses. Three year performance is +8.56%; five year is +3.01%; ten year is +4.44%
Manulife Preferred Income Class Adv has been terminated by Manulife.
Figures for Horizons Active Preferred Share ETF (HPR) (which are after all fees and expenses) for 1-, 3- and 12-months are -0.49%, +1.57% & +5.47%, respectively. Three year performance is +10.96%, five-year is +3.71%
Figures for National Bank Preferred Equity Fund (formerly Altamira Preferred Equity Fund) are -0.50%, +1.38% and +4.58% for one-, three- and twelve months, respectively. Three year performance is +10.13%; five-year is +2.63%

According to the fund’s fact sheet as of June 30, 2016, the fund’s inception date was October 30, 2015. I do not know how they justify this nonsensical statement, but will assume that prior performance is being suppressed in some perfectly legal manner that somebody at National considers ethical.

The figures for the NAV of BMO S&P/TSX Laddered Preferred Share Index ETF (ZPR) is +4.83% for the past twelve months. Two year performance is +12.83%, three year is +10.62%, five year is +0.70%.
Figures for Natixis Canadian Preferred Share Class Series F (formerly NexGen Canadian Preferred Share Tax Managed Fund) are -0.33%, +1.30% and +3.39% for one-, three- and twelve-months, respectively. Three year performance is +9.06%; five-year is +4.13%
Figures for BMO Preferred Share Fund (advisor series) according to Morningstar are -0.75%, +1.20% and +2.46% for the past one-, three- and twelve-months, respectively. Three year performance is +7.29%; five-year is +0.93%.
Figures for PowerShares Canadian Preferred Share Index Class, Series F are +4.77% for the past twelve months. The three-year figure is +11.23%; five years is +2.98%
Figures for the First Asset Preferred Share Investment Trust (PSF.UN) are no longer available since the fund has merged with First Asset Preferred Share ETF (FPR)
Figures for Lysander-Slater Preferred Share Dividend Fund according to Morningstar are -0.61%, +1.01% and +5.26% for the past one, three and twelve months, respectively. Three year performance is +8.76%.
Figures for the Desjardins Canadian Preferred Share Fund A Class, as reported by Morningstar are -0.61%, +1.19% and +3.64% for the past one, three and twelve months, respectively.

MAPF returns assume reinvestment of dividends, and are shown after expenses but before fees. Past performance is not a guarantee of future performance. You can lose money investing in Malachite Aggressive Preferred Fund or any other fund. For more information, see the fund’s main page. The fund is available either directly from Hymas Investment Management or through a brokerage account at Odlum Brown Limited.

The preferred share market seems to have paused its strong advance from the lows of late 2014 to early 2016, but I think that there is still room for outsized gains. The Seniority Spread (the interest-equivalent yield on reasonably liquid, investment-grade PerpetualDiscounts less the yield on long term corporate bonds) is still quite elevated (chart end-date 2018-9-14)

pl_180914_body_chart_1
Click for Big

… and the relationship between five-year Canada yields and yields on investment-grade FixedResets is also well within what I consider ‘decoupled panic’ territory (chart end-date 2018-9-14):

pl_180914_body_chart_5
Click for Big

In addition, I feel that the yield on five-year Canadas is unsustainably low (it should be the inflation rate plus an increment of … 1%? 1.5%? 2.0%?),and a return to sustainable levels is likely over the medium term.

FixedReset performance on the month was -0.52% vs. PerpetualDiscounts of -0.12% in September, but over the past three months, the former class has outperformed significantly.:

himi_indexperf_180928
Click for Big

Floaters regained some ground on the month, as they returned +1.94% for September and +30.6% for the past twelve months. But look at the long-term performance:

himi_floaterperf_180928
Click for Big

Some Assiduous Readers will be interested to observe that the ‘Quantitative Easing’ decline was not as bad as the ‘Credit Crunch’ decline, which took the sector down to the point where the 15-year cumulative total return was negative. I wrote about that at the time and still can’t get over it. Fifteen years!

As for the future, of course, it’s one thing to say that ‘spreads are unsustainable and so are government yields’ and it’s quite another to forecast just how and when a more economically sustainable environment will take effect. It could be years. There could be a reversal, particularly if Trump’s international trade policies cause a severe recession or even a depression. And, of course, I could be just plain wrong about the sustainability of the current environment.

I think that a broad, sustainable rally in FixedResets will require higher five-year Canada yields (or a widespread expectation of them) … and although I’m sure this will happen eventually, it would be foolish to speculate on just when it will happen!

Calculation of MAPF Sustainable Income Per Unit
Month NAVPU Portfolio
Average
YTW
Leverage
Divisor
Securities
Average
YTW
Capital
Gains
Multiplier
Sustainable
Income
per
current
Unit
June, 2007 9.3114 5.16% 1.03 5.01% 1.3240 0.3524
September 9.1489 5.35% 0.98 5.46% 1.3240 0.3773
December, 2007 9.0070 5.53% 0.942 5.87% 1.3240 0.3993
March, 2008 8.8512 6.17% 1.047 5.89% 1.3240 0.3938
June 8.3419 6.034% 0.952 6.338% 1.3240 $0.3993
September 8.1886 7.108% 0.969 7.335% 1.3240 $0.4537
December, 2008 8.0464 9.24% 1.008 9.166% 1.3240 $0.5571
March 2009 $8.8317 8.60% 0.995 8.802% 1.3240 $0.5872
June 10.9846 7.05% 0.999 7.057% 1.3240 $0.5855
September 12.3462 6.03% 0.998 6.042% 1.3240 $0.5634
December 2009 10.5662 5.74% 0.981 5.851% 1.1141 $0.5549
March 2010 10.2497 6.03% 0.992 6.079% 1.1141 $0.5593
June 10.5770 5.96% 0.996 5.984% 1.1141 $0.5681
September 11.3901 5.43% 0.980 5.540% 1.1141 $0.5664
December 2010 10.7659 5.37% 0.993 5.408% 1.0298 $0.5654
March, 2011 11.0560 6.00% 0.994 5.964% 1.0298 $0.6403
June 11.1194 5.87% 1.018 5.976% 1.0298 $0.6453
September 10.2709 6.10%
Note
1.001 6.106% 1.0298 $0.6090
December, 2011 10.0793 5.63%
Note
1.031 5.805% 1.0000 $0.5851
March, 2012 10.3944 5.13%
Note
0.996 5.109% 1.0000 $0.5310
June 10.2151 5.32%
Note
1.012 5.384% 1.0000 $0.5500
September 10.6703 4.61%
Note
0.997 4.624% 1.0000 $0.4934
December, 2012 10.8307 4.24% 0.989 4.287% 1.0000 $0.4643
March, 2013 10.9033 3.87% 0.996 3.886% 1.0000 $0.4237
June 10.3261 4.81% 0.998 4.80% 1.0000 $0.4957
September 10.0296 5.62% 0.996 5.643% 1.0000 $0.5660
December, 2013 9.8717 6.02% 1.008 5.972% 1.0000 $0.5895
March, 2014 10.2233 5.55% 0.998 5.561% 1.0000 $0.5685
June 10.5877 5.09% 0.998 5.100% 1.0000 $0.5395
September 10.4601 5.28% 0.997 5.296% 1.0000 $0.5540
December, 2014 10.5701 4.83% 1.009 4.787% 1.0000 $0.5060
March, 2015 9.9573 4.99% 1.001 4.985% 1.0000 $0.4964
June, 2015 9.4181 5.55% 1.002 5.539% 1.0000 $0.5217
September 7.8140 6.98% 0.999 6.987% 1.0000 $0.5460
December, 2015 8.1379 6.85% 0.997 6.871% 1.0000 $0.5592
March, 2016 7.4416 7.79% 0.998 7.805% 1.0000 $0.5808
June 7.6704 7.67% 1.011 7.587% 1.0000 $0.5819
September 8.0590 7.35% 0.993 7.402% 1.0000 $0.5965
December, 2016 8.5844 7.24% 0.990 7.313% 1.0000 $0.6278
March, 2017 9.3984 6.26% 0.994 6.298% 1.0000 $0.5919
June 9.5313 6.41% 0.998 6.423% 1.0000 $0.6122
September 9.7129 6.56% 0.998 6.573% 1.0000 $0.6384
December, 2017 10.0566 6.06% 1.004 6.036% 1.0000 $0.6070
March, 2018 10.2701 6.22% 1.007 6.177% 1.0000 $0.6344
June 10.2518 6.22% 0.995 6.251% 1.0000 $0.6408
September, 2018 10.2965 6.62% 1.018 6.503% 1.0000 $0.6696
NAVPU is shown after quarterly distributions of dividend income and annual distribution of capital gains.
Portfolio YTW includes cash (or margin borrowing), with an assumed interest rate of 0.00%
The Leverage Divisor indicates the level of cash in the account: if the portfolio is 1% in cash, the Leverage Divisor will be 0.99
Securities YTW divides “Portfolio YTW” by the “Leverage Divisor” to show the average YTW on the securities held; this assumes that the cash is invested in (or raised from) all securities held, in proportion to their holdings.
The Capital Gains Multiplier adjusts for the effects of Capital Gains Dividends. On 2009-12-31, there was a capital gains distribution of $1.989262 which is assumed for this purpose to have been reinvested at the final price of $10.5662. Thus, a holder of one unit pre-distribution would have held 1.1883 units post-distribution; the CG Multiplier reflects this to make the time-series comparable. Note that Dividend Distributions are not assumed to be reinvested.
Sustainable Income is the resultant estimate of the fund’s dividend income per current unit, before fees and expenses. Note that a “current unit” includes reinvestment of prior capital gains; a unitholder would have had the calculated sustainable income with only, say, 0.9 units in the past which, with reinvestment of capital gains, would become 1.0 current units.
DeemedRetractibles are comprised of all Straight Perpetuals (both PerpetualDiscount and PerpetualPremium) issued by BMO, BNS, CM, ELF, GWO, HSB, IAG, MFC, NA, RY, SLF and TD, which are not exchangable into common at the option of the company (definition refined in May, 2011). These issues are analyzed as if their prospectuses included a requirement to redeem at par on or prior to 2022-1-31 (banks) or 2025-1-31 (insurers and insurance holding companies), in addition to the call schedule explicitly defined. See OSFI Does Not Grandfather Extant Tier 1 Capital, CM.PR.D, CM.PR.E, CM.PR.G: Seeking NVCC Status and the January, February, March and June, 2011, editions of PrefLetter for the rationale behind this analysis.

The same reasoning is also applied to FixedResets from these issuers, other than explicitly defined NVCC from banks.

Yields for September, 2011, to January, 2012, were calculated by imposing a cap of 10% on the yields of YLO issues held, in order to avoid their extremely high calculated yields distorting the calculation and to reflect the uncertainty in the marketplace that these yields will be realized. From February to September 2012, yields on these issues have been set to zero. All YLO issues held were sold in October 2012.

These calculations were performed assuming constant contemporary GOC-5 and 3-Month Bill rates, as follows:

Canada Yields Assumed in Calculations
Month-end GOC-5 3-Month Bill
September, 2015 0.78% 0.40%
December, 2015 0.71% 0.46%
March, 2016 0.70% 0.44%
June 0.57% 0.47%
September 0.58% 0.53%
December, 2016 1.16% 0.47%
March, 2017 1.08% 0.55%
June 1.35% 0.69%
September 1.79% 0.97%
December, 2017 1.83% 1.00%
March, 2018 2.06% 1.08%
June 1.95% 1.22%
September, 2018 2.33% 1.55%

Significant positions were held in NVCC non-compliant regulated FixedReset issues on September 28, 2018; all of these currently have their yields calculated with the presumption that they will be called by the issuers at par prior to 2022-1-31 (banks) or 2025-1-31 (insurers and insurance holding companies) or on a different date (SplitShares) This presents another complication in the calculation of sustainable yield, which also assumes that redemption proceeds will be reinvested at the same rate. It will also be noted that my analysis of likely insurance industry regulation as updated is not given much weight by the market.

I will also note that the sustainable yield calculated above is not directly comparable with any yield calculation currently reported by any other preferred share fund as far as I am aware. The Sustainable Yield depends on:
i) Calculating Yield-to-Worst for each instrument and using this yield for reporting purposes;
ii) Using the contemporary value of Five-Year Canadas to estimate dividends after reset for FixedResets. The assumption regarding the five-year Canada rate has become more important as the proportion of low-spread FixedResets in the portfolio has increased.
iii) Making the assumption that deeply discounted NVCC non-compliant issues from both banks and insurers, both Straight and FixedResets will be redeemed at par on their DeemedMaturity date as discussed above.