Archive for May, 2023

May 23, 2023

Tuesday, May 23rd, 2023

Concern about the US debt ceiling is increasing:

The United States faces an “elevated risk” of running out of cash to pay its bills between June 2 and 13 if Congress does not raise or suspend the nation’s debt limit, according to an analysis released on Tuesday by the Bipartisan Policy Center, an influential think tank that carefully tracks federal spending.

The center noted that the federal government could get a reprieve if it mustered sufficient revenue to make it to June 15, when quarterly tax payments are due. That could push a default, the so-called X-date, into July.

However, Treasury Secretary Janet L. Yellen said this week that she thought it was unlikely that the federal government would have enough cash on hand to make it to mid-June.

There’s one disputed issue that will cause eyes to roll:

The White House is seeking to preserve funding for key components of the federal coronavirus response in debt limit negotiations with House Republicans, according to senior Biden administration officials familiar with the talks.

Administration officials are trying to protect roughly $5 billion in funding for a program to develop the next generation of coronavirus vaccines and treatments. They are also looking to preserve more than $1 billion in funding for an initiative to offer free coronavirus shots to uninsured Americans, according to the officials.

As one component of a debt limit deal, House Republicans want to reclaim tens of billions of dollars in unspent funds from Covid-19 relief legislation. It was unclear which funds might be clawed back as part of a deal, though the administration and congressional negotiators have found some agreement on the topic. President Biden said this month that rescinding unspent coronavirus funds was “on the table.”

The pundits tell us this caused yields to spike:

U.S. and Canadian stocks finished sharply lower on Tuesday, and short-term government bond yields shot up, as investor jitters grew over a lack of progress in U.S. debt limit talks.

Those yields rose across the curve, catching up with moves in U.S. Treasuries as the Canadian market reopened following the Victoria Day holiday on Monday.

The five-year Canada is now at 3.42%.

Douglas Irwin writes an interesting piece in F&D magazine titled THE RETURN OF INDUSTRIAL POLICY:

While it has become fashionable to disparage the neoliberal economic policies of the Washington Consensus, the openness of that reform period saw convergence—not the divergence that had been the historical norm—between the rich and poor countries around the world. Starting around 1990, developing economies began to grow more rapidly and catch up to the higher income levels enjoyed by advanced economies (Patel, Sandefur, and Subramanian 2021).

The recent debate about whether globalization is dead or not is sterile. Developing economies would be ill-advised to turn their backs on the global economy and give up the idea of supporting exports and acquiring technology from beyond their borders. They still have much to gain from the rest of the world and a lot to lose by returning to the closed-door policies of the past.

François Villeroy de Galhau, Governor of the Bank of France, gave a speech titled Monetary policy transmission: where do we stand?:

Turning now to bank loans to households and firms, let me stress that this credit channel is of primary importance in the euro area – much more so than in the United States – as bank loans remain the dominant source of financing for firms, in particular for smaller firms.1 Overall, the growth rate of loans has slowed due to a combination of higher borrowing rates, lower demand, and – for firms – tighter credit standards.

Real rates increased significantly from historically low levels (-4% for the 2y real OIS rate in March 2022, see LHS panel) but remained negative at all maturities until mid-December last year (blue line on the RHS panel). It is only from the end of 2022 that we achieved positive real rates. As we estimate the neutral rate r* to be close to zero, we are now clearly in restrictive territory.

First, the current tightening cycle started from exceptionally low levels of real interest rates – as measured by nominal OIS rate deflated by market inflation expectations. \

Second, the proportion of fixed-rate long-term loans is particularly high by historical standards. Many borrowers shifted away from floating rate loans after the global financial crisis and the following decade of low rates encouraged longterm borrowing. This is welcome for financial stability, especially for mortgages. But as a result, the pass-through of higher policy rates is more gradual.

Third, the origin and sectorial composition of inflation matters. The current surge in inflation does not primarily originate in overheated demand but in supply shocks. This has implication for the transmission lags.

The policy rate hikes already implemented are being transmitted forcefully to the euro area financing and monetary conditions. However, the lags and strength of transmission to the real economy remain more uncertain. I would draw from this three policy conclusions:

a. In the usual alleged time lag of one to two years for monetary transmission, our economic situation makes it likely that we are presently closer to the upper range. And hence the commitment I reaffirm today to bring inflation back towards 2% by 2025, is consistent with the full transmission of the monetary tightening that will have been put in place by summer 2023.

b. Against this backdrop of significant transmission “in the pipe“ and still to come, a deceleration in the size of the policy steps (from 50bp to 25 bp) was wise and cautious. We obviously keep our hands free, but we add the capacity of observing and monitoring the pass-through of our substantial and exceptionally rapid past hikes. Persistence is now more important than speed; the duration for which we will maintain rates is now more important than the precise terminal level we will reach. Or in other words, for interest rates as with ballistics, “longer” is becoming more significant than “higher”.

c. Hence, our next rate decisions should not monopolise attention; we already have completed most of our rate-hiking journey, and we are clearly in restrictive territory. That said, as I said already last January, I expect today that we will be at the terminal rate not later than by summer. Summer is a long and beautiful season, which starts in June and ends in September. In the meantime, we have three possible Governing Councils either for hiking or pausing; but don’t deduce a guidance from this or a preference for a given terminal rate. We will remain data driven, looking meeting by meeting at the outlook for headline inflation as well as for the dynamics of underlying inflation and the strength of monetary policy transmission.

The Cleveland Fed is promoting the The Survey of Firms’ Inflation Expectations:

The inflation expectations of individuals who lead firms can influence the prices that their firms charge customers and hence can influence overall inflation. This Economic Commentary summarizes results from the Survey of Firms’ Inflation Expectations (SoFIE), which asks top business executives for their inflation expectations once per quarter alongside a second question from a rotating set. We document that this group’s inflation expectations increased with the run-up in inflation over 2021 and 2022 but then began to decline in early 2023. The Cleveland Fed will post estimates from the Survey of Firms’ Inflation Expectations each quarter, available via clefed.org/SoFIE.

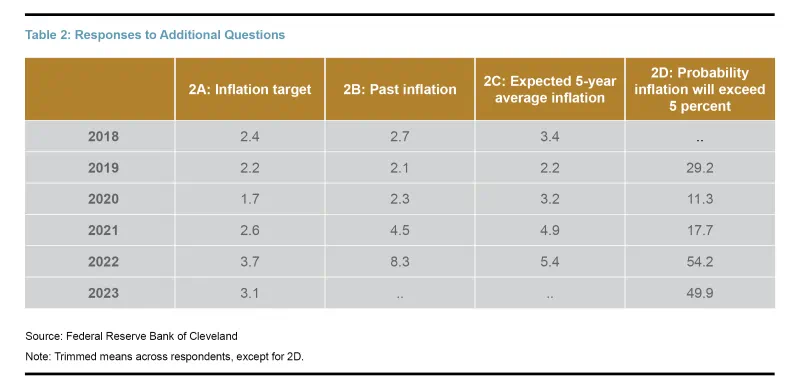
Finally, Table 2 shows the average responses to the rotating questions that are asked in only one quarter per year. Prior to the pandemic, firms generally believed that the Federal Reserve’s inflation target was around 2 percent, that past inflation was around 2.5 percent, and that inflation would average 2 percent to 3 percent over the next five years. As inflation increased in 2021 and 2022, all of these estimates increased, including firms’ expectations for average inflation over the next five years.

HIMIPref™ Preferred Indices
These values reflect the December 2008 revision of the HIMIPref™ Indices

Values are provisional and are finalized monthly
Index Mean
Current
Yield
(at bid)
Median
YTW
Median
Average
Trading
Value
Median
Mod Dur
(YTW)
Issues Day’s Perf. Index Value
Ratchet 0.00 % 0.00 % 0 0.00 0 1.0259 % 2,176.8
FixedFloater 0.00 % 0.00 % 0 0.00 0 1.0259 % 4,175.0
Floater 10.35 % 10.56 % 50,033 9.02 2 1.0259 % 2,406.1
OpRet 0.00 % 0.00 % 0 0.00 0 0.1530 % 3,356.0
SplitShare 5.01 % 6.84 % 42,336 2.57 7 0.1530 % 4,007.8
Interest-Bearing 0.00 % 0.00 % 0 0.00 0 0.1530 % 3,127.0
Perpetual-Premium 0.00 % 0.00 % 0 0.00 0 -0.1214 % 2,711.4
Perpetual-Discount 6.29 % 6.41 % 42,348 13.30 34 -0.1214 % 2,956.6
FixedReset Disc 5.99 % 8.40 % 83,189 11.27 63 -0.0098 % 2,080.9
Insurance Straight 6.22 % 6.37 % 58,536 13.32 19 -0.9042 % 2,893.0
FloatingReset 10.74 % 11.33 % 50,719 8.48 2 0.1715 % 2,370.0
FixedReset Prem 6.95 % 6.82 % 333,102 3.82 1 0.3970 % 2,326.5
FixedReset Bank Non 0.00 % 0.00 % 0 0.00 0 -0.0098 % 2,127.1
FixedReset Ins Non 6.08 % 7.66 % 78,295 11.69 11 -0.9510 % 2,293.6
Performance Highlights
Issue Index Change Notes
IFC.PR.F Insurance Straight -6.82 % YTW SCENARIO
Maturity Type : Limit Maturity
Maturity Date : 2053-05-23
Maturity Price : 20.50
Evaluated at bid price : 20.50
Bid-YTW : 6.59 %
BIP.PR.A FixedReset Disc -2.65 % YTW SCENARIO
Maturity Type : Limit Maturity
Maturity Date : 2053-05-23
Maturity Price : 16.55
Evaluated at bid price : 16.55
Bid-YTW : 10.00 %
BIP.PR.B FixedReset Disc -2.27 % YTW SCENARIO
Maturity Type : Limit Maturity
Maturity Date : 2053-05-23
Maturity Price : 21.50
Evaluated at bid price : 21.50
Bid-YTW : 8.83 %
IFC.PR.C FixedReset Disc -1.82 % YTW SCENARIO
Maturity Type : Limit Maturity
Maturity Date : 2053-05-23
Maturity Price : 16.20
Evaluated at bid price : 16.20
Bid-YTW : 8.56 %
GWO.PR.Q Insurance Straight -1.70 % YTW SCENARIO
Maturity Type : Limit Maturity
Maturity Date : 2053-05-23
Maturity Price : 20.20
Evaluated at bid price : 20.20
Bid-YTW : 6.49 %
GWO.PR.M Insurance Straight -1.43 % YTW SCENARIO
Maturity Type : Limit Maturity
Maturity Date : 2053-05-23
Maturity Price : 22.56
Evaluated at bid price : 22.82
Bid-YTW : 6.46 %
CU.PR.C FixedReset Disc -1.35 % YTW SCENARIO
Maturity Type : Limit Maturity
Maturity Date : 2053-05-23
Maturity Price : 18.25
Evaluated at bid price : 18.25
Bid-YTW : 7.82 %
PWF.PR.K Perpetual-Discount -1.27 % YTW SCENARIO
Maturity Type : Limit Maturity
Maturity Date : 2053-05-23
Maturity Price : 19.40
Evaluated at bid price : 19.40
Bid-YTW : 6.46 %
BN.PF.J FixedReset Disc -1.16 % YTW SCENARIO
Maturity Type : Limit Maturity
Maturity Date : 2053-05-23
Maturity Price : 21.25
Evaluated at bid price : 21.25
Bid-YTW : 7.75 %
PVS.PR.J SplitShare -1.14 % YTW SCENARIO
Maturity Type : Hard Maturity
Maturity Date : 2028-02-29
Maturity Price : 25.00
Evaluated at bid price : 21.75
Bid-YTW : 7.70 %
GWO.PR.L Insurance Straight -1.07 % YTW SCENARIO
Maturity Type : Limit Maturity
Maturity Date : 2053-05-23
Maturity Price : 22.03
Evaluated at bid price : 22.26
Bid-YTW : 6.45 %
TRP.PR.D FixedReset Disc 1.01 % YTW SCENARIO
Maturity Type : Limit Maturity
Maturity Date : 2053-05-23
Maturity Price : 15.05
Evaluated at bid price : 15.05
Bid-YTW : 9.63 %
PVS.PR.G SplitShare 1.06 % YTW SCENARIO
Maturity Type : Option Certainty
Maturity Date : 2026-02-28
Maturity Price : 25.00
Evaluated at bid price : 23.85
Bid-YTW : 6.70 %
BN.PR.K Floater 1.08 % YTW SCENARIO
Maturity Type : Limit Maturity
Maturity Date : 2053-05-23
Maturity Price : 11.24
Evaluated at bid price : 11.24
Bid-YTW : 10.73 %
IFC.PR.K Perpetual-Discount 1.13 % YTW SCENARIO
Maturity Type : Limit Maturity
Maturity Date : 2053-05-23
Maturity Price : 21.49
Evaluated at bid price : 21.49
Bid-YTW : 6.22 %
PWF.PR.T FixedReset Disc 1.17 % YTW SCENARIO
Maturity Type : Limit Maturity
Maturity Date : 2053-05-23
Maturity Price : 17.30
Evaluated at bid price : 17.30
Bid-YTW : 8.39 %
MFC.PR.Q FixedReset Ins Non 1.19 % YTW SCENARIO
Maturity Type : Limit Maturity
Maturity Date : 2053-05-23
Maturity Price : 20.49
Evaluated at bid price : 20.49
Bid-YTW : 7.34 %
BMO.PR.Y FixedReset Disc 1.29 % YTW SCENARIO
Maturity Type : Limit Maturity
Maturity Date : 2053-05-23
Maturity Price : 17.23
Evaluated at bid price : 17.23
Bid-YTW : 8.27 %
BMO.PR.E FixedReset Disc 1.45 % YTW SCENARIO
Maturity Type : Limit Maturity
Maturity Date : 2053-05-23
Maturity Price : 20.30
Evaluated at bid price : 20.30
Bid-YTW : 7.58 %
POW.PR.A Perpetual-Discount 2.07 % YTW SCENARIO
Maturity Type : Limit Maturity
Maturity Date : 2053-05-23
Maturity Price : 21.91
Evaluated at bid price : 22.15
Bid-YTW : 6.41 %
FTS.PR.H FixedReset Disc 2.87 % YTW SCENARIO
Maturity Type : Limit Maturity
Maturity Date : 2053-05-23
Maturity Price : 12.20
Evaluated at bid price : 12.20
Bid-YTW : 9.13 %
Volume Highlights
Issue Index Shares
Traded
Notes
NA.PR.C FixedReset Prem 52,800 YTW SCENARIO
Maturity Type : Call
Maturity Date : 2027-11-15
Maturity Price : 25.00
Evaluated at bid price : 25.29
Bid-YTW : 6.82 %
TD.PF.E FixedReset Disc 49,500 YTW SCENARIO
Maturity Type : Limit Maturity
Maturity Date : 2053-05-23
Maturity Price : 17.47
Evaluated at bid price : 17.47
Bid-YTW : 8.29 %
RY.PR.J FixedReset Disc 28,400 YTW SCENARIO
Maturity Type : Limit Maturity
Maturity Date : 2053-05-23
Maturity Price : 17.49
Evaluated at bid price : 17.49
Bid-YTW : 8.30 %
TD.PF.K FixedReset Disc 27,000 YTW SCENARIO
Maturity Type : Limit Maturity
Maturity Date : 2053-05-23
Maturity Price : 20.64
Evaluated at bid price : 20.64
Bid-YTW : 7.36 %
NA.PR.W FixedReset Disc 15,000 YTW SCENARIO
Maturity Type : Limit Maturity
Maturity Date : 2053-05-23
Maturity Price : 16.50
Evaluated at bid price : 16.50
Bid-YTW : 8.38 %
MFC.PR.Q FixedReset Ins Non 11,600 YTW SCENARIO
Maturity Type : Limit Maturity
Maturity Date : 2053-05-23
Maturity Price : 20.49
Evaluated at bid price : 20.49
Bid-YTW : 7.34 %
There were 1 other index-included issues trading in excess of 10,000 shares.
Wide Spread Highlights
Issue Index Quote Data and Yield Notes
CU.PR.E Perpetual-Discount Quote: 19.43 – 23.72
Spot Rate : 4.2900
Average : 2.4596

YTW SCENARIO
Maturity Type : Limit Maturity
Maturity Date : 2053-05-23
Maturity Price : 19.43
Evaluated at bid price : 19.43
Bid-YTW : 6.34 %

TRP.PR.E FixedReset Disc Quote: 14.47 – 17.45
Spot Rate : 2.9800
Average : 2.0275

YTW SCENARIO
Maturity Type : Limit Maturity
Maturity Date : 2053-05-23
Maturity Price : 14.47
Evaluated at bid price : 14.47
Bid-YTW : 9.78 %

IFC.PR.F Insurance Straight Quote: 20.50 – 22.35
Spot Rate : 1.8500
Average : 1.1381

YTW SCENARIO
Maturity Type : Limit Maturity
Maturity Date : 2053-05-23
Maturity Price : 20.50
Evaluated at bid price : 20.50
Bid-YTW : 6.59 %

CU.PR.C FixedReset Disc Quote: 18.25 – 19.54
Spot Rate : 1.2900
Average : 0.9855

YTW SCENARIO
Maturity Type : Limit Maturity
Maturity Date : 2053-05-23
Maturity Price : 18.25
Evaluated at bid price : 18.25
Bid-YTW : 7.82 %

PWF.PR.P FixedReset Disc Quote: 12.18 – 13.04
Spot Rate : 0.8600
Average : 0.5848

YTW SCENARIO
Maturity Type : Limit Maturity
Maturity Date : 2053-05-23
Maturity Price : 12.18
Evaluated at bid price : 12.18
Bid-YTW : 9.06 %

TRP.PR.C FixedReset Disc Quote: 10.50 – 11.25
Spot Rate : 0.7500
Average : 0.5064

YTW SCENARIO
Maturity Type : Limit Maturity
Maturity Date : 2053-05-23
Maturity Price : 10.50
Evaluated at bid price : 10.50
Bid-YTW : 10.38 %

May 19, 2023

Friday, May 19th, 2023

The Bridging Finance soap opera continues:

Bridging Finance Inc. owners Jenny and Rocky Coco are being sued by the private lender’s receiver and its senior creditor, BlackRock Inc., for their alleged roles in Bridging’s demise, marking the first instances in which either sibling has faced direct legal action in the two-year saga.

The two separate lawsuits, filed in Ontario court, allege negligence, fraudulent misrepresentation and breaches of fiduciary duty, among other things. The cases name multiple other Bridging officials as defendants, including David and Natasha Sharpe, the husband-and-wife duo who previously ran the lender, as well as Bridging’s former chief financial officer, general counsel and chief compliance officer.

The lawsuit by the receiver, PricewaterhouseCoopers Inc., alleges damages worth $1.7-billion, while BlackRock is seeking $75-million. Both parties have also asked a judge to approve an accounting or tracing order to track any funds that were wrongfully diverted into any type of property owned or registered by the defendants.

Ms. Coco is already a defendant in lawsuits connected to Bridging, because of allegations that she may have used investor money as part of her business relationship with Toronto real estate developer Sam Mizrahi, but the two new cases deal directly with her alleged role in the private lender’s demise. In addition to her ownership and board seat, Ms. Coco also sat on Bridging’s credit committee, which approved loans.

Before its downfall, Bridging was one of Canada’s best-known private lenders. Its business model was built on raising money from retail investors and then lending those funds to mid-sized companies that didn’t meet the credit standards of banks. At its peak, Bridging managed $2.09-billion on behalf of 26,000 investors.

Bridging’s receiver estimates that investors will lose $1.3-billion, and to recoup as much money as possible, PricewaterhouseCoopers is now suing multiple parties, including the lender’s former auditor, KPMG LLP, for $1.4-billion.

BIS has released a Bulletin by Benoit Mojon, Gabriela Nodari and Stefano Siviero titled Disinflation milestones:

Key takeaways

  • • Insights into how the incomes of workers and firms absorb the disinflation burden in the euro area and the United States can be gained by decomposing changes in the GDP deflator into its underlying
    components.
  • • Nominal wage increases of 4–5% in the euro area and 3–4% in the United States this year and next year are compatible with bringing inflation within reach of 2% by end-2024, provided that import price growth slows and profit margins stabilise or slightly shrink.
  • • From a historical perspective, the 2023–24 disinflation path for prices and nominal wages is within the range of past disinflation episodes in both economies, although it remains uncertain how price and wage setters will react to the above-target inflation from 2021 onwards.


Importantly, in neither the euro area nor the United States does disinflation require subdued increases in nominal wages. Disinflation is expected to take place in the face of nominal wage increases hovering around 4–5% in the euro area and 3–4% in the United States (see also Graph 1). Inflation may thus come down even as nominal wage growth remains robust, provided that profit margins moderate somewhat. The markup is indeed projected to marginally weaken in both economies, although at different times. In the euro area, markup would decline in 2023 and remain stable in 2024, after having risen in 2022. In the United States, the markup, having declined in 2022, would remain basically flat in 2023, before partially recovering in the second half of 2024.

By contrast, the dynamics of real wages differ markedly on each side of the Atlantic. In the euro area, by the end of 2024, real wages will return to positive growth rates. But these will remain too low to fully recoup the fall incurred in 2022, following the surge in energy prices after the invasion of Ukraine. By contrast, the energy shock was much more muted in the United States; partly as a result, real wages had already stabilised by the end of 2022. They are expected to start rising again in both 2023 and 2024, albeit more slowly than productivity does. This would partially correct for the large increase in ULC recorded in 2022.

The above analysis suggests that inflation may fall to within reach of 2% by late 2024 in both the euro area and the United States, even if nominal wages rise about twice as much, provided that import price growth slows and profit margins at least stabilise. If developments in any of the inflation components put the disinflation process in jeopardy at some point over the course of the next 18 months, when should an alarm bell ring? The answer is: relatively soon. This is because a striking feature of inflation forecast errors is that they correlate strongly across time horizons. This point cannot be taken for granted, as consumer inflation may be highly volatile and one might surmise that short-term projection errors are largely unrelated to medium-term ones. Yet this is not generally the case. Instead, if actual inflation next year is above the forecast formulated now, inflation in the following year is also highly likely to overshoot the forecast. This pattern applies to all forecasters: as shown in Graph 3, the OECD, Consensus, ECB and the Fed forecast errors over an eight-quarter horizon are very highly correlated with the forecast errors over the four-quarter horizon. What is more, the slope of the line that relates medium- to short-term projection errors is not far from unity, implying that forecast errors are not only highly correlated but they tend to be similar in size. This implies that, if inflation in 2023 turns out higher than projected, the benign disinflation currently expected over the medium term would become less likely. Thus, actual inflation and its components in 2023 will provide an early indication of whether the monetary policy stance needs adjusting.

Sarah Breeden, Executive Director for Financial Stability Strategy and Risk of the Bank of England, gave a speech titled Investing in financial stability:

But corporate debt can come with spillovers – where actions after a shock can amplify its effect on others (externalities and market failures as an economist would say), with potential consequences for the stability of the financial system. The FPC has identified two main channels through which this could happen.

The first operates through lender resilience and brings the risk of a ‘credit crunch’. Over-indebted companies might face challenges servicing their debt. And if they default, lender losses can test lender resilience and hence provision of credit to the economy more broadly. The second operates through borrower resilience and brings the risk of ‘debt overhang ’. In a downturn, more highly indebted corporates can reduce investment and employment by more than those with less debt, as we saw during the global financial crisis (GFC). This behaviour can amplify macroeconomic downturns, further affecting corporate resilience, and potentially also increasing losses for lenders on other forms of lending.

Research shows that the credit crunch following the GFC caused direct damage to companies and the real economy over and above the effects of a normal downturn. Back then, banks with weaker capital ratios and those more exposed to the US mortgage market constrained lending activity by more than other lenders as they focused on rebuilding their own balance sheets.

This had wide-ranging consequences: as I’ve mentioned before, those directly affected by this credit crunch cut their investment more than unaffected companies. These same companies also experienced weaker productivity growth and were more likely to fail . And other companies exposed to these directly affected companies reduced their own employment, grew more slowly and achieved lower productivity.

There is evidence this had a sizable impact in aggregate. Studies show that the excessive tightening of corporate financing conditions during the GFC accounted for 33-50% of the increase in SME unemployment in the United States, while contributing to 12.5-30% of the reduction in productivity among Italian corporates.

Banks are not the only providers of finance to the real economy. UK corporates, particularly large ones, have become increasingly dependent on financial markets as a source of lending. Indeed, market-based finance as a share of aggregate corporate debt has increased from 40% in 2009 to over 50% in 2022, accounting for nearly all of the increase in net lending since 2007.

In theory, the availability of market-based finance helps mitigate credit supply disruptions, as the existence of a strong market channel avoids over-reliance on bank funding. In addition, some market-based investors have long-term investment horizons and may be well placed to look through short-term dynamics.[3]

But increased dependence on market-based finance leaves UK corporates exposed to new shocks, especially in riskier market segments, like high-yield bond, leveraged lending, or private credit markets. Globally, these markets have almost doubled in size over the past decade. A sudden or disproportionate reduction in investor appetite for these assets, in combination with forced sales and sharp falls in asset prices, could impact UK firms’ ability to access funding, potentially forcing some companies to delever or even default. And given the interconnected nature of these markets, this is not a purely domestic challenge: UK borrowers are exposed to any deterioration in global risk appetite.

One potential trigger for loss of investor appetite is so called ‘fallen angels’ – companies whose credit has been downgraded to sub-investment grade. This is a vulnerability the FPC keeps an eye on, as it could have amplifying effects – with forced selling and many investors scrambling to sell assets at the same time, either because investment mandates prevent them from holding such bonds, or to avoid higher capital requirements associated with riskier debt.

So to facilitate the type of investment we need, we need patient funding. That means pools of capital with the right long-term investment horizon, and well-designed investment structures to channel this capital into companies and projects that need it.

The FPC has been active in both these areas. On pools of capital, we have worked with other UK authorities to set up the Productive Finance Working group, which brought together experts from across the financial services industry. The group has produced recommendations and guides to support defined contribution (DC) pension schemes safely investing in less liquid assets. This is in itself a great investment – DC scheme assets more than doubled over the last ten years, and are projected to be around £1.2 trillion by 2035. So the benefits to pension scheme members of long-term investment gains, and to businesses of accessing this pool of capital, will only grow over time.

We also need the right structures to facilitate long-term investment, which links back to our focus on financial stability. Like the CFOs looking to fund long-term projects with long-term investment, we worry when non-bank financial institutions pair illiquid assets – things you can’t sell or exit in a hurry – with short-term liabilities. If investors pull out, the financier needs either to sell assets at a discount, or stop withdrawals – as we saw with commercial property funds in Brexit and Covid.

And because once you suspect others of withdrawing it is rational to do so yourself, ‘run dynamics’ can escalate quickly.

That’s why the FPC has been supportive of work by the Productive Finance Working Group, the FCA and others on the long-term asset fund (LTAF) – a new type of UK fund structure specifically designed for investment in long-term, less liquid assets. From an FPC perspective it ticks the boxes for both our primary and secondary objectives. And just last month the FCA authorised the first LTAFs – hopefully the first of many.

It seems that an LTAF has two key attributes:

LTAFs offer long-term investors access to a wide range of assets, including private market investments, which have until now been available only to a minority of investors. The LTAF will offer new investment opportunities and choice to a bigger group. The wider economy will benefit as LTAFs should also bring fresh capital into important new projects such as infrastructure.

The LTAF will be an “open ended” fund, meaning it can grow to accommodate new investor demand by issuing new “shares”. It will also enable investors to withdraw their money, by cancelling shares, according to agreed rules. The shares in the fund will reflect the value of the fund’s holdings.

The fund’s liquidity – the ability to raise ready money in order to meet investors’ potential withdrawals – will be carefully managed. Investors will be able to buy into, or sell out of, the fund, at longer intervals than traditional open ended funds which deal daily. A portion of an LTAF’s assets may, for example, be in listed assets which can be sold more quickly and where a price is more readily available. The rest may be private assets which take longer to sell, or liquidate. The mix and nature of the assets will determine how often investors will be able to buy or sell the fund.

Mirroring this, there are rules to govern the frequency with which the fund’s investments, including private assets, are valued.

It has also been pointed out:

Open-ended funds that invest in illiquid underlying assets but permit daily dealing without notice, can create a liquidity mismatch, which is both hard for fund managers to deal with and potentially brings wider systemic risks. The FCA therefore decided that there must be consistency between the notice required from investors to redeem and how long it will take the LTAF realistically to sell its assets. The FCA rules require at least a 90-day notice period for redemptions (discussed further below).

The LTAF is an open-ended fund. However, with a minimum notice period of 90 days to redeem and dealing not allowed more frequently than monthly (plus other permitted liquidity tools), the LTAF looks quite different to other types of FCA authorised funds. Given the nature of the LTAF assets, the FCA has decided that the LTAF can redeem units no more often than monthly – daily dealing is not permitted. In addition, the rules require the LTAF to have a minimum notice period for redemptions of at least 90 days. In practice, the FCA expects that many LTAFs will have significantly longer notice periods.

The period between dealing days will depend on the reasonable expectations of the target investor base and the objectives and policy of the LTAF.

In addition, the rules allow managers to use a range of liquidity management tools appropriate to investment in illiquid assets, if they are disclosed clearly to investors.

Permitted liquidity management tools
LTAFs will be permitted to use various liquidity management tools that take account of the liquidity profile of the underlying assets, these include:
Notice periods on redemptions and subscriptions (including minimum redemption notice period of 90 days).
Initial lock-in periods and minimum holding periods.
Deferral of redemptions.
Limits or caps on the number of units that can be redeemed on one occasion or over a period of time.
Side pockets.
Any liquidity management tools must be clearly disclosed in the prospectus (including worked examples of what they mean for investors in practice).

The FCA is clear that an LTAF should not expect to use (nor rely on) suspension as a means of managing fund liquidity in the normal course of events. The FCA also expects the manager to be able to manage its liquidity so that it would not be forced to sell assets unexpectedly or over a time period when it could not achieve an appropriate value.

Ultimately, it will be for the manager to demonstrate to the FCA during the LTAF application for authorisation process, that its suggested liquidity management tools are appropriate for the investment strategy of the LTAF.

Under the new rules for RMMIs as regards retail investors:

  • retail investors who receive advice, would be able to access the LTAF subject to the new risk warning and risk summary being provided and of course the suitability test must be met.
  • In respect of direct offer financial promotions, retail investors (who are not otherwise certified, self-certified sophisticated or certified HNWIs), will be able to invest up to 10 per cent of their investable assets into an LTAF or other RMMI products (in total) (referred to as restricted investors). Firms will need to take reasonable steps to establish that a retail client is certified as a restricted investor. The new forms of certification, including for restricted investors, are contained in COBS 4 Annex 5R. In addition the appropriateness test must be met.
HIMIPref™ Preferred Indices
These values reflect the December 2008 revision of the HIMIPref™ Indices

Values are provisional and are finalized monthly
Index Mean
Current
Yield
(at bid)
Median
YTW
Median
Average
Trading
Value
Median
Mod Dur
(YTW)
Issues Day’s Perf. Index Value
Ratchet 0.00 % 0.00 % 0 0.00 0 0.0893 % 2,154.7
FixedFloater 0.00 % 0.00 % 0 0.00 0 0.0893 % 4,132.6
Floater 10.46 % 10.66 % 50,782 8.96 2 0.0893 % 2,381.6
OpRet 0.00 % 0.00 % 0 0.00 0 -0.2746 % 3,350.9
SplitShare 5.02 % 7.61 % 42,145 2.54 7 -0.2746 % 4,001.7
Interest-Bearing 0.00 % 0.00 % 0 0.00 0 -0.2746 % 3,122.3
Perpetual-Premium 0.00 % 0.00 % 0 0.00 0 -0.0996 % 2,714.7
Perpetual-Discount 6.29 % 6.38 % 42,234 13.36 34 -0.0996 % 2,960.2
FixedReset Disc 5.98 % 8.15 % 83,849 11.50 63 -0.0161 % 2,081.1
Insurance Straight 6.16 % 6.36 % 57,653 13.34 19 -0.3593 % 2,919.4
FloatingReset 10.57 % 11.08 % 51,544 8.66 2 0.5519 % 2,366.0
FixedReset Prem 6.97 % 6.71 % 312,557 12.64 1 -0.2376 % 2,317.3
FixedReset Bank Non 0.00 % 0.00 % 0 0.00 0 -0.0161 % 2,127.3
FixedReset Ins Non 6.02 % 7.39 % 78,099 12.00 11 0.3913 % 2,315.7
Performance Highlights
Issue Index Change Notes
POW.PR.A Perpetual-Discount -2.03 % YTW SCENARIO
Maturity Type : Limit Maturity
Maturity Date : 2053-05-19
Maturity Price : 21.44
Evaluated at bid price : 21.70
Bid-YTW : 6.54 %
IFC.PR.F Insurance Straight -2.00 % YTW SCENARIO
Maturity Type : Limit Maturity
Maturity Date : 2053-05-19
Maturity Price : 21.72
Evaluated at bid price : 22.00
Bid-YTW : 6.11 %
TRP.PR.D FixedReset Disc -1.97 % YTW SCENARIO
Maturity Type : Limit Maturity
Maturity Date : 2053-05-19
Maturity Price : 14.90
Evaluated at bid price : 14.90
Bid-YTW : 9.40 %
IFC.PR.K Perpetual-Discount -1.94 % YTW SCENARIO
Maturity Type : Limit Maturity
Maturity Date : 2053-05-19
Maturity Price : 21.25
Evaluated at bid price : 21.25
Bid-YTW : 6.29 %
IFC.PR.C FixedReset Disc -1.79 % YTW SCENARIO
Maturity Type : Limit Maturity
Maturity Date : 2053-05-19
Maturity Price : 16.50
Evaluated at bid price : 16.50
Bid-YTW : 8.19 %
TRP.PR.G FixedReset Disc -1.54 % YTW SCENARIO
Maturity Type : Limit Maturity
Maturity Date : 2053-05-19
Maturity Price : 15.37
Evaluated at bid price : 15.37
Bid-YTW : 9.17 %
GWO.PR.G Insurance Straight -1.43 % YTW SCENARIO
Maturity Type : Limit Maturity
Maturity Date : 2053-05-19
Maturity Price : 20.75
Evaluated at bid price : 20.75
Bid-YTW : 6.38 %
TRP.PR.C FixedReset Disc -1.40 % YTW SCENARIO
Maturity Type : Limit Maturity
Maturity Date : 2053-05-19
Maturity Price : 10.55
Evaluated at bid price : 10.55
Bid-YTW : 9.99 %
POW.PR.G Perpetual-Discount -1.36 % YTW SCENARIO
Maturity Type : Limit Maturity
Maturity Date : 2053-05-19
Maturity Price : 21.54
Evaluated at bid price : 21.80
Bid-YTW : 6.51 %
TD.PF.B FixedReset Disc -1.21 % YTW SCENARIO
Maturity Type : Limit Maturity
Maturity Date : 2053-05-19
Maturity Price : 16.30
Evaluated at bid price : 16.30
Bid-YTW : 8.29 %
RY.PR.S FixedReset Disc -1.08 % YTW SCENARIO
Maturity Type : Limit Maturity
Maturity Date : 2053-05-19
Maturity Price : 19.25
Evaluated at bid price : 19.25
Bid-YTW : 7.32 %
IFC.PR.E Insurance Straight -1.07 % YTW SCENARIO
Maturity Type : Limit Maturity
Maturity Date : 2053-05-19
Maturity Price : 21.29
Evaluated at bid price : 21.29
Bid-YTW : 6.21 %
CU.PR.J Perpetual-Discount 1.06 % YTW SCENARIO
Maturity Type : Limit Maturity
Maturity Date : 2053-05-19
Maturity Price : 19.05
Evaluated at bid price : 19.05
Bid-YTW : 6.27 %
BN.PR.K Floater 1.09 % YTW SCENARIO
Maturity Type : Limit Maturity
Maturity Date : 2053-05-19
Maturity Price : 11.12
Evaluated at bid price : 11.12
Bid-YTW : 10.84 %
TD.PF.E FixedReset Disc 1.17 % YTW SCENARIO
Maturity Type : Limit Maturity
Maturity Date : 2053-05-19
Maturity Price : 17.35
Evaluated at bid price : 17.35
Bid-YTW : 8.11 %
MFC.PR.Q FixedReset Ins Non 1.18 % YTW SCENARIO
Maturity Type : Limit Maturity
Maturity Date : 2053-05-19
Maturity Price : 20.54
Evaluated at bid price : 20.54
Bid-YTW : 7.22 %
BIP.PR.E FixedReset Disc 1.48 % YTW SCENARIO
Maturity Type : Limit Maturity
Maturity Date : 2053-05-19
Maturity Price : 21.25
Evaluated at bid price : 21.25
Bid-YTW : 7.67 %
TRP.PR.F FloatingReset 1.50 % YTW SCENARIO
Maturity Type : Limit Maturity
Maturity Date : 2053-05-19
Maturity Price : 14.90
Evaluated at bid price : 14.90
Bid-YTW : 11.08 %
ELF.PR.H Perpetual-Discount 1.59 % YTW SCENARIO
Maturity Type : Limit Maturity
Maturity Date : 2053-05-19
Maturity Price : 21.49
Evaluated at bid price : 21.75
Bid-YTW : 6.40 %
CU.PR.C FixedReset Disc 1.65 % YTW SCENARIO
Maturity Type : Limit Maturity
Maturity Date : 2053-05-19
Maturity Price : 18.50
Evaluated at bid price : 18.50
Bid-YTW : 7.51 %
GWO.PR.N FixedReset Ins Non 2.21 % YTW SCENARIO
Maturity Type : Limit Maturity
Maturity Date : 2053-05-19
Maturity Price : 12.01
Evaluated at bid price : 12.01
Bid-YTW : 8.46 %
FTS.PR.H FixedReset Disc 2.77 % YTW SCENARIO
Maturity Type : Limit Maturity
Maturity Date : 2053-05-19
Maturity Price : 11.86
Evaluated at bid price : 11.86
Bid-YTW : 9.04 %
Volume Highlights
Issue Index Shares
Traded
Notes
PWF.PR.P FixedReset Disc 20,000 YTW SCENARIO
Maturity Type : Limit Maturity
Maturity Date : 2053-05-19
Maturity Price : 12.18
Evaluated at bid price : 12.18
Bid-YTW : 8.76 %
BMO.PR.E FixedReset Disc 13,884 YTW SCENARIO
Maturity Type : Limit Maturity
Maturity Date : 2053-05-19
Maturity Price : 20.01
Evaluated at bid price : 20.01
Bid-YTW : 7.43 %
TRP.PR.B FixedReset Disc 12,700 YTW SCENARIO
Maturity Type : Limit Maturity
Maturity Date : 2053-05-19
Maturity Price : 10.05
Evaluated at bid price : 10.05
Bid-YTW : 10.19 %
SLF.PR.E Insurance Straight 11,300 YTW SCENARIO
Maturity Type : Limit Maturity
Maturity Date : 2053-05-19
Maturity Price : 19.25
Evaluated at bid price : 19.25
Bid-YTW : 5.94 %
MFC.PR.Q FixedReset Ins Non 10,600 YTW SCENARIO
Maturity Type : Limit Maturity
Maturity Date : 2053-05-19
Maturity Price : 20.54
Evaluated at bid price : 20.54
Bid-YTW : 7.22 %
There were 0 other index-included issues trading in excess of 10,000 shares.
Wide Spread Highlights
Issue Index Quote Data and Yield Notes
BMO.PR.W FixedReset Disc Quote: 16.35 – 24.95
Spot Rate : 8.6000
Average : 4.8298

YTW SCENARIO
Maturity Type : Limit Maturity
Maturity Date : 2053-05-19
Maturity Price : 16.35
Evaluated at bid price : 16.35
Bid-YTW : 8.17 %

CM.PR.Q FixedReset Disc Quote: 17.10 – 18.95
Spot Rate : 1.8500
Average : 1.2996

YTW SCENARIO
Maturity Type : Limit Maturity
Maturity Date : 2053-05-19
Maturity Price : 17.10
Evaluated at bid price : 17.10
Bid-YTW : 8.18 %

CU.PR.J Perpetual-Discount Quote: 19.05 – 22.00
Spot Rate : 2.9500
Average : 2.5313

YTW SCENARIO
Maturity Type : Limit Maturity
Maturity Date : 2053-05-19
Maturity Price : 19.05
Evaluated at bid price : 19.05
Bid-YTW : 6.27 %

TD.PF.A FixedReset Disc Quote: 16.26 – 17.00
Spot Rate : 0.7400
Average : 0.5013

YTW SCENARIO
Maturity Type : Limit Maturity
Maturity Date : 2053-05-19
Maturity Price : 16.26
Evaluated at bid price : 16.26
Bid-YTW : 8.21 %

IFC.PR.K Perpetual-Discount Quote: 21.25 – 22.00
Spot Rate : 0.7500
Average : 0.5332

YTW SCENARIO
Maturity Type : Limit Maturity
Maturity Date : 2053-05-19
Maturity Price : 21.25
Evaluated at bid price : 21.25
Bid-YTW : 6.29 %

GWO.PR.Y Insurance Straight Quote: 18.25 – 19.00
Spot Rate : 0.7500
Average : 0.5593

YTW SCENARIO
Maturity Type : Limit Maturity
Maturity Date : 2053-05-19
Maturity Price : 18.25
Evaluated at bid price : 18.25
Bid-YTW : 6.27 %

May 18, 2023

Thursday, May 18th, 2023

Jobs? There’s lots of jobs!

The number of Canadians receiving jobless benefits through Employment Insurance has fallen to a record low, another sign of a tight labour market that is creating plenty of job opportunities.

In March, around 388,000 people received what are known as regular jobless benefits through the EI system, a slight decrease from February and down 27 per cent from a year earlier, according to figures published Thursday by Statistics Canada. (People can also access the EI program for other benefits such as sickness and parental leave.)

This was the lowest number of regular EI beneficiaries in Statscan records that date back to 1997, not including the early months of the COVID-19 pandemic, when the EI program was largely shoved aside and the Canada Emergency Response Benefit (CERB) became the primary mode of providing financial assistance to millions of laid-off people.

That’s good news for construction workers, too!

Real estate developers are launching hundreds of new condo units in the Toronto region this year, as buyer demand grows after months of fretting over higher interest rates.

Ever since the Bank of Canada announced in late January that it would take a break from hiking interest rates, activity in the residential real estate market has started to rebound.

Preconstruction homes are those that have yet to break ground or are under construction, and sales for these projects are often viewed as a bet on the future, because buyers wait years for their units.

The Hoover Institution has released a Working Paper by Amit Seru, Erica Xuewei Jiang, Gregor Matvos and Tomasz Piskorski titled Limited Hedging and Gambling for Resurrection by U.S. Banks During the 2022 Monetary Tightening?:

We analyze the extent to which U.S. banks hedged their asset exposure as the monetary policy tightened in 2022. We use call reports data for interest rate swaps covering close to 95% of all bank assets and supplement it with hand-collected data on broader hedging activity from 10K and 10Q filings for all publicly traded banks (68% of all bank assets). Interest rate swap use is concentrated among larger banks who hedge a small amount of their assets. Over three quarters of all reporting banks report no material use of interest rate swaps. Swap users represent about three quarters of all bank assets, but on average hedge only 4% of their assets and about one quarter of their securities. Only 6% of aggregate assets in the U.S. banking system are hedged by interest rate swaps. We also find limited hedging of interest rate exposure by publicly traded banks and by banks which report the duration of their assets. The use of hedging and other interest rate derivatives was not large enough to offset a significant share of the $2.2 trillion loss in the value of U.S. banks’ assets (Jiang et al. 2023). The duration of bank assets increased during 2022, exposing banks to additional interest rate risk. We find slightly less hedging for banks whose assets were most exposed to interest rate risk. Banks with the most fragile funding – i.e., those with highest uninsured leverage — sold or reduced their hedges during the monetary tightening. This allowed them to record accounting profits but exposed them to further rate increases. These actions are reminiscent of classic gambling for resurrection: if interest rates had decreased, equity would have reaped the profits, but if rates increased, then debtors and the FDIC would absorb the losses.

The BoC has released its Financial System Review 2023:

As the adjustment to higher interest rates continues, future periods of stress are possible, and they could persist longer than the acute stress that happened in March. This could exacerbate two existing vulnerabilities discussed in this document:

  • Fragile liquidity in fixed-income markets—in an environment of increased asset price volatility and elevated funding costs, banks could have less capacity to provide liquidity to financial market participants.
  • The ability of households to service their debt—additional sharp increases to bank funding costs could result in higher lending rates. This would add to the high debt-service burden many mortgage holders already face, leaving them more vulnerable to a decline in income.


The banking system plays a key role in transmitting changes in monetary policy to the economy. As expected, higher global interest rates are increasing the funding costs of Canadian banks, both in wholesale markets and through increased interest rates on deposits.

Compared with their international peers, large Canadian banks rely more heavily on wholesale funding, such as medium- to long-term debt and commercial paper (Chart 4).3

This greater reliance on wholesale funding primarily reflects the fact that Canadian banks keep a larger share of loans and mortgages on their balance sheets than US banks do. As a result, Canadian banks are more reliant on sources of funding that are susceptible to price fluctuations due to market stresses. The cost of wholesale funding depends on financial market conditions, including the prevailing interest rate environment. During the recent stress in the global banking sector, the Bank’s regular engagement with financial system participants revealed that the volume of wholesale funding at terms greater than one year declined significantly, reflecting higher costs.

Retail and commercial deposits are the largest sources of funding for Canadian banks. As interest rates rise, customers move their funds from demand deposits, such as chequing and savings accounts, to term deposits, such as guaranteed investment certificates (Chart 5). Banks typically offer higher interest rates on term deposits, which provide a more stable source of funding but also increase their funding costs.4

Over the past year, macroeconomic and geopolitical events have led to greater volatility in fixed-income markets and a deterioration in market liquidity. The cost of trading has steadily increased over this period, reflecting decreased liquidity in these markets (Chart 8). More recently, the global banking stress temporarily caused a further reduction in fixed-income market liquidity.

  • Elevated interest rates and declining house prices have reduced the financial flexibility of many households. While most households are proving resilient to increases in debt-servicing costs, early signs of financial stress are emerging. The share of households affected by higher interest rates will continue to rise over the next few years as homeowners renew their mortgages.
  • High debt-servicing costs and low homeowner equity make households more vulnerable to default if they experience a drop in income. A severe recession with significant unemployment could lead to more defaults and therefore credit losses for lenders. A rise in credit losses typically causes banks to restrict how much credit they offer to households and firms, potentially amplifying a recession.

Predictions are a dime a dozen, but I put higher than average credence in this one:

Canadians should not expect interest rates to fall back to very low levels seen over the past decade, Bank of Canada Governor Tiff Macklem said on Thursday.

Speaking at a news conference, Mr. Macklem warned that the era of historically low borrowing costs that followed the 2008-09 financial crisis is a thing of the past. The surge in inflation over the past two years, followed by the central bank’s recent rate-hike campaign, have put the economy on a path on which borrowing costs will be persistently higher.

“Nobody should expect that interest rates are going to go back down to the very low levels that we’ve seen over the last decade or so,” Mr. Macklem told reporters following the release of the central bank’s annual Financial System Review.

“We’re in a transition period to a world where interest rates are going to be higher than what many people have gotten used to,” he added. “That transition is going to take a while. And through that transition, that creates some risks.”

Mr. Macklem isn’t alone in this prediction. A number of other central bank chiefs have suggested over the past year that interest rates could be higher going forward due to structural changes in the global economy. The process of globalization, which has put downward pressure on consumer prices, is stalling amid new geopolitical rivalries. Work forces are aging, potentially adding upward pressure on wages.

HIMIPref™ Preferred Indices
These values reflect the December 2008 revision of the HIMIPref™ Indices

Values are provisional and are finalized monthly
Index Mean
Current
Yield
(at bid)
Median
YTW
Median
Average
Trading
Value
Median
Mod Dur
(YTW)
Issues Day’s Perf. Index Value
Ratchet 0.00 % 0.00 % 0 0.00 0 0.0000 % 2,152.7
FixedFloater 0.00 % 0.00 % 0 0.00 0 0.0000 % 4,128.9
Floater 10.47 % 10.56 % 51,337 9.03 2 0.0000 % 2,379.5
OpRet 0.00 % 0.00 % 0 0.00 0 -0.7149 % 3,360.1
SplitShare 5.00 % 7.59 % 43,882 2.54 7 -0.7149 % 4,012.7
Interest-Bearing 0.00 % 0.00 % 0 0.00 0 -0.7149 % 3,130.9
Perpetual-Premium 0.00 % 0.00 % 0 0.00 0 -0.1888 % 2,717.4
Perpetual-Discount 6.28 % 6.36 % 43,294 13.36 34 -0.1888 % 2,963.2
FixedReset Disc 5.98 % 8.14 % 85,736 11.50 63 0.0778 % 2,081.4
Insurance Straight 6.14 % 6.29 % 57,356 13.44 19 -0.2727 % 2,929.9
FloatingReset 10.63 % 11.24 % 52,085 8.55 2 -0.1722 % 2,353.0
FixedReset Prem 6.96 % 6.69 % 317,081 12.67 1 0.3577 % 2,322.8
FixedReset Bank Non 0.00 % 0.00 % 0 0.00 0 0.0778 % 2,127.7
FixedReset Ins Non 6.05 % 7.43 % 78,408 11.96 11 0.0626 % 2,306.6
Performance Highlights
Issue Index Change Notes
FTS.PR.H FixedReset Disc -4.79 % YTW SCENARIO
Maturity Type : Limit Maturity
Maturity Date : 2053-05-18
Maturity Price : 11.54
Evaluated at bid price : 11.54
Bid-YTW : 9.27 %
TD.PF.E FixedReset Disc -2.83 % YTW SCENARIO
Maturity Type : Limit Maturity
Maturity Date : 2053-05-18
Maturity Price : 17.15
Evaluated at bid price : 17.15
Bid-YTW : 8.20 %
GWO.PR.N FixedReset Ins Non -2.00 % YTW SCENARIO
Maturity Type : Limit Maturity
Maturity Date : 2053-05-18
Maturity Price : 11.75
Evaluated at bid price : 11.75
Bid-YTW : 8.64 %
FTS.PR.K FixedReset Disc -1.57 % YTW SCENARIO
Maturity Type : Limit Maturity
Maturity Date : 2053-05-18
Maturity Price : 15.65
Evaluated at bid price : 15.65
Bid-YTW : 8.42 %
PVS.PR.G SplitShare -1.54 % YTW SCENARIO
Maturity Type : Option Certainty
Maturity Date : 2026-02-28
Maturity Price : 25.00
Evaluated at bid price : 23.60
Bid-YTW : 7.60 %
CU.PR.J Perpetual-Discount -1.41 % YTW SCENARIO
Maturity Type : Limit Maturity
Maturity Date : 2053-05-18
Maturity Price : 18.85
Evaluated at bid price : 18.85
Bid-YTW : 6.33 %
PWF.PF.A Perpetual-Discount -1.37 % YTW SCENARIO
Maturity Type : Limit Maturity
Maturity Date : 2053-05-18
Maturity Price : 18.02
Evaluated at bid price : 18.02
Bid-YTW : 6.32 %
CU.PR.F Perpetual-Discount -1.37 % YTW SCENARIO
Maturity Type : Limit Maturity
Maturity Date : 2053-05-18
Maturity Price : 18.05
Evaluated at bid price : 18.05
Bid-YTW : 6.26 %
TD.PF.J FixedReset Disc -1.35 % YTW SCENARIO
Maturity Type : Limit Maturity
Maturity Date : 2053-05-18
Maturity Price : 21.21
Evaluated at bid price : 21.21
Bid-YTW : 7.02 %
BNS.PR.I FixedReset Disc -1.31 % YTW SCENARIO
Maturity Type : Limit Maturity
Maturity Date : 2053-05-18
Maturity Price : 20.40
Evaluated at bid price : 20.40
Bid-YTW : 7.01 %
PVS.PR.K SplitShare -1.26 % YTW SCENARIO
Maturity Type : Hard Maturity
Maturity Date : 2029-05-31
Maturity Price : 25.00
Evaluated at bid price : 21.97
Bid-YTW : 7.18 %
BIP.PR.E FixedReset Disc -1.23 % YTW SCENARIO
Maturity Type : Limit Maturity
Maturity Date : 2053-05-18
Maturity Price : 20.94
Evaluated at bid price : 20.94
Bid-YTW : 7.79 %
SLF.PR.C Insurance Straight -1.20 % YTW SCENARIO
Maturity Type : Limit Maturity
Maturity Date : 2053-05-18
Maturity Price : 18.87
Evaluated at bid price : 18.87
Bid-YTW : 5.99 %
PVS.PR.H SplitShare -1.15 % YTW SCENARIO
Maturity Type : Hard Maturity
Maturity Date : 2027-02-28
Maturity Price : 25.00
Evaluated at bid price : 23.25
Bid-YTW : 7.17 %
GWO.PR.M Insurance Straight -1.12 % YTW SCENARIO
Maturity Type : Limit Maturity
Maturity Date : 2053-05-18
Maturity Price : 22.77
Evaluated at bid price : 23.05
Bid-YTW : 6.39 %
BMO.PR.W FixedReset Disc 1.18 % YTW SCENARIO
Maturity Type : Limit Maturity
Maturity Date : 2053-05-18
Maturity Price : 16.30
Evaluated at bid price : 16.30
Bid-YTW : 8.19 %
BIP.PR.A FixedReset Disc 1.25 % YTW SCENARIO
Maturity Type : Limit Maturity
Maturity Date : 2053-05-18
Maturity Price : 17.00
Evaluated at bid price : 17.00
Bid-YTW : 9.49 %
BMO.PR.T FixedReset Disc 1.30 % YTW SCENARIO
Maturity Type : Limit Maturity
Maturity Date : 2053-05-18
Maturity Price : 16.34
Evaluated at bid price : 16.34
Bid-YTW : 8.22 %
BIP.PR.B FixedReset Disc 1.57 % YTW SCENARIO
Maturity Type : Limit Maturity
Maturity Date : 2053-05-18
Maturity Price : 21.59
Evaluated at bid price : 22.00
Bid-YTW : 8.48 %
CM.PR.Y FixedReset Disc 1.60 % YTW SCENARIO
Maturity Type : Limit Maturity
Maturity Date : 2053-05-18
Maturity Price : 22.44
Evaluated at bid price : 22.90
Bid-YTW : 7.40 %
BN.PF.G FixedReset Disc 1.75 % YTW SCENARIO
Maturity Type : Limit Maturity
Maturity Date : 2053-05-18
Maturity Price : 14.50
Evaluated at bid price : 14.50
Bid-YTW : 9.84 %
IFC.PR.C FixedReset Disc 1.82 % YTW SCENARIO
Maturity Type : Limit Maturity
Maturity Date : 2053-05-18
Maturity Price : 16.80
Evaluated at bid price : 16.80
Bid-YTW : 8.05 %
MFC.PR.Q FixedReset Ins Non 1.86 % YTW SCENARIO
Maturity Type : Limit Maturity
Maturity Date : 2053-05-18
Maturity Price : 20.30
Evaluated at bid price : 20.30
Bid-YTW : 7.30 %
BN.PR.Z FixedReset Disc 2.33 % YTW SCENARIO
Maturity Type : Limit Maturity
Maturity Date : 2053-05-18
Maturity Price : 18.88
Evaluated at bid price : 18.88
Bid-YTW : 8.35 %
PWF.PR.P FixedReset Disc 2.94 % YTW SCENARIO
Maturity Type : Limit Maturity
Maturity Date : 2053-05-18
Maturity Price : 12.25
Evaluated at bid price : 12.25
Bid-YTW : 8.71 %
POW.PR.A Perpetual-Discount 2.98 % YTW SCENARIO
Maturity Type : Limit Maturity
Maturity Date : 2053-05-18
Maturity Price : 21.91
Evaluated at bid price : 22.15
Bid-YTW : 6.40 %
Volume Highlights
Issue Index Shares
Traded
Notes
MFC.PR.J FixedReset Ins Non 67,425 YTW SCENARIO
Maturity Type : Limit Maturity
Maturity Date : 2053-05-18
Maturity Price : 21.62
Evaluated at bid price : 21.96
Bid-YTW : 6.91 %
MFC.PR.K FixedReset Ins Non 44,000 YTW SCENARIO
Maturity Type : Limit Maturity
Maturity Date : 2053-05-18
Maturity Price : 17.81
Evaluated at bid price : 17.81
Bid-YTW : 7.83 %
TRP.PR.E FixedReset Disc 31,700 YTW SCENARIO
Maturity Type : Limit Maturity
Maturity Date : 2053-05-18
Maturity Price : 14.47
Evaluated at bid price : 14.47
Bid-YTW : 9.46 %
IFC.PR.F Insurance Straight 31,224 YTW SCENARIO
Maturity Type : Limit Maturity
Maturity Date : 2053-05-18
Maturity Price : 22.20
Evaluated at bid price : 22.45
Bid-YTW : 5.99 %
BMO.PR.E FixedReset Disc 30,063 YTW SCENARIO
Maturity Type : Limit Maturity
Maturity Date : 2053-05-18
Maturity Price : 20.01
Evaluated at bid price : 20.01
Bid-YTW : 7.43 %
TD.PF.C FixedReset Disc 28,500 YTW SCENARIO
Maturity Type : Limit Maturity
Maturity Date : 2053-05-18
Maturity Price : 16.18
Evaluated at bid price : 16.18
Bid-YTW : 8.25 %
There were 8 other index-included issues trading in excess of 10,000 shares.
Wide Spread Highlights
Issue Index Quote Data and Yield Notes
TRP.PR.E FixedReset Disc Quote: 14.47 – 17.45
Spot Rate : 2.9800
Average : 1.8089

YTW SCENARIO
Maturity Type : Limit Maturity
Maturity Date : 2053-05-18
Maturity Price : 14.47
Evaluated at bid price : 14.47
Bid-YTW : 9.46 %

CU.PR.J Perpetual-Discount Quote: 18.85 – 22.00
Spot Rate : 3.1500
Average : 2.0721

YTW SCENARIO
Maturity Type : Limit Maturity
Maturity Date : 2053-05-18
Maturity Price : 18.85
Evaluated at bid price : 18.85
Bid-YTW : 6.33 %

FTS.PR.H FixedReset Disc Quote: 11.54 – 12.45
Spot Rate : 0.9100
Average : 0.6519

YTW SCENARIO
Maturity Type : Limit Maturity
Maturity Date : 2053-05-18
Maturity Price : 11.54
Evaluated at bid price : 11.54
Bid-YTW : 9.27 %

BN.PR.B Floater Quote: 11.40 – 12.17
Spot Rate : 0.7700
Average : 0.5189

YTW SCENARIO
Maturity Type : Limit Maturity
Maturity Date : 2053-05-18
Maturity Price : 11.40
Evaluated at bid price : 11.40
Bid-YTW : 10.56 %

BMO.PR.Y FixedReset Disc Quote: 17.00 – 17.79
Spot Rate : 0.7900
Average : 0.5433

YTW SCENARIO
Maturity Type : Limit Maturity
Maturity Date : 2053-05-18
Maturity Price : 17.00
Evaluated at bid price : 17.00
Bid-YTW : 8.13 %

CCS.PR.C Insurance Straight Quote: 19.98 – 21.00
Spot Rate : 1.0200
Average : 0.7783

YTW SCENARIO
Maturity Type : Limit Maturity
Maturity Date : 2053-05-18
Maturity Price : 19.98
Evaluated at bid price : 19.98
Bid-YTW : 6.37 %

May 17, 2023

Wednesday, May 17th, 2023

Andrew Bailey, Governor of the Bank of England, gave a speech titled Getting inflation back to the 2% target:

Now, I’d like to push back strongly against one argument you sometimes hear, which is that inflation is high because monetary policy was too loose in the past. My colleagues Ben Broadbent and Silvana Tenreyro countered that assertion in detail in speeches last month.

The headline is that, even if we had had the benefit of full hindsight in the run-up to the war in Ukraine, and ample advanced warning – which for the record we did not, no one did – then in order to keep inflation at around 2%, we would have had to raise Bank Rate well into double digits, sending unemployment much higher than it is today, and we would have had to do so in the middle of the worst pandemic in more than a century. Ben and Silvana’s simulations show that, if we really could have followed this course on monetary policy, and then there had not actually been any subsequent increase in import prices, inflation would have fallen steeply, well into negative territory. And real incomes would have suffered through lower wages as well as much higher unemployment.

Monetary policy can’t make the impact on real incomes go away I’m afraid. What we have to do is to take action to ensure that inflation falls as the external shocks abate – that inflationary impulses from these external sources do
not cause persistent ‘secondround’ effects on domestic wage and price setting that could hold inflation up for longer.

That is why we have increased Bank Rate by nearly 4½ percentage points from December 2021, from 0.1% then to 4.5% now.

There are signs that the labour market is loosening a little. There has been some recovery in labour market participation, especially amongst younger workers, and the number of vacancies has come down from very high levels. The ratio of the number of vacancies to the number of unemployed, a key measure of labour market tightness, has fallen as a result.

Our Agents report that businesses face fewer recruitment difficulties, that employees are moving jobs less frequently, and employers are getting more applications for job vacancies.

But the easing of labour market tightness is happening at a slower pace than we expected in February, and the labour market remains very tight. The number of vacancies remains significantly higher, relative to the number of unemployed, than before the pandemic, and employment figures have been strong.

So while we expect CPI inflation to fall quite sharply as energy costs begin to ease, albeit at a somewhat slower pace than projected in February given the near-term outlook for food prices, the outlook for inflation further out is more uncertain and depends on the extent of persistence in wage and price setting.

In the MPC’s baseline modal projection from its May Report, which is conditional on a market-implied path for Bank Rate that peaks at 4¾% in the fourth quarter of this year, an increasing degree of economic slack, combined with declining external pressures, lead inflation to fall materially below the 2% target in the medium term.

Importantly, however, the Committee continues to judge that the risks to inflation are skewed significantly to the upside, primarily reflecting the possibility of more persistence in domestic wage and price setting. We think the unwinding of second-round effects may take longer than it did for them to emerge.

The Cleveland Fed has released a Working Paper by Pierlauro Lopez titled Welfare Implications of Asset Pricing Facts: Should Central Banks Fill Gaps or Remove Volatility?:

I find that removing consumption volatility is a priority over filling the gap between consumption and its flexible-price counterpart, or inflation targeting, in a model that matches empirical measures of the welfare costs of consumption fluctuations. Nearly 30 years of financial market data suggest sizable welfare costs of fluctuations that can be decomposed into a term structure that is downward-sloping on average, especially during downturns. This evidence offers guidance in selecting a model to study the benefits of macroeconomic stabilization from a structural perspective. The addition of nonlinear external habit formation to a textbook New Keynesian model can rationalize the evidence, and it offers a framework suitable for studying the desirability of removing fluctuations. The model is nearly observationally equivalent in its quantity implications to a standard New Keynesian model with CRRA utility, but the asset pricing and optimal policy implications are dramatically different. In the model, a central bank that minimizes consumption volatility generates welfare improvements relative to an inflation targeting regime that are equivalent to a 25 percent larger consumption stream.

Klaas Knot, President of the Netherlands Bank, gave a speech titled Mamma Mia, here we go again? Lessons from Silikon
Valley Bank and Credit Suisse
:

Roughly a month ago, on the other side of the Atlantic, Silicon Valley Bank failed. The reason for this was a classic bank run. Similar to bank runs in the past. Different in that this bank run was a direct consequence of SVB’s specific business model. One that created a maturity mismatch: the interest rate on assets was fixed for longer than the interest rate on liabilities. On top of that, SVB made little use of interest rate derivatives to hedge this risk. The name of the game was serious risk mismanagement.

SVB’s 2021 annual report shows that a 2 percent interest rate hike would have led to a 35.3 percent decrease in capital by the end of 2021. If the Basel interest rate risk standards had been in place, this would have set off a series of alarm bells. Because, according to these risk standards, this position should not exceed 15 percent of capital. And if it were to exceed 15 percent, the financial supervisor should intervene.

But the Basel interest rate risk standards were not in place. So, it’s not the case that the supervisor didn’t hear the alarm bells. It’s not that the alarm bells were quiet. It’s that the alarm bells simply weren’t ring, ring, ringing.

What else can we learn from the SVB failure?

SVB was a relatively small bank in the US, working mainly with tech companies. But when it comes to buffers, the size of the institution is irrelevant. Every bank, whatever the size, whatever the scope, whatever the geographic location, should maintain strong buffers.

Because a second lesson we have now learned, is that even a bank that was not considered to be a systemic bank, could still cause a lot of stress in the financial markets. Stress that could possibly have been avoided with sufficient buffers. Stress that, knowing me, knowing you, surely got us thinking about what we can do to improve our current policies further.

And this brings me to my third reflection in the aftermath of SVB – or rather a few questions that might serve as food for thought.

For starters, we need to make sure that our policies are up to date – and I mean that quite literally. Are our policies in sync with today’s society? A society that, for a large part, is characterised by digitalisation and social media. A society in which, precisely because of this, liquidity risk seems to have become more acute.

Indeed, it cannot be denied that the speed at which deposits were withdrawn from SVB was much faster than expected – much faster than LCR calculations take into account. And so, should LCR be calibrated differently? And/or do we need to better stress test it?

Also – are there shortcomings in the way we look at interest rate risk? Should supervisors consider more frequently, and for each individual bank, whether additional Pillar 2 requirements are necessary, based on the bank’s risk profile?

And finally, should unrealised losses – that is the difference between market and book value for bonds which are held to maturity on banks’ balance sheets – should those unrealised losses be better reflected in the capitalisation
of banks? And should we look at how instruments, that are not marked to market daily, are reflected in liquidity buffers?

I don’t have an answer to these questions. But I do think they should be addressed. So that we can learn everything there is to learn from what happened at SVB.

PerpetualDiscounts now yield 6.34%, equivalent to 8.24% interest at the standard equivalency factor of 1.3x. Long corporates yielded 4.98% on 2023-5-5 and since then the closing price has changed from 15.21 to 15.17, a decline of 26bp in price, with a Duration of 12.32 (BMO doesn’t specify whether this is Macaulay or Modified Duration; I will assume Modified) which implies an inccrease in yield of about 2bp since 5/5 to 5.00%, so the pre-tax interest-equivalent spread (in this context, the “Seniority Spread”) has widened to about 325bp from the 315bp reported May 10.

HIMIPref™ Preferred Indices
These values reflect the December 2008 revision of the HIMIPref™ Indices

Values are provisional and are finalized monthly
Index Mean
Current
Yield
(at bid)
Median
YTW
Median
Average
Trading
Value
Median
Mod Dur
(YTW)
Issues Day’s Perf. Index Value
Ratchet 0.00 % 0.00 % 0 0.00 0 1.0374 % 2,152.7
FixedFloater 0.00 % 0.00 % 0 0.00 0 1.0374 % 4,128.9
Floater 10.47 % 10.56 % 53,296 9.04 2 1.0374 % 2,379.5
OpRet 0.00 % 0.00 % 0 0.00 0 0.7385 % 3,384.3
SplitShare 4.97 % 6.97 % 43,276 2.55 7 0.7385 % 4,041.6
Interest-Bearing 0.00 % 0.00 % 0 0.00 0 0.7385 % 3,153.4
Perpetual-Premium 0.00 % 0.00 % 0 0.00 0 -0.2931 % 2,722.5
Perpetual-Discount 6.27 % 6.34 % 43,055 13.40 34 -0.2931 % 2,968.8
FixedReset Disc 5.99 % 8.16 % 86,436 11.48 63 -0.4407 % 2,079.8
Insurance Straight 6.12 % 6.30 % 58,298 13.43 19 -0.5244 % 2,937.9
FloatingReset 10.61 % 11.23 % 49,493 8.56 2 0.0344 % 2,357.1
FixedReset Prem 6.98 % 6.71 % 318,639 12.64 1 -0.1587 % 2,314.6
FixedReset Bank Non 0.00 % 0.00 % 0 0.00 0 -0.4407 % 2,126.0
FixedReset Ins Non 6.05 % 7.47 % 78,343 11.92 11 -0.0574 % 2,305.2
Performance Highlights
Issue Index Change Notes
BN.PF.G FixedReset Disc -3.72 % YTW SCENARIO
Maturity Type : Limit Maturity
Maturity Date : 2053-05-17
Maturity Price : 14.25
Evaluated at bid price : 14.25
Bid-YTW : 10.00 %
CU.PR.I FixedReset Disc -3.46 % YTW SCENARIO
Maturity Type : Limit Maturity
Maturity Date : 2053-05-17
Maturity Price : 22.25
Evaluated at bid price : 22.62
Bid-YTW : 7.24 %
POW.PR.A Perpetual-Discount -3.33 % YTW SCENARIO
Maturity Type : Limit Maturity
Maturity Date : 2053-05-17
Maturity Price : 21.51
Evaluated at bid price : 21.51
Bid-YTW : 6.61 %
BN.PR.Z FixedReset Disc -3.00 % YTW SCENARIO
Maturity Type : Limit Maturity
Maturity Date : 2053-05-17
Maturity Price : 18.45
Evaluated at bid price : 18.45
Bid-YTW : 8.54 %
BIP.PR.A FixedReset Disc -2.95 % YTW SCENARIO
Maturity Type : Limit Maturity
Maturity Date : 2053-05-17
Maturity Price : 16.79
Evaluated at bid price : 16.79
Bid-YTW : 9.60 %
CM.PR.Y FixedReset Disc -2.63 % YTW SCENARIO
Maturity Type : Limit Maturity
Maturity Date : 2053-05-17
Maturity Price : 21.96
Evaluated at bid price : 22.54
Bid-YTW : 7.51 %
CCS.PR.C Insurance Straight -2.22 % YTW SCENARIO
Maturity Type : Limit Maturity
Maturity Date : 2053-05-17
Maturity Price : 19.80
Evaluated at bid price : 19.80
Bid-YTW : 6.42 %
CU.PR.D Perpetual-Discount -2.02 % YTW SCENARIO
Maturity Type : Limit Maturity
Maturity Date : 2053-05-17
Maturity Price : 19.40
Evaluated at bid price : 19.40
Bid-YTW : 6.34 %
BMO.PR.Y FixedReset Disc -1.83 % YTW SCENARIO
Maturity Type : Limit Maturity
Maturity Date : 2053-05-17
Maturity Price : 17.13
Evaluated at bid price : 17.13
Bid-YTW : 8.07 %
RY.PR.Z FixedReset Disc -1.49 % YTW SCENARIO
Maturity Type : Limit Maturity
Maturity Date : 2053-05-17
Maturity Price : 16.50
Evaluated at bid price : 16.50
Bid-YTW : 8.16 %
CM.PR.Q FixedReset Disc -1.45 % YTW SCENARIO
Maturity Type : Limit Maturity
Maturity Date : 2053-05-17
Maturity Price : 17.05
Evaluated at bid price : 17.05
Bid-YTW : 8.20 %
BMO.PR.T FixedReset Disc -1.41 % YTW SCENARIO
Maturity Type : Limit Maturity
Maturity Date : 2053-05-17
Maturity Price : 16.13
Evaluated at bid price : 16.13
Bid-YTW : 8.32 %
GWO.PR.R Insurance Straight -1.27 % YTW SCENARIO
Maturity Type : Limit Maturity
Maturity Date : 2053-05-17
Maturity Price : 19.37
Evaluated at bid price : 19.37
Bid-YTW : 6.30 %
SLF.PR.E Insurance Straight -1.03 % YTW SCENARIO
Maturity Type : Limit Maturity
Maturity Date : 2053-05-17
Maturity Price : 19.25
Evaluated at bid price : 19.25
Bid-YTW : 5.94 %
FTS.PR.H FixedReset Disc 1.00 % YTW SCENARIO
Maturity Type : Limit Maturity
Maturity Date : 2053-05-17
Maturity Price : 12.12
Evaluated at bid price : 12.12
Bid-YTW : 8.85 %
BN.PR.N Perpetual-Discount 1.05 % YTW SCENARIO
Maturity Type : Limit Maturity
Maturity Date : 2053-05-17
Maturity Price : 18.22
Evaluated at bid price : 18.22
Bid-YTW : 6.63 %
FTS.PR.G FixedReset Disc 1.06 % YTW SCENARIO
Maturity Type : Limit Maturity
Maturity Date : 2053-05-17
Maturity Price : 17.18
Evaluated at bid price : 17.18
Bid-YTW : 7.87 %
PVS.PR.H SplitShare 1.16 % YTW SCENARIO
Maturity Type : Hard Maturity
Maturity Date : 2027-02-28
Maturity Price : 25.00
Evaluated at bid price : 23.52
Bid-YTW : 6.81 %
PVS.PR.J SplitShare 1.27 % YTW SCENARIO
Maturity Type : Hard Maturity
Maturity Date : 2028-02-29
Maturity Price : 25.00
Evaluated at bid price : 22.28
Bid-YTW : 7.39 %
CU.PR.F Perpetual-Discount 1.39 % YTW SCENARIO
Maturity Type : Limit Maturity
Maturity Date : 2053-05-17
Maturity Price : 18.30
Evaluated at bid price : 18.30
Bid-YTW : 6.18 %
BN.PF.F FixedReset Disc 1.40 % YTW SCENARIO
Maturity Type : Limit Maturity
Maturity Date : 2053-05-17
Maturity Price : 15.96
Evaluated at bid price : 15.96
Bid-YTW : 9.41 %
BN.PR.B Floater 2.06 % YTW SCENARIO
Maturity Type : Limit Maturity
Maturity Date : 2053-05-17
Maturity Price : 11.40
Evaluated at bid price : 11.40
Bid-YTW : 10.56 %
PVS.PR.K SplitShare 2.06 % YTW SCENARIO
Maturity Type : Hard Maturity
Maturity Date : 2029-05-31
Maturity Price : 25.00
Evaluated at bid price : 22.25
Bid-YTW : 6.92 %
Volume Highlights
Issue Index Shares
Traded
Notes
TD.PF.A FixedReset Disc 101,400 YTW SCENARIO
Maturity Type : Limit Maturity
Maturity Date : 2053-05-17
Maturity Price : 16.18
Evaluated at bid price : 16.18
Bid-YTW : 8.25 %
BN.PR.T FixedReset Disc 74,679 YTW SCENARIO
Maturity Type : Limit Maturity
Maturity Date : 2053-05-17
Maturity Price : 13.37
Evaluated at bid price : 13.37
Bid-YTW : 9.62 %
TD.PF.B FixedReset Disc 58,150 YTW SCENARIO
Maturity Type : Limit Maturity
Maturity Date : 2053-05-17
Maturity Price : 16.35
Evaluated at bid price : 16.35
Bid-YTW : 8.26 %
TD.PF.C FixedReset Disc 48,000 YTW SCENARIO
Maturity Type : Limit Maturity
Maturity Date : 2053-05-17
Maturity Price : 16.16
Evaluated at bid price : 16.16
Bid-YTW : 8.26 %
CU.PR.G Perpetual-Discount 15,660 YTW SCENARIO
Maturity Type : Limit Maturity
Maturity Date : 2053-05-17
Maturity Price : 18.35
Evaluated at bid price : 18.35
Bid-YTW : 6.16 %
TD.PF.D FixedReset Disc 14,030 YTW SCENARIO
Maturity Type : Limit Maturity
Maturity Date : 2053-05-17
Maturity Price : 17.35
Evaluated at bid price : 17.35
Bid-YTW : 8.08 %
There were 3 other index-included issues trading in excess of 10,000 shares.
Wide Spread Highlights
Issue Index Quote Data and Yield Notes
POW.PR.A Perpetual-Discount Quote: 21.51 – 22.42
Spot Rate : 0.9100
Average : 0.5450

YTW SCENARIO
Maturity Type : Limit Maturity
Maturity Date : 2053-05-17
Maturity Price : 21.51
Evaluated at bid price : 21.51
Bid-YTW : 6.61 %

GWO.PR.T Insurance Straight Quote: 20.66 – 21.49
Spot Rate : 0.8300
Average : 0.5429

YTW SCENARIO
Maturity Type : Limit Maturity
Maturity Date : 2053-05-17
Maturity Price : 20.66
Evaluated at bid price : 20.66
Bid-YTW : 6.34 %

BN.PR.X FixedReset Disc Quote: 13.90 – 14.69
Spot Rate : 0.7900
Average : 0.5102

YTW SCENARIO
Maturity Type : Limit Maturity
Maturity Date : 2053-05-17
Maturity Price : 13.90
Evaluated at bid price : 13.90
Bid-YTW : 9.03 %

IFC.PR.C FixedReset Disc Quote: 16.50 – 18.49
Spot Rate : 1.9900
Average : 1.7126

YTW SCENARIO
Maturity Type : Limit Maturity
Maturity Date : 2053-05-17
Maturity Price : 16.50
Evaluated at bid price : 16.50
Bid-YTW : 8.19 %

PWF.PR.E Perpetual-Discount Quote: 21.63 – 22.40
Spot Rate : 0.7700
Average : 0.5046

YTW SCENARIO
Maturity Type : Limit Maturity
Maturity Date : 2053-05-17
Maturity Price : 21.36
Evaluated at bid price : 21.63
Bid-YTW : 6.42 %

FTS.PR.J Perpetual-Discount Quote: 19.35 – 20.00
Spot Rate : 0.6500
Average : 0.3874

YTW SCENARIO
Maturity Type : Limit Maturity
Maturity Date : 2053-05-17
Maturity Price : 19.35
Evaluated at bid price : 19.35
Bid-YTW : 6.16 %

May 16, 2023

Tuesday, May 16th, 2023

Canadian inflation came in hotter than expected:

Statistics Canada said Tuesday the annual pace of inflation rose in April for the first time since it peaked in June last year.

The agency said its consumer price index was up 4.4 per cent compared with a year ago, up from a year-over-year increase of 4.3 per cent in March.

Statistics Canada said the first tick higher in the annual rate since it peaked at 8.1 per cent in June 2022 was driven by higher mortgage interest costs which were up 28.5 per cent compared with a year ago due to higher interest rates. A 6.1 per cent increase in rent prices also helped push the overall rate up.

Meanwhile, grocery prices, which have been closely watched, were up 9.1 per cent compared with a year ago, but that increase was smaller than the 9.7 per cent year-over-year jump in March.

And rents are ridiculous:

Rent costs across Canada stormed higher in April, with the average monthly rental cost in Toronto hitting $2,526, according to a new report.

A Monday release by Rentals.ca and Urbanation found that when compared with the pandemic lows they hit in April, 2021, rents for condos and purpose-built apartments recorded their largest increases in Vancouver, up 47 per cent, followed by Toronto, up 41 per cent.

The National Rent Report – which measured the overall Canadian rental market between April, 2021 and April, 2023 using listings from the Rentals.ca network – showed average monthly rent has jumped by $340 in that period. Year over year, national average rents were up 9.6 per cent since April, 2022, the report finds.

Canada’s smaller urban centres also saw a notable surge in numbers. In April, Ottawa rents climbed 15-per-cent year over year, while Edmonton saw an 11.8-per-cent climb and Montreal logged a 10.7-per-cent increase.

Among Canada’s biggest cities, Calgary recorded the highest year-over-year monthly rent increase at 22.9 per cent. Canada’s most expensive city, Vancouver, led the way in terms of the highest average monthly rent with one-bedroom units across condo rentals and apartments going for $2,787 and two-bedroom homes listing at $3,741 – a year-over-year climb of 16.8 per cent. In Toronto, that growth was 21.2 per cent, with average rents for condo rentals and apartments sitting at $2,822.

… and this got the bond market excited:
Before release:

… and after:

Added to this were some rumblings from the Fed:

Federal Reserve Bank of Cleveland President Loretta Mester said on Tuesday that she does not think the U.S. central bank is at a point yet where it can hold interest rates steady for a period of time.

“The approach I’m taking is that I would like the policy rate to get to a point where, when I’m thinking about what would the next policy change be, I want it to be equally a potential increase versus a decrease,” Mester told a conference in Dublin.

“When we get the policy to that rate, I think we’re going to be holding for a while in order to make sure that the interest rate is coming back down. So I don’t put it in terms of a pause, I put it in terms of a hold. Have we gotten to that rate yet? At this point, given the data we’ve gotten so far, I would say no.”

There’s a nice piece in the Globe about commercial real-estate, a bit more revealing than usual:

A year into the fastest campaign to hike interest rates in decades, the commercial real estate sector is deadlocked.

In one corner, the world’s most sophisticated private real estate investors, including Canadian pension plans, say scores of properties they own are worth hundreds of millions of dollars each and have held most of their value. In the other, investors are dumping shares of publicly-traded real estate investment trusts (REITs), particularly those that own skyscrapers, because they don’t think such lofty values still make sense. In Canada, the national vacancy rate of office towers just hit an all-time high, and in New York, there are enough empty offices to fill 26 Empire State Buildings.

Who’s right? That’s the trillion-dollar question looming over private investors in particular as they gauge whether to start marking down the value of their property portfolios more aggressively.

Valuing real estate portfolios is tricky work, and private owners – as well as the outside experts they hire to vet their numbers – have leeway in how they appraise properties. By design, most private investors are patient owners with long-term leases who look not only at what a property would fetch today, but its future potential based on cash flows, replacement costs and the values of comparable buildings.

Over time, that makes their results less volatile. But it also raises eyebrows when markets plunge and private valuations don’t follow. The $21.2-billion real estate division of OMERS returned 13.6 per cent in 2022. Ivanhoé Cambridge, the Caisse de dépôt et placement du Québec’s real estate arm that manages $48-billion worth of properties globally, was not far behind with a 12.4-per-cent gain last year.

Well, of course. I’ve never been involved with private equity. Nobody has every let me get into the guts of a large privately owned and review its valuation for the owners. So I can’t speak definitively.

But everything I’ve ever seen convinces me that the purpose of private equity is to lie about its valuation. Same as the purpose of Historical Cost Accounting is to lie about those valuations. It’s a total shell game; every now and then there’s a small reckoning and sooner or later there will be a big one.

As noted on May 4, the TD takeover of First Horizon was terminated … the reason for the termination doesn’t look good on TD:

Toronto-Dominion Bank’s handling of “suspicious” customer transactions was behind regulators’ refusal to approve the lender’s $13.4-billion deal to buy First Horizon, the Wall Street Journal reported on Monday, citing people familiar with the matter.

The reluctance by the Office of the Comptroller of the Currency and the Federal Reserve to give TD a clean bill of health on its anti-money-laundering practices proved to be the biggest obstacle, according to the report.

TD had pledged to regulators that it would make its anti-money-laundering policies more comprehensive and timely, but the assurances were not enough to sway regulators, the WSJ reported.

Prof Claudia Buch, Vice-President of the Deutsche Bundesbank, gave a speech titled Resilient retail banking: Setting the course towards a robust financial sector:

Last week, US supervisory authorities outlined the lessons they had learned, whilst in Switzerland, the repercussions of current developments are under intense discussion. In other countries, too, supervisors and regulators will respond.

This is because these developments in global markets are a reflection of how the financial system has become more vulnerable in recent years. The macroeconomic environment has changed considerably – higher interest rates and heightened uncertainty are likely to stick around for some time to come. The economy and the financial system have been able to cope with the major shocks of recent years relatively well, due not least to comprehensive fiscal and monetary policy measures. Credit risk and insolvencies in the corporate sector have so far been low. However, this harbours the danger that future risks will be underestimated. These vulnerabilities affect retail banking, too. In Germany and Europe, small and medium-sized enterprises in particular benefit from direct contact with local banks. At present, loans are being granted against stricter criteria – this is a reflection of higher interest rates, rising credit risk, and heightened uncertainty. In times of uncertainty, it is precisely better information on the ground that can be a stabilising factor when it comes to lending.

Since 2008, the average tier 1 capital ratio of German banks has risen from less than 10% to around 17%. The non-risk-weighted ratio has gone up, too. At around 8%, this ratio is almost twice as high among smaller banks focusing on retail banking than it is among large, systemically important banks.

Enterprises, too, built up financial buffers during this period. Since 2008, equity ratios among German enterprises have risen from around 25% to slightly more than 30%. By historical standards, enterprises’ liquidity was very good and the financing situation was stable.

Overall, during this period, the greater resilience of the financial system and stable economic developments went hand in hand. Credit supply has not been negatively impacted by the post-crisis reforms – quite the opposite, in fact: lending to households and enterprises has risen consistently and grown dynamically in relation to economic expansion.

Scenarios that were once considered “adverse” have now become a reality. Inflation in Germany, which stood at 6.9% last year and, most recently, 7.6% in April, remains considerably too high. In the past year alone, interest rates have risen by around 300 basis points. For the sake of comparison, the calculation of the Basel interest rate coefficient assumes an increase in interest rates of 200 basis points.

In the short term, the German economy appears relatively robust. Germany’s GDP is expected to record a slight increase of 0.4% in 2023. The pandemic and the energy crisis have barely dented the financial situation of enterprises. This is true even of energyintensive sectors – thanks to an array of economic policy measures and, more
recently, energy prices dropping back again. Corporate profits rose significantly last year.

Lending has risen sharply in recent years. Loans to the private sector stood at around 82% of GDP at the beginning of the pandemic, compared with 87% today. The stock of housing loans peaked at almost 42% of GDP in 2020, although the pace of new lending has recently slackened significantly, in keeping with higher market interest rates.
Banks’ capitalisation actually rose during this period. By recent counts, German banks have surplus capital of around €165 billion in CET1 – that’s around €36 billion more than at the start of the pandemic. With vulnerabilities
having built up in the system at the same time, the Federal Financial Supervisory Authority (BaFin) announced a package of measures at the start of 2022 that, from February 2023, will conserve just under €23 billion (surplus capital) in the form of macroprudential buffers.

When assessing future risks, it must be borne in mind that interest rates have already risen significantly. The higher interest rates are, the weaker the impact of a 200 basis point increase appears to be – in relative terms. That’s why the Basel coefficient is currently pointing to diminishing risks for many institutions. But the actual risks in the stock of loans certainly haven’t got any smaller. You see, the interest rate hikes that have already happened harbour risks and looming losses that are not yet fully reflected on balance sheets. And even if banks stand to benefit from rising interest rates in the longer term, interest margins could narrow initially. On the deposits side, there is mounting pressure from customers wanting higher interest rates. The increased use of online banking and digital comparison websites is stoking competition for deposit business. A study by the Single Supervisory Mechanism (SSM) shows that money held in online accounts is more volatile than in traditional accounts.

On the lending side, with demand tending towards the weaker end of the scale, banks are finding they have less scope to pass on rising costs to customers.

Sufficient capital is the best safeguard against risks. And, looking to the future, many of the issues to be faced are not simply a case of risks that can be predicted, but rather of fundamental uncertainties.

We are facing challenging times. Banks are a central interface when there are changes in the economy and society. And good, traditional retail banking is precisely what is important; it is by no means “boring banking”, as Nobel Prize winner Paul Krugman called it.

The economy is undergoing a period of upheaval, in which risks are rising and uncertainty is high. Sound, forward-looking management of interest rate risk and credit risk will help banks to guide the real economy smoothly through this phase. The use of new, innovative technologies may be of assistance, but should not be an end in itself.

After a long period of relatively stable underlying conditions, there is a danger that future risks will be underestimated.

HIMIPref™ Preferred Indices
These values reflect the December 2008 revision of the HIMIPref™ Indices

Values are provisional and are finalized monthly
Index Mean
Current
Yield
(at bid)
Median
YTW
Median
Average
Trading
Value
Median
Mod Dur
(YTW)
Issues Day’s Perf. Index Value
Ratchet 0.00 % 0.00 % 0 0.00 0 -2.5495 % 2,130.6
FixedFloater 0.00 % 0.00 % 0 0.00 0 -2.5495 % 4,086.5
Floater 10.58 % 10.78 % 53,127 8.88 2 -2.5495 % 2,355.1
OpRet 0.00 % 0.00 % 0 0.00 0 0.1896 % 3,359.5
SplitShare 5.00 % 7.33 % 42,849 2.55 7 0.1896 % 4,012.0
Interest-Bearing 0.00 % 0.00 % 0 0.00 0 0.1896 % 3,130.3
Perpetual-Premium 0.00 % 0.00 % 0 0.00 0 -0.2679 % 2,730.5
Perpetual-Discount 6.25 % 6.32 % 43,751 13.43 34 -0.2679 % 2,977.5
FixedReset Disc 5.96 % 8.12 % 86,188 11.53 63 -0.2380 % 2,089.0
Insurance Straight 6.09 % 6.24 % 59,886 13.51 19 -0.1496 % 2,953.4
FloatingReset 10.62 % 11.23 % 48,364 8.57 2 -0.0688 % 2,356.2
FixedReset Prem 6.97 % 6.70 % 321,409 12.66 1 -0.3953 % 2,318.2
FixedReset Bank Non 0.00 % 0.00 % 0 0.00 0 -0.2380 % 2,135.4
FixedReset Ins Non 6.05 % 7.52 % 78,393 11.86 11 0.1620 % 2,306.5
Performance Highlights
Issue Index Change Notes
POW.PR.B Perpetual-Discount -3.13 % YTW SCENARIO
Maturity Type : Limit Maturity
Maturity Date : 2053-05-16
Maturity Price : 21.07
Evaluated at bid price : 21.07
Bid-YTW : 6.44 %
BN.PR.K Floater -3.08 % YTW SCENARIO
Maturity Type : Limit Maturity
Maturity Date : 2053-05-16
Maturity Price : 11.00
Evaluated at bid price : 11.00
Bid-YTW : 10.95 %
TRP.PR.G FixedReset Disc -2.50 % YTW SCENARIO
Maturity Type : Limit Maturity
Maturity Date : 2053-05-16
Maturity Price : 15.60
Evaluated at bid price : 15.60
Bid-YTW : 9.04 %
BN.PR.B Floater -2.02 % YTW SCENARIO
Maturity Type : Limit Maturity
Maturity Date : 2053-05-16
Maturity Price : 11.17
Evaluated at bid price : 11.17
Bid-YTW : 10.78 %
CU.PR.C FixedReset Disc -1.89 % YTW SCENARIO
Maturity Type : Limit Maturity
Maturity Date : 2053-05-16
Maturity Price : 18.15
Evaluated at bid price : 18.15
Bid-YTW : 7.65 %
BMO.PR.S FixedReset Disc -1.75 % YTW SCENARIO
Maturity Type : Limit Maturity
Maturity Date : 2053-05-16
Maturity Price : 16.88
Evaluated at bid price : 16.88
Bid-YTW : 8.16 %
PWF.PF.A Perpetual-Discount -1.73 % YTW SCENARIO
Maturity Type : Limit Maturity
Maturity Date : 2053-05-16
Maturity Price : 18.18
Evaluated at bid price : 18.18
Bid-YTW : 6.26 %
FTS.PR.H FixedReset Disc -1.51 % YTW SCENARIO
Maturity Type : Limit Maturity
Maturity Date : 2053-05-16
Maturity Price : 12.00
Evaluated at bid price : 12.00
Bid-YTW : 8.93 %
BMO.PR.F FixedReset Disc -1.41 % YTW SCENARIO
Maturity Type : Limit Maturity
Maturity Date : 2053-05-16
Maturity Price : 22.51
Evaluated at bid price : 23.02
Bid-YTW : 7.26 %
TRP.PR.A FixedReset Disc -1.41 % YTW SCENARIO
Maturity Type : Limit Maturity
Maturity Date : 2053-05-16
Maturity Price : 13.33
Evaluated at bid price : 13.33
Bid-YTW : 9.48 %
GWO.PR.Y Insurance Straight -1.35 % YTW SCENARIO
Maturity Type : Limit Maturity
Maturity Date : 2053-05-16
Maturity Price : 18.25
Evaluated at bid price : 18.25
Bid-YTW : 6.27 %
SLF.PR.C Insurance Straight -1.29 % YTW SCENARIO
Maturity Type : Limit Maturity
Maturity Date : 2053-05-16
Maturity Price : 19.10
Evaluated at bid price : 19.10
Bid-YTW : 5.92 %
BMO.PR.E FixedReset Disc -1.23 % YTW SCENARIO
Maturity Type : Limit Maturity
Maturity Date : 2053-05-16
Maturity Price : 20.05
Evaluated at bid price : 20.05
Bid-YTW : 7.41 %
ELF.PR.G Perpetual-Discount -1.01 % YTW SCENARIO
Maturity Type : Limit Maturity
Maturity Date : 2053-05-16
Maturity Price : 18.61
Evaluated at bid price : 18.61
Bid-YTW : 6.47 %
BN.PF.J FixedReset Disc 1.17 % YTW SCENARIO
Maturity Type : Limit Maturity
Maturity Date : 2053-05-16
Maturity Price : 21.43
Evaluated at bid price : 21.70
Bid-YTW : 7.40 %
IFC.PR.G FixedReset Ins Non 1.29 % YTW SCENARIO
Maturity Type : Limit Maturity
Maturity Date : 2053-05-16
Maturity Price : 19.65
Evaluated at bid price : 19.65
Bid-YTW : 7.52 %
FTS.PR.K FixedReset Disc 1.36 % YTW SCENARIO
Maturity Type : Limit Maturity
Maturity Date : 2053-05-16
Maturity Price : 15.85
Evaluated at bid price : 15.85
Bid-YTW : 8.31 %
BN.PF.H FixedReset Disc 1.46 % YTW SCENARIO
Maturity Type : Limit Maturity
Maturity Date : 2053-05-16
Maturity Price : 20.90
Evaluated at bid price : 20.90
Bid-YTW : 8.46 %
BN.PF.I FixedReset Disc 1.72 % YTW SCENARIO
Maturity Type : Limit Maturity
Maturity Date : 2053-05-16
Maturity Price : 20.11
Evaluated at bid price : 20.11
Bid-YTW : 8.39 %
MFC.PR.I FixedReset Ins Non 2.26 % YTW SCENARIO
Maturity Type : Limit Maturity
Maturity Date : 2053-05-16
Maturity Price : 22.07
Evaluated at bid price : 22.60
Bid-YTW : 6.83 %
BN.PF.D Perpetual-Discount 3.39 % YTW SCENARIO
Maturity Type : Limit Maturity
Maturity Date : 2053-05-16
Maturity Price : 18.61
Evaluated at bid price : 18.61
Bid-YTW : 6.70 %
Volume Highlights
Issue Index Shares
Traded
Notes
BMO.PR.S FixedReset Disc 98,615 YTW SCENARIO
Maturity Type : Limit Maturity
Maturity Date : 2053-05-16
Maturity Price : 16.88
Evaluated at bid price : 16.88
Bid-YTW : 8.16 %
MIC.PR.A Perpetual-Discount 47,100 YTW SCENARIO
Maturity Type : Limit Maturity
Maturity Date : 2053-05-16
Maturity Price : 21.00
Evaluated at bid price : 21.00
Bid-YTW : 6.54 %
MFC.PR.K FixedReset Ins Non 33,500 YTW SCENARIO
Maturity Type : Limit Maturity
Maturity Date : 2053-05-16
Maturity Price : 17.88
Evaluated at bid price : 17.88
Bid-YTW : 7.79 %
SLF.PR.D Insurance Straight 30,921 YTW SCENARIO
Maturity Type : Limit Maturity
Maturity Date : 2053-05-16
Maturity Price : 19.05
Evaluated at bid price : 19.05
Bid-YTW : 5.93 %
MFC.PR.J FixedReset Ins Non 20,852 YTW SCENARIO
Maturity Type : Limit Maturity
Maturity Date : 2053-05-16
Maturity Price : 21.68
Evaluated at bid price : 22.05
Bid-YTW : 6.88 %
MFC.PR.Q FixedReset Ins Non 17,850 YTW SCENARIO
Maturity Type : Limit Maturity
Maturity Date : 2053-05-16
Maturity Price : 19.86
Evaluated at bid price : 19.86
Bid-YTW : 7.46 %
There were 8 other index-included issues trading in excess of 10,000 shares.
Wide Spread Highlights
Issue Index Quote Data and Yield Notes
BMO.PR.W FixedReset Disc Quote: 16.22 – 18.35
Spot Rate : 2.1300
Average : 1.4044

YTW SCENARIO
Maturity Type : Limit Maturity
Maturity Date : 2053-05-16
Maturity Price : 16.22
Evaluated at bid price : 16.22
Bid-YTW : 8.23 %

IFC.PR.C FixedReset Disc Quote: 16.50 – 18.49
Spot Rate : 1.9900
Average : 1.4085

YTW SCENARIO
Maturity Type : Limit Maturity
Maturity Date : 2053-05-16
Maturity Price : 16.50
Evaluated at bid price : 16.50
Bid-YTW : 8.18 %

CU.PR.C FixedReset Disc Quote: 18.15 – 19.54
Spot Rate : 1.3900
Average : 0.9150

YTW SCENARIO
Maturity Type : Limit Maturity
Maturity Date : 2053-05-16
Maturity Price : 18.15
Evaluated at bid price : 18.15
Bid-YTW : 7.65 %

POW.PR.B Perpetual-Discount Quote: 21.07 – 21.80
Spot Rate : 0.7300
Average : 0.4312

YTW SCENARIO
Maturity Type : Limit Maturity
Maturity Date : 2053-05-16
Maturity Price : 21.07
Evaluated at bid price : 21.07
Bid-YTW : 6.44 %

TD.PF.J FixedReset Disc Quote: 21.55 – 21.99
Spot Rate : 0.4400
Average : 0.2583

YTW SCENARIO
Maturity Type : Limit Maturity
Maturity Date : 2053-05-16
Maturity Price : 21.55
Evaluated at bid price : 21.55
Bid-YTW : 6.91 %

BNS.PR.I FixedReset Disc Quote: 20.67 – 21.40
Spot Rate : 0.7300
Average : 0.5524

YTW SCENARIO
Maturity Type : Limit Maturity
Maturity Date : 2053-05-16
Maturity Price : 20.67
Evaluated at bid price : 20.67
Bid-YTW : 6.92 %

DBRS Confirms BPO at Pfd-3(low)

Monday, May 15th, 2023

As noted by Assiduous Reader stusClues DBRS has announced that it:

confirmed Brookfield Property Partners L.P.’s (BPP) Issuer Rating and Senior Unsecured Debt rating at BBB (low). DBRS Morningstar also confirmed the ratings on Brookfield Property Finance ULC’s Senior Unsecured Notes and Brookfield Office Properties Inc.’s Senior Unsecured Notes at BBB (low) and Brookfield Office Properties Inc.’s Cumulative Redeemable Preferred Shares, Class AAA at Pfd-3 (low). All trends are Stable. The ratings are based on the credit risk profile of the consolidated entity, including BPP and its subsidiaries (collectively, BPY or the Partnership).

The confirmations and Stable trends consider strong operating results in BPY’s core retail and LP investments segments (i.e., hotels), headwinds facing the office sector, the current elevated interest rate environment and BPY’s variable rate debt exposure, and the recent reorganization of Brookfield Corporation (Brookfield) and other recent transactions whereby BPY acquired LP interests in several real estate funds and other investment interests for $3.1 billion through the issuance of junior preferred shares of Brookfield BPY Holdings Inc. and a non-interest-bearing note. The Stable trends also consider DBRS Morningstar’s resulting updated expectations for BPY’s financial risk metrics. DBRS Morningstar expects that in the near to medium term, BPY will operate with total debt-to-EBITDA and EBITDA interest coverage in the mid-15 times (x) range and 1.1x range, respectively.

The ratings continue to be supported by (1) BPY’s market position as a preeminent global real estate company; (2) high-quality assets, particularly BPY Core Office and Retail segment, with long-term leases to large, recognizable investment-grade-rated tenants; (3) superior diversification, in particular by property, tenant, and geography; and (4) DBRS Morningstar’s view of implicit support from Brookfield. The ratings continue to be constrained by BPY’s weak financial risk assessment as reflected by both its highly leveraged balance sheet (total debt-to-EBITDA of 17.0x for the last 12 months ended December 31, 2022 (LTM)) and low EBITDA interest coverage (1.29x LTM); a riskier retail leasing profile in terms of lease maturities and counterparty risk relative to BPY’s Core Office segment; a higher-risk opportunistic Limited Partnership Investments segment composed primarily of hotel, office, retail, and alternative assets; and DBRS Morningstar’s assessment of the unmitigated structural subordination of the Senior Unsecured Debt at the BPP level relative to a material amount of debt at its operating subsidiaries.

DBRS Morningstar would consider a negative rating action should BPY’s total debt-to-EBITDA not improve as expected such that it remains above 16.0x, or if BPY’s EBITDA interest coverage deteriorates more than expected such that it declines below 1.0x, on a sustained basis, all else equal, or if DBRS Morningstar changes its views on the level and strength of implicit support provided by Brookfield. On the other hand, DBRS Morningstar would consider a positive rating action should DBRS Morningstar’s outlook for BPY’s total debt-to-EBITDA improve to 13.0x or better.

Affected issues are BPO.PR.A, BPO.PR.C, BPO.PR.E, BPO.PR.G, BPO.PR.I, BPO.PR.N, BPO.PR.P, BPO.PR.R and BPO.PR.T.

BPO issues have been absolutely hammered in the past three months, as discussed in the post The Woes of BPO.

I don’t usually report confirmations … but on this one I’m making an exception!

May 15, 2023

Monday, May 15th, 2023

On May 11 I unwisely remarked on the “fine price” CI got for a chunk of its US operation. Oops! I forgot that when the Bay Street Smiley Boys start bragging, it’s time to run:

In a regulatory filing Thursday, CI said that if a future IPO doesn’t meet certain conditions, including size, the company has guaranteed the buyers of the preferred shares a new, higher value for them.

That value increases over time, giving CI an incentive to take the U.S. wealth business public sooner. In three years, the new “stated” price of the preferred shares will jump to 150 per cent of their original price – or a total of $2-billion. It will continue to grow after that, and in six years, it will be 225 per cent of the original price, or $3-billion.

That means the new capital could cost CI at least 14 per cent annually, each year it remains in place.

The buyers of the debt also have the right to force an IPO or sale of the U.S. wealth business within five years and nine months after the closing.

So, people are running:

As Thursday’s trading continued, however, the share price began to slide, and it collapsed Friday to nearly the predeal levels. The swoon in CI’s share price has left its shares shockingly cheap: According to S&P Global Market Intelligence, the stock trades at less than four times the estimate of the company’s next 12 months’ earnings per share, and a little more than six times its EBITDA, or earnings before interest, taxes, depreciation and amortization.

I don’t have an interest, even at three times EBITDA. When a company starts crap like this, you know their back’s up against the wall.

Real estate has started bubbling again:

National home sales jumped by 11.3 per cent between March and April as the real estate market picked up again, but supply remained at a 20 year-low, the Canadian Real Estate Association said Monday.

Seasonally-adjusted sales for the month totalled 38,164 compared with 34,277 in March.

The actual number of homes sold last month amounted to 44,059, down 19.5 per cent from a year prior.

The year-over-year sales decline was markedly smaller than the drops reported in recent months, the association said, attributing the return of sales to home prices, which many feel have bottomed out in recent months as interest rates climbed eight times over the last year.

Those who waded into the market last month found last month’s seasonally-adjusted average price hit $695,887, up 5.7 per cent from March.

The actual average home price was roughly $716,000 in April, down 3.9 per cent from April 2022, but up $103,500 from January 2023.

CREA attributed the gains seen since January to “outsized sales rebounds” in the Greater Toronto Area (GTA) and B.C.’s Lower Mainland, which tend to be hot markets.

Excluding the GTA and Greater Vancouver from the calculation cuts more than $144,000 from the actual national average price, CREA said.

The BoC has released a Staff Discussion Paper by Toni Gravelle, Ron Morrow and Jonathan Witmer titled (deep breath) Reviewing Canada’s Monetary Policy Implementation System: Does the Evolving Environment Support Maintaining a Floor System?:

At the onset of the pandemic, the Bank of Canada transitioned its framework for monetary policy implementation from a corridor system to a floor system, which it has since decided to maintain. This decision was informed by the analysis and assessment of the two frameworks in this paper. We provide a comprehensive analysis of both frameworks and assess their relative merits based on five key criteria that define a sound framework. Our evaluation includes a discussion of how these relative merits have changed since the pandemic began. Specifically, we examine the evolving regulatory landscape, changes in payment systems, and the Bank’s quantitative easing program to understand their implications for the relative strengths of the two frameworks for monetary policy implementation.

Engert, Gravelle and Howard (2008) describe the corridor system used by the Bank.

In a corridor system, the central bank needs to carefully judge the amount reserves needed to incentivize trading near its target for the overnight interest rate. This can be seen in Figure 1 (panel a), where the demand curve is inelastic around the target interest rate. That is, relatively small changes in the supply of reserves (or small shifts in the demand curve, holding supply constant) can cause a large change in the overnight market rate, given the steepness of the demand curve near the target interest rate. Because of this, the effective implementation of a corridor system (i.e., overnight rate trading near target) requires a central bank to have a good ability to forecast demand and the capacity to adjust the supply of reserves in a precise and timely way. The central bank adjusts the supply of reserves in a corridor system through its fine-tuning operations. In Canada, before the COVID-19 pandemic, the amount of settlement balances needed to keep the overnight market rate near the target rate was quite low, roughly $250 million.

In a floor system, the overnight market rate trades at or close to the central bank’s deposit rate (the interest rate for deposited reserves at the central bank). This is because the supply of reserves is more than enough to satisfy financial institutions’ demand for these reserves. Figure 1 (panel b) illustrates how a sufficiently large supply of reserves will cross the lower, elastic part of the demand curve, causing the overnight market rate to be equal to the deposit rate. Financial institutions that participate in the wholesale payments system (i.e., they can earn the deposit rate on their excess reserves) lend out their excess reserves, which lowers the overnight market rate until it is at or near the deposit rate—the so-called floor of the corridor.2 The simple demand curve above assumes that access to the central bank deposit facility is broad and that overnight trading is unsecured. We explain in section 4.1 how these factors may result in a leaky floor where the overnight market rate trades below the deposit rate.

Bindseil (2016) and others have advanced several criteria for evaluating different operational frameworks
for monetary policy. Drawing on this work, we believe the following criteria capture the key characteristics
that are desirable in an operational framework:

  • • Effective control of the target interest rate—The framework should achieve the target interest rate for monetary policy with a high degree of certainty and limited variability. To this end, systematic deviations of the overnight rate from the target should be within the desired tolerance level.
  • • Operational simplicity—Implementation of the framework should require a small number of simple tools. In addition, simplicity means that operations should rely primarily on rules rather than on discretion. The framework should function effectively with a high degree of operational transparency and be easily understood by market participants.
  • • Robustness across different operating environments—The framework should function effectively regardless of whether the central bank is implementing conventional or unconventional monetary policy measures. Further, the framework should operate effectively when the central bank is taking policy actions to support financial stability (e.g., exceptional market-wide liquidity operations or emergency lending assistance).
  • • Resilience to the evolution of market infrastructure—The framework should be able to accommodate new payment, clearing and settlement systems as well as changes to existing systems that settle in central bank money and that can affect the central bank’s balance sheet.
  • • Minimal distortion of market functioning and relative prices—The framework should minimize the extent to which it distorts markets (e.g., creating disincentives for trading or price discovery) or relative prices

Michelle W Bowman, Member of the Board of Governors of the Federal Reserve System, gave a speech titled The Evolving Nature of Banking, Bank Culture, and Bank Runs:

On Thursday, March 9, SVB experienced a deposit outflow of more than $40 billion, and more than $100 billion was anticipated in queue for outflow on Friday, March 10. Let’s consider this in comparison to past bank failures and the pace and size of deposit outflows. Prior to SVB, the largest bank failure in U.S. history was the failure of Washington Mutual, which experienced two periods of large deposit outflows, the first lasted 23 days with outflows of $9.1 billion, and the second $18.7 billion over 16 days. In other bank failures resulting from deposit runs, deposits flowed out of the bank in significantly smaller volumes and over much longer time horizons than SVB experienced on March 9 and 10.

Back-end money transfer systems have been gradually shifting to real-time payments, which are immediately available to customers upon transfer, rather than being subject to a waiting period while it is processed between financial institutions. Many bank websites provide capabilities that appear to allow customers to initiate funds transfers in real time. Sophisticated customers that hold uninsured deposits also have tools at their disposal—like the ability to initiate wire transfers between financial institutions—that allow faster transfers of funds. The capacity to initiate transfers, and even the changed perceptions of customers that they can move their funds at any time of day or night, have caused important structural shifts. Large depositors may have less incentive to act as a force for market discipline, even for banks where they hold large uninsured deposits in their operational accounts. These depositors have a cheaper and more efficient mechanism at their disposal to protect against credit risk—they can pull their money out in banking’s new normal. These changes have exacerbated the potential flight risks of uninsured deposits, while changing some of the incentives for depositors imposing market discipline.

The BoC has released highlights from the 2023 Financial System Survey:

  • Respondents believe the risk of a shock that could impair the Canadian financial system has decreased since the last survey. Their confidence in the resilience of the Canadian financial system is at its highest since the first FSS in 2018.
  • Cyber incidents remain the top risk that organizations face. Geopolitical risks are the second most important risk. In addition to posing risks to individual organizations, these risks are relevant for the broader Canadian financial system:
    • A successful cyber attack on a financial institution or a major financial market infrastructure could result in system-wide disruptions.
    • Geopolitical tensions could weigh on the pricing of risk assets globally, affecting a range of investors and issuers.
  • For many of their non-centrally cleared derivatives agreements, respondents indicated that they can pledge both cash and a range of securities to meet their initial and variation margin requirements.
  • Many respondents conduct stress tests to assess their ability to meet increases in margin requirements using a range of both historical and hypothetical scenarios.
  • Respondents would meet increases in margin requirements smaller than those anticipated in stress tests primarily by pledging assets and cash on hand. If increases in margin requirements were larger than those produced from stress tests, respondents would rely more on other funding sources to raise cash in addition to pledging assets and cash on hand. These funding sources include asset sales, securities financing markets and lines of credit. The 2021 Financial System Review discusses how such increases in margin requirements could contribute to scenarios where the demand for cash exceeds the supply provided by banks, adding to strains on market liquidity.
HIMIPref™ Preferred Indices
These values reflect the December 2008 revision of the HIMIPref™ Indices

Values are provisional and are finalized monthly
Index Mean
Current
Yield
(at bid)
Median
YTW
Median
Average
Trading
Value
Median
Mod Dur
(YTW)
Issues Day’s Perf. Index Value
Ratchet 0.00 % 0.00 % 0 0.00 0 6.1596 % 2,186.4
FixedFloater 0.00 % 0.00 % 0 0.00 0 6.1596 % 4,193.4
Floater 10.31 % 10.55 % 55,359 9.05 2 6.1596 % 2,416.7
OpRet 0.00 % 0.00 % 0 0.00 0 0.3867 % 3,353.1
SplitShare 5.01 % 7.39 % 42,757 2.55 7 0.3867 % 4,004.4
Interest-Bearing 0.00 % 0.00 % 0 0.00 0 0.3867 % 3,124.4
Perpetual-Premium 0.00 % 0.00 % 0 0.00 0 0.0358 % 2,737.9
Perpetual-Discount 6.23 % 6.30 % 43,911 13.46 34 0.0358 % 2,985.5
FixedReset Disc 5.94 % 7.80 % 86,416 11.85 63 -0.2542 % 2,094.0
Insurance Straight 6.08 % 6.22 % 60,748 13.55 19 -0.1391 % 2,957.8
FloatingReset 10.61 % 11.19 % 47,799 8.60 2 0.1034 % 2,357.9
FixedReset Prem 6.94 % 6.50 % 323,016 12.84 1 0.3172 % 2,327.4
FixedReset Bank Non 0.00 % 0.00 % 0 0.00 0 -0.2542 % 2,140.5
FixedReset Ins Non 6.06 % 7.31 % 75,965 12.11 11 -0.6593 % 2,302.8
Performance Highlights
Issue Index Change Notes
IFC.PR.C FixedReset Disc -5.66 % YTW SCENARIO
Maturity Type : Limit Maturity
Maturity Date : 2053-05-15
Maturity Price : 16.50
Evaluated at bid price : 16.50
Bid-YTW : 7.93 %
BN.PF.D Perpetual-Discount -3.64 % YTW SCENARIO
Maturity Type : Limit Maturity
Maturity Date : 2053-05-15
Maturity Price : 18.00
Evaluated at bid price : 18.00
Bid-YTW : 6.93 %
MFC.PR.I FixedReset Ins Non -2.30 % YTW SCENARIO
Maturity Type : Limit Maturity
Maturity Date : 2053-05-15
Maturity Price : 21.74
Evaluated at bid price : 22.10
Bid-YTW : 6.80 %
MFC.PR.L FixedReset Ins Non -2.01 % YTW SCENARIO
Maturity Type : Limit Maturity
Maturity Date : 2053-05-15
Maturity Price : 16.05
Evaluated at bid price : 16.05
Bid-YTW : 8.07 %
BN.PR.X FixedReset Disc -1.89 % YTW SCENARIO
Maturity Type : Limit Maturity
Maturity Date : 2053-05-15
Maturity Price : 13.98
Evaluated at bid price : 13.98
Bid-YTW : 8.69 %
BIP.PR.E FixedReset Disc -1.77 % YTW SCENARIO
Maturity Type : Limit Maturity
Maturity Date : 2053-05-15
Maturity Price : 21.12
Evaluated at bid price : 21.12
Bid-YTW : 7.53 %
CU.PR.C FixedReset Disc -1.60 % YTW SCENARIO
Maturity Type : Limit Maturity
Maturity Date : 2053-05-15
Maturity Price : 18.50
Evaluated at bid price : 18.50
Bid-YTW : 7.28 %
MFC.PR.N FixedReset Ins Non -1.60 % YTW SCENARIO
Maturity Type : Limit Maturity
Maturity Date : 2053-05-15
Maturity Price : 16.04
Evaluated at bid price : 16.04
Bid-YTW : 8.11 %
MFC.PR.M FixedReset Ins Non -1.50 % YTW SCENARIO
Maturity Type : Limit Maturity
Maturity Date : 2053-05-15
Maturity Price : 16.45
Evaluated at bid price : 16.45
Bid-YTW : 8.06 %
BN.PF.J FixedReset Disc -1.38 % YTW SCENARIO
Maturity Type : Limit Maturity
Maturity Date : 2053-05-15
Maturity Price : 21.45
Evaluated at bid price : 21.45
Bid-YTW : 7.31 %
BN.PF.A FixedReset Disc -1.11 % YTW SCENARIO
Maturity Type : Limit Maturity
Maturity Date : 2053-05-15
Maturity Price : 17.80
Evaluated at bid price : 17.80
Bid-YTW : 8.47 %
TRP.PR.C FixedReset Disc -1.02 % YTW SCENARIO
Maturity Type : Limit Maturity
Maturity Date : 2053-05-15
Maturity Price : 10.70
Evaluated at bid price : 10.70
Bid-YTW : 9.46 %
TRP.PR.A FixedReset Disc 1.05 % YTW SCENARIO
Maturity Type : Limit Maturity
Maturity Date : 2053-05-15
Maturity Price : 13.52
Evaluated at bid price : 13.52
Bid-YTW : 8.97 %
PWF.PR.H Perpetual-Discount 1.05 % YTW SCENARIO
Maturity Type : Limit Maturity
Maturity Date : 2053-05-15
Maturity Price : 22.71
Evaluated at bid price : 23.00
Bid-YTW : 6.30 %
BN.PR.B Floater 1.24 % YTW SCENARIO
Maturity Type : Limit Maturity
Maturity Date : 2053-05-15
Maturity Price : 11.40
Evaluated at bid price : 11.40
Bid-YTW : 10.55 %
PWF.PF.A Perpetual-Discount 1.70 % YTW SCENARIO
Maturity Type : Limit Maturity
Maturity Date : 2053-05-15
Maturity Price : 18.50
Evaluated at bid price : 18.50
Bid-YTW : 6.15 %
BN.PR.K Floater 11.60 % YTW SCENARIO
Maturity Type : Limit Maturity
Maturity Date : 2053-05-15
Maturity Price : 11.35
Evaluated at bid price : 11.35
Bid-YTW : 10.60 %
Volume Highlights
Issue Index Shares
Traded
Notes
MIC.PR.A Perpetual-Discount 108,000 YTW SCENARIO
Maturity Type : Limit Maturity
Maturity Date : 2053-05-15
Maturity Price : 21.00
Evaluated at bid price : 21.00
Bid-YTW : 6.54 %
RY.PR.O Perpetual-Discount 51,100 YTW SCENARIO
Maturity Type : Limit Maturity
Maturity Date : 2053-05-15
Maturity Price : 21.50
Evaluated at bid price : 21.50
Bid-YTW : 5.73 %
BN.PR.X FixedReset Disc 42,300 YTW SCENARIO
Maturity Type : Limit Maturity
Maturity Date : 2053-05-15
Maturity Price : 13.98
Evaluated at bid price : 13.98
Bid-YTW : 8.69 %
BN.PF.I FixedReset Disc 36,200 YTW SCENARIO
Maturity Type : Limit Maturity
Maturity Date : 2053-05-15
Maturity Price : 19.77
Evaluated at bid price : 19.77
Bid-YTW : 8.32 %
BN.PR.B Floater 18,300 YTW SCENARIO
Maturity Type : Limit Maturity
Maturity Date : 2053-05-15
Maturity Price : 11.40
Evaluated at bid price : 11.40
Bid-YTW : 10.55 %
BN.PR.T FixedReset Disc 17,200 YTW SCENARIO
Maturity Type : Limit Maturity
Maturity Date : 2053-05-15
Maturity Price : 13.48
Evaluated at bid price : 13.48
Bid-YTW : 9.25 %
There were 6 other index-included issues trading in excess of 10,000 shares.
Wide Spread Highlights
Issue Index Quote Data and Yield Notes
CM.PR.Q FixedReset Disc Quote: 17.17 – 18.95
Spot Rate : 1.7800
Average : 1.1704

YTW SCENARIO
Maturity Type : Limit Maturity
Maturity Date : 2053-05-15
Maturity Price : 17.17
Evaluated at bid price : 17.17
Bid-YTW : 7.88 %

BN.PF.D Perpetual-Discount Quote: 18.00 – 18.99
Spot Rate : 0.9900
Average : 0.6273

YTW SCENARIO
Maturity Type : Limit Maturity
Maturity Date : 2053-05-15
Maturity Price : 18.00
Evaluated at bid price : 18.00
Bid-YTW : 6.93 %

CM.PR.P FixedReset Disc Quote: 16.30 – 17.50
Spot Rate : 1.2000
Average : 0.8956

YTW SCENARIO
Maturity Type : Limit Maturity
Maturity Date : 2053-05-15
Maturity Price : 16.30
Evaluated at bid price : 16.30
Bid-YTW : 7.88 %

PWF.PR.P FixedReset Disc Quote: 12.04 – 12.78
Spot Rate : 0.7400
Average : 0.4404

YTW SCENARIO
Maturity Type : Limit Maturity
Maturity Date : 2053-05-15
Maturity Price : 12.04
Evaluated at bid price : 12.04
Bid-YTW : 8.50 %

BIK.PR.A FixedReset Disc Quote: 22.70 – 23.48
Spot Rate : 0.7800
Average : 0.5242

YTW SCENARIO
Maturity Type : Limit Maturity
Maturity Date : 2053-05-15
Maturity Price : 22.07
Evaluated at bid price : 22.70
Bid-YTW : 7.74 %

MFC.PR.I FixedReset Ins Non Quote: 22.10 – 22.79
Spot Rate : 0.6900
Average : 0.4607

YTW SCENARIO
Maturity Type : Limit Maturity
Maturity Date : 2053-05-15
Maturity Price : 21.74
Evaluated at bid price : 22.10
Bid-YTW : 6.80 %

May PrefLetter Released!

Sunday, May 14th, 2023

The May, 2023, edition of PrefLetter has been released and is now available for purchase as the “Previous edition”. Those who subscribe for a full year receive the “Previous edition” as a bonus.

The May edition contains a short appendix titled “Effect of Fixed-Reset Implied Volatility Parameterization on Performance”.

PrefLetter may now be purchased by all Canadian residents.

Until further notice, the “previous” edition will refer to the May, 2023, issue, while the “next” edition will be the June, 2023, issue scheduled to be prepared as of the close June 9, and emailed to subscribers prior to the market-opening on June 12. Prefletter is intended for long term investors seeking issues to buy-and-hold. At least one recommendation from each of the major preferred share sectors is included and discussed.

Note: My verbosity has grown by such leaps and bounds that it is no longer possible to deliver PrefLetter as an eMail attachment – it’s just too big for my software! Instead, I have sent passwords – click on the link in your eMail and your copy will download.

Note: There have been problems lately with corporate eMail protection systems that substitute “safe” links for the links sent in the eMails; the problem being that the “safe” links do not work and an error is generated by my software. To avoid possible problems and delays, please subscribe through an eMail account that is not “protected” by such software.

Note: The PrefLetter website has a Subscriber Download Feature. If you have not received your copy, try it!

Note: PrefLetter eMails sometimes runs afoul of spam filters. If you have not received your copy within fifteen minutes of a release notice such as this one, please double check your (company’s) spam filtering policy and your spam repository – there are some hints in the post Sympatico Spam Filters out of Control. If it’s not there, contact me and I’ll get you your copy … somehow!

Note: There have been scattered complaints regarding inability to open PrefLetter in Acrobat Reader, despite my practice of including myself on the subscription list and immediately checking the copy received. I have had the occasional difficulty reading US Government documents, which I was able to resolve by downloading and installing the latest version of Adobe Reader. Also, note that so far, all complaints have been from users of Yahoo Mail. Try saving it to disk first, before attempting to open it.

Note: There have been other scattered complaints that double-clicking on the links in the “PrefLetter Download” email results in a message that the password has already been used. I have been able to reproduce this problem in my own eMail software … the problem is double-clicking. What happens is the first click opens the link and the second click finds that the password has already been used and refuses to work properly. So the moral of the story is: Don’t be a dick! Single Click!

Note: Assiduous Reader DG informs me:

In case you have any other Apple users: you need to install a free App from the apple store called “FileApp”. It comes with it’s own tutorial and allows you to download and save a PDF file.

However, Assiduous Reader Adrian informs me in the comments to the January 2015 release:

Some nitpicking for DG:
FileApp costs $1.19 in the Apple Store.

But Adrian2 now advises:

Well, as of now, FileApp is free (again?).

PPS: PowerShares Canadian Preferred Share Index Class Terminated

Saturday, May 13th, 2023

Invesco has announced [on 2023-1-23] (although not on their website, as far as I can see):

Invesco Canada Ltd. (“Invesco”) announced today proposed changes to its Canadian exchange-traded funds (ETFs) and mutual fund line-up. The objective of this initiative is to simplify the firm’s product offerings to enable it to sharpen the focus on areas of highest client demand. Another benefit will be increased capacity to provide better service and support while investing in those high demand products. The products listed below will be set to be terminated in 2023:

The firm plans to terminate the following TSX-Listed ETFs, effective close of business on or about April 21, 2023:

Terminating fund Ticker Symbol
Invesco Canadian Preferred Share Index ETF PPS
Invesco FTSE RAFI Canadian Small-Mid Index ETF PZC
Invesco FTSE RAFI Global+ Index ETF PXG, PXG.U
Invesco Global Shareholder Yield ETF PSY, PSY.U
Invesco LadderRite U.S. 0-5 Year Corporate Bond Index ETF USB, USB.U
Invesco S&P/TSX REIT Income Index ETF REIT
Invesco S&P Emerging Markets Low Volatility Index ETF ELV
Invesco S&P International Developed Low Volatility Index ETF ILV, ILV.F
Invesco Senior Loan Index ETF BKL.C, BKL.U, BKL.F

The TSX-Listed ETFs will continue to be listed on the Toronto Stock Exchange (“TSX”) until the close of business on or about April 17, 2023, when they are expected to cease trading and be delisted. No further subscription orders for units of the TSX-Listed ETFs will be accepted after the close of business on April 5, 2023. Unitholders of the TSX-Listed ETFs may continue to submit requests to exchange units until close of business on or about April 14, 2023 and to redeem units until April 21, 2023.

There goes another! It just goes to show what a 10+ year long bear market can do to retail sentiment.

May 12, 2023

Friday, May 12th, 2023

TXPR closed at 535.65, down 0.64% on the day after setting a new 52-week low. Volume today was 825,140, below the median of the past 21 trading days.

CPD closed at 10.69, down 0.09% on the day after setting a new 52-week low. Volume was 140,400, second-highest of the past 21 trading days.

ZPR closed at 8.74, down 0.68% on the day. Volume was 165,350, fourth-highest of the past 21 trading days.

Five-year Canada yields up a bit to 3.03% today.

I’ve been following the Stateview fiasco, (first discussed April 26) with great interest (published April 28):

More lenders of Ontario builder StateView Homes are demanding it repay close to $200-million in loans, casting doubt on its ability to cover its debts, according to new court documents.

Filings from KingSett Mortgage Corp. – part of KingSett Capital’s $17-billion portfolio – challenge StateViews’s recent claims that it will finish a half-dozen townhouse projects that include hundreds of future homes, making insolvency and liquidation more likely.

The lenders are demanding repayment of $167.8-million and $4-million that was advanced to StateView for a variety of residential and commercial properties. They are also asking the court to appoint a third-party receiver to manage a sales process on StateView’s remaining assets.

StateView declined to comment on the latest filings, but issued a statement Wednesday promising the company was still solvent enough to complete its projects.

The latest legal action comes days after Atrium Mortgage Investment Company jointly filed with Dorr to recoup $24.4-million loaned to StateView for one project in Markham. With KingSett’s filing, lenders are seeking close to $200-million in payments, leaving the bulk of the Vaughan-based builder’s active projects subject of court proceedings.

… and on May 10:

A fourth lender has demanded repayment of millions in loans from troubled Toronto-area land developer StateView Homes.

On May 5, Meridian Credit Union Ltd. filed an application to appoint a receiver for StateView Homes (Elm&Co) Inc., which was planning to build 206 townhouses on raw land at 12942 York Durham Line in Stouffville, Ont., near a GO Transit station. Meridian is seeking repayment of $17.8-million it loaned StateView on Dec. 5, 2022. In its filing, it warns the court that three other lenders subsequently loaned the Elm site another $27-million, but that a $20.8-million charge registered by Bergo Investment Inc., MCO Management Inc. and Tony Karamitsos on Dec. 16, 2022 was unauthorized.

Property records show StateView’s financial situation was precarious long before the cheque-kiting scheme came to light. In the case of BEA Towns in Barrie, Ont., property records show StateView paid $25.6-million in April, 2022 for the land and registered a $37.5-million loan on the property from Dorr Capital at the same time. On Dec. 16, 2022, StateView registered a loan of $20.8-million from Bergo, MCO and Mr. Karamitsos – the same day it registered a $20-million loan on the Elm&Co land in Stouffville. Neither Bergo or MCO responded to requests for comment. Only initial excavation work appears to have been started at the BEA Towns site.

Ida Wolden Bache, Governor of Norges Bank gave an introductory statement:

The Bank’s forecasts in March indicate that inflation will move down towards 2 percent over the coming years. If developments turn out as projected, inflation will return to target with little rise in unemployment.

There is substantial uncertainty about the outlook. The future policy rate path will depend on economic developments.

Problems in some US and Swiss banks have led to large movements in global financial markets over the spring. The authorities in these two countries have intervened to reduce the risk of contagion to other institutions and markets.

The turmoil has had only a limited impact on funding costs for Norwegian banks and mortgage finance companies. Norwegian banks are profitable, solid, and have ample liquidity. They are well positioned to cope with higher losses and market stress. In 2022, Norges Bank decided to raise the countercyclical capital buffer rate for banks to 2.5 percent, effective from March 2023, which brings the rate back to its pre-pandemic level.

Norges Bank continuously and closely monitors financial market developments and has a contingency framework for taking measures required to safeguard financial stability if needed.

Let me conclude.

The current high rate of inflation follows a long period of low and stable inflation in our part of the world. Some of the driving forces that kept inflation low in the decades before the pandemic may be going into reverse.

Globalisation has been met with gradually growing opposition. Demographic trends are changing. Combined, this could make the job of keeping inflation low more demanding.

The global economy will increasingly be impacted by climate change and the need to reduce emissions. Understanding the economic effects of climate change and the energy transition is essential for making forecasts and the right trade-offs in the conduct of monetary policy. This is therefore defined as a focus area in Norges Bank’s Strategy 2025.

The main contribution monetary policy can make to the transition is to ensure low and stable inflation. A flexible and forward-looking inflation targeting regime, where we look through short-term inflation fluctuations, is a good basis for addressing the structural changes we are facing.

A small open economy like Norway will be exposed to shocks, as we have acutely experienced in recent years. Economic policy cannot shield the economy totally from shocks that may arise, but can dampen their impact. A framework that provides monetary policy predictability makes it easier to succeed.

HIMIPref™ Preferred Indices
These values reflect the December 2008 revision of the HIMIPref™ Indices

Values are provisional and are finalized monthly
Index Mean
Current
Yield
(at bid)
Median
YTW
Median
Average
Trading
Value
Median
Mod Dur
(YTW)
Issues Day’s Perf. Index Value
Ratchet 0.00 % 0.00 % 0 0.00 0 -0.2792 % 2,059.5
FixedFloater 0.00 % 0.00 % 0 0.00 0 -0.2792 % 3,950.1
Floater 10.94 % 10.67 % 52,050 8.96 2 -0.2792 % 2,276.5
OpRet 0.00 % 0.00 % 0 0.00 0 0.0000 % 3,340.2
SplitShare 5.03 % 7.52 % 42,573 2.56 7 0.0000 % 3,988.9
Interest-Bearing 0.00 % 0.00 % 0 0.00 0 0.0000 % 3,112.3
Perpetual-Premium 0.00 % 0.00 % 0 0.00 0 -0.2602 % 2,736.9
Perpetual-Discount 6.23 % 6.30 % 45,263 13.46 34 -0.2602 % 2,984.4
FixedReset Disc 5.90 % 7.79 % 83,420 11.88 63 -0.6277 % 2,099.4
Insurance Straight 6.07 % 6.20 % 61,531 13.57 19 0.0619 % 2,961.9
FloatingReset 10.62 % 11.19 % 47,654 8.60 2 -1.0907 % 2,355.4
FixedReset Prem 6.97 % 6.52 % 324,521 12.83 1 -0.1188 % 2,320.1
FixedReset Bank Non 0.00 % 0.00 % 0 0.00 0 -0.6277 % 2,146.0
FixedReset Ins Non 6.02 % 7.34 % 76,697 12.09 11 -0.8697 % 2,318.1
Performance Highlights
Issue Index Change Notes
BN.PF.F FixedReset Disc -3.73 % YTW SCENARIO
Maturity Type : Limit Maturity
Maturity Date : 2053-05-12
Maturity Price : 15.74
Evaluated at bid price : 15.74
Bid-YTW : 9.20 %
TRP.PR.E FixedReset Disc -3.34 % YTW SCENARIO
Maturity Type : Limit Maturity
Maturity Date : 2053-05-12
Maturity Price : 14.46
Evaluated at bid price : 14.46
Bid-YTW : 9.10 %
MFC.PR.F FixedReset Ins Non -2.72 % YTW SCENARIO
Maturity Type : Limit Maturity
Maturity Date : 2053-05-12
Maturity Price : 12.16
Evaluated at bid price : 12.16
Bid-YTW : 8.28 %
CU.PR.F Perpetual-Discount -2.43 % YTW SCENARIO
Maturity Type : Limit Maturity
Maturity Date : 2053-05-12
Maturity Price : 18.05
Evaluated at bid price : 18.05
Bid-YTW : 6.26 %
IFC.PR.G FixedReset Ins Non -2.37 % YTW SCENARIO
Maturity Type : Limit Maturity
Maturity Date : 2053-05-12
Maturity Price : 19.33
Evaluated at bid price : 19.33
Bid-YTW : 7.34 %
CU.PR.C FixedReset Disc -2.34 % YTW SCENARIO
Maturity Type : Limit Maturity
Maturity Date : 2053-05-12
Maturity Price : 18.80
Evaluated at bid price : 18.80
Bid-YTW : 7.16 %
RY.PR.M FixedReset Disc -2.13 % YTW SCENARIO
Maturity Type : Limit Maturity
Maturity Date : 2053-05-12
Maturity Price : 16.56
Evaluated at bid price : 16.56
Bid-YTW : 7.86 %
TRP.PR.A FixedReset Disc -1.83 % YTW SCENARIO
Maturity Type : Limit Maturity
Maturity Date : 2053-05-12
Maturity Price : 13.38
Evaluated at bid price : 13.38
Bid-YTW : 9.06 %
CU.PR.I FixedReset Disc -1.69 % YTW SCENARIO
Maturity Type : Limit Maturity
Maturity Date : 2053-05-12
Maturity Price : 22.62
Evaluated at bid price : 23.20
Bid-YTW : 6.84 %
TD.PF.E FixedReset Disc -1.68 % YTW SCENARIO
Maturity Type : Limit Maturity
Maturity Date : 2053-05-12
Maturity Price : 17.60
Evaluated at bid price : 17.60
Bid-YTW : 7.74 %
BN.PR.R FixedReset Disc -1.65 % YTW SCENARIO
Maturity Type : Limit Maturity
Maturity Date : 2053-05-12
Maturity Price : 13.15
Evaluated at bid price : 13.15
Bid-YTW : 9.31 %
BN.PR.B Floater -1.57 % YTW SCENARIO
Maturity Type : Limit Maturity
Maturity Date : 2053-05-12
Maturity Price : 11.26
Evaluated at bid price : 11.26
Bid-YTW : 10.67 %
TRP.PR.B FixedReset Disc -1.46 % YTW SCENARIO
Maturity Type : Limit Maturity
Maturity Date : 2053-05-12
Maturity Price : 10.10
Evaluated at bid price : 10.10
Bid-YTW : 9.68 %
TRP.PR.D FixedReset Disc -1.44 % YTW SCENARIO
Maturity Type : Limit Maturity
Maturity Date : 2053-05-12
Maturity Price : 15.10
Evaluated at bid price : 15.10
Bid-YTW : 8.90 %
FTS.PR.H FixedReset Disc -1.36 % YTW SCENARIO
Maturity Type : Limit Maturity
Maturity Date : 2053-05-12
Maturity Price : 12.35
Evaluated at bid price : 12.35
Bid-YTW : 8.39 %
BN.PF.D Perpetual-Discount -1.32 % YTW SCENARIO
Maturity Type : Limit Maturity
Maturity Date : 2053-05-12
Maturity Price : 18.68
Evaluated at bid price : 18.68
Bid-YTW : 6.67 %
BN.PR.Z FixedReset Disc -1.28 % YTW SCENARIO
Maturity Type : Limit Maturity
Maturity Date : 2053-05-12
Maturity Price : 19.25
Evaluated at bid price : 19.25
Bid-YTW : 7.97 %
RY.PR.H FixedReset Disc -1.25 % YTW SCENARIO
Maturity Type : Limit Maturity
Maturity Date : 2053-05-12
Maturity Price : 16.61
Evaluated at bid price : 16.61
Bid-YTW : 7.79 %
BN.PF.B FixedReset Disc -1.23 % YTW SCENARIO
Maturity Type : Limit Maturity
Maturity Date : 2053-05-12
Maturity Price : 16.00
Evaluated at bid price : 16.00
Bid-YTW : 8.89 %
FTS.PR.G FixedReset Disc -1.20 % YTW SCENARIO
Maturity Type : Limit Maturity
Maturity Date : 2053-05-12
Maturity Price : 17.35
Evaluated at bid price : 17.35
Bid-YTW : 7.59 %
FTS.PR.M FixedReset Disc -1.20 % YTW SCENARIO
Maturity Type : Limit Maturity
Maturity Date : 2053-05-12
Maturity Price : 16.53
Evaluated at bid price : 16.53
Bid-YTW : 8.24 %
IFC.PR.A FixedReset Ins Non -1.16 % YTW SCENARIO
Maturity Type : Limit Maturity
Maturity Date : 2053-05-12
Maturity Price : 17.10
Evaluated at bid price : 17.10
Bid-YTW : 7.10 %
TRP.PR.F FloatingReset -1.14 % YTW SCENARIO
Maturity Type : Limit Maturity
Maturity Date : 2053-05-12
Maturity Price : 14.72
Evaluated at bid price : 14.72
Bid-YTW : 11.19 %
BIK.PR.A FixedReset Disc -1.10 % YTW SCENARIO
Maturity Type : Limit Maturity
Maturity Date : 2053-05-12
Maturity Price : 21.94
Evaluated at bid price : 22.50
Bid-YTW : 7.80 %
BN.PR.T FixedReset Disc -1.09 % YTW SCENARIO
Maturity Type : Limit Maturity
Maturity Date : 2053-05-12
Maturity Price : 13.60
Evaluated at bid price : 13.60
Bid-YTW : 9.16 %
GWO.PR.N FixedReset Ins Non -1.06 % YTW SCENARIO
Maturity Type : Limit Maturity
Maturity Date : 2053-05-12
Maturity Price : 12.12
Evaluated at bid price : 12.12
Bid-YTW : 8.02 %
PWF.PR.H Perpetual-Discount -1.04 % YTW SCENARIO
Maturity Type : Limit Maturity
Maturity Date : 2053-05-12
Maturity Price : 22.50
Evaluated at bid price : 22.76
Bid-YTW : 6.37 %
SLF.PR.J FloatingReset -1.04 % YTW SCENARIO
Maturity Type : Limit Maturity
Maturity Date : 2053-05-12
Maturity Price : 14.30
Evaluated at bid price : 14.30
Bid-YTW : 10.59 %
BMO.PR.W FixedReset Disc -1.03 % YTW SCENARIO
Maturity Type : Limit Maturity
Maturity Date : 2053-05-12
Maturity Price : 16.33
Evaluated at bid price : 16.33
Bid-YTW : 7.85 %
NA.PR.W FixedReset Disc -1.02 % YTW SCENARIO
Maturity Type : Limit Maturity
Maturity Date : 2053-05-12
Maturity Price : 16.50
Evaluated at bid price : 16.50
Bid-YTW : 7.79 %
RY.PR.J FixedReset Disc -1.01 % YTW SCENARIO
Maturity Type : Limit Maturity
Maturity Date : 2053-05-12
Maturity Price : 17.65
Evaluated at bid price : 17.65
Bid-YTW : 7.70 %
BN.PR.K Floater 1.19 % YTW SCENARIO
Maturity Type : Limit Maturity
Maturity Date : 2053-05-12
Maturity Price : 10.17
Evaluated at bid price : 10.17
Bid-YTW : 11.85 %
BNS.PR.I FixedReset Disc 1.52 % YTW SCENARIO
Maturity Type : Limit Maturity
Maturity Date : 2053-05-12
Maturity Price : 20.66
Evaluated at bid price : 20.66
Bid-YTW : 6.64 %
BIP.PR.E FixedReset Disc 2.38 % YTW SCENARIO
Maturity Type : Limit Maturity
Maturity Date : 2053-05-12
Maturity Price : 21.50
Evaluated at bid price : 21.50
Bid-YTW : 7.38 %
NA.PR.G FixedReset Disc 2.66 % YTW SCENARIO
Maturity Type : Limit Maturity
Maturity Date : 2053-05-12
Maturity Price : 21.25
Evaluated at bid price : 21.25
Bid-YTW : 6.84 %
Volume Highlights
Issue Index Shares
Traded
Notes
NA.PR.G FixedReset Disc 24,434 YTW SCENARIO
Maturity Type : Limit Maturity
Maturity Date : 2053-05-12
Maturity Price : 21.25
Evaluated at bid price : 21.25
Bid-YTW : 6.84 %
CM.PR.S FixedReset Disc 20,099 YTW SCENARIO
Maturity Type : Limit Maturity
Maturity Date : 2053-05-12
Maturity Price : 21.20
Evaluated at bid price : 21.20
Bid-YTW : 6.67 %
BN.PF.B FixedReset Disc 14,945 YTW SCENARIO
Maturity Type : Limit Maturity
Maturity Date : 2053-05-12
Maturity Price : 16.00
Evaluated at bid price : 16.00
Bid-YTW : 8.89 %
MFC.PR.J FixedReset Ins Non 12,800 YTW SCENARIO
Maturity Type : Limit Maturity
Maturity Date : 2053-05-12
Maturity Price : 21.80
Evaluated at bid price : 22.22
Bid-YTW : 6.63 %
BMO.PR.S FixedReset Disc 12,465 YTW SCENARIO
Maturity Type : Limit Maturity
Maturity Date : 2053-05-12
Maturity Price : 17.22
Evaluated at bid price : 17.22
Bid-YTW : 7.68 %
TRP.PR.F FloatingReset 11,810 YTW SCENARIO
Maturity Type : Limit Maturity
Maturity Date : 2053-05-12
Maturity Price : 14.72
Evaluated at bid price : 14.72
Bid-YTW : 11.19 %
There were 3 other index-included issues trading in excess of 10,000 shares.
Wide Spread Highlights
Issue Index Quote Data and Yield Notes
MIC.PR.A Perpetual-Discount Quote: 21.00 – 21.98
Spot Rate : 0.9800
Average : 0.6361

YTW SCENARIO
Maturity Type : Limit Maturity
Maturity Date : 2053-05-12
Maturity Price : 21.00
Evaluated at bid price : 21.00
Bid-YTW : 6.54 %

CU.PR.E Perpetual-Discount Quote: 19.69 – 23.72
Spot Rate : 4.0300
Average : 3.7004

YTW SCENARIO
Maturity Type : Limit Maturity
Maturity Date : 2053-05-12
Maturity Price : 19.69
Evaluated at bid price : 19.69
Bid-YTW : 6.24 %

IFC.PR.C FixedReset Disc Quote: 17.49 – 18.49
Spot Rate : 1.0000
Average : 0.6731

YTW SCENARIO
Maturity Type : Limit Maturity
Maturity Date : 2053-05-12
Maturity Price : 17.49
Evaluated at bid price : 17.49
Bid-YTW : 7.49 %

RY.PR.M FixedReset Disc Quote: 16.56 – 17.50
Spot Rate : 0.9400
Average : 0.6815

YTW SCENARIO
Maturity Type : Limit Maturity
Maturity Date : 2053-05-12
Maturity Price : 16.56
Evaluated at bid price : 16.56
Bid-YTW : 7.86 %

BN.PF.F FixedReset Disc Quote: 15.74 – 16.65
Spot Rate : 0.9100
Average : 0.6559

YTW SCENARIO
Maturity Type : Limit Maturity
Maturity Date : 2053-05-12
Maturity Price : 15.74
Evaluated at bid price : 15.74
Bid-YTW : 9.20 %

CU.PR.C FixedReset Disc Quote: 18.80 – 19.70
Spot Rate : 0.9000
Average : 0.6511

YTW SCENARIO
Maturity Type : Limit Maturity
Maturity Date : 2053-05-12
Maturity Price : 18.80
Evaluated at bid price : 18.80
Bid-YTW : 7.16 %