In the first update to the post A Structural Model of Contingent Bank Capital, when responding to Prof. Pennacchi’s commentary (then anonymous, then later quoted in full with permission), I said:
As an unconstrained bond manager, I would be sorely tempted to buy a put on the equity, with the strike price equal to the conversion price and view the CC + put as a package. My view on the attractiveness of the package would be heavily influenced by the net yield of the continuing position. However, the chances of me, as a bond specialist, of having a mandate that allows the purchase of equity puts are infinitesimal and there will be asset allocation problems at the most integrated of management firms. I think that this area becomes hedge fund territory.
So I decided to do a little playing with numbers to see how this might work.
In order to keep the assumptions close to those of McDonald’s original paper, I simulated a ten year bond with a coupon of 4.09%, while the risk-free ten year is at 4.00%. Additionally, I implemented the McDonald CoCo with the index trigger set arbitrarily high, so that the instrument reflects my original recommendation. As has been previously noted, I consider 9bp at issue time to be an unrealistically narrow spread (it considers only that portion of credit risk that is due to jumps in the bank’s asset value), but let’s see what happens anyway!
I then prepared a spreadsheet with various bond prices; commencing at 100.00 and decrementing with 0.50 intervals down to 79.00 (why 79.00? See below!). I then worked out the effective conversion price for each bond price; for instance, when the bond price is 90.00, the effective conversion price is 45.00, since I will be getting two shares in exchange should the stock price ever hit 50.00.
For each bond price, I then calculated the excess yield over the risk-free rate (which is presumed to be a flat yield curve at 4%) and converted this to a dollar figure. For instance, at a bond price of 100.00 the excess yield is 9bp, which is $0.09 annually. At a bond price of 90.00, the yield is 5.40%, 140bp over the risk-free rate, and 1.40% of 90 is just over $1.25 annually.
In order to hedge the conversion, I need to buy two puts, so when the bond price is 100.00 I can spend $0.045 per put and when the bond price is 90.00 I can spend $0.6288 per put.
The market price of the puts was calculated for a one-year term on the put, with a strike price equal to the effective conversion price and volatility of 30%. The current price of the stock was chosen so that the price of the put is equal to the amount I can spend.
It should be noted that this is not a true hedge: there is the opportunity for profit. For instance, say the price of the bond is 90.00 and I buy two one-year puts on the stock at 45.00. As long as the contemporary stock price is 65.06 or more, then my projected yield for the package for the first year of the ten year term of the bond will be 4% – the risk free rate that I am trying to hedge (similar in principle to owning a bond and buying a CDS on it).
There is a chance of underperforming the risk-free rate over the term of the bond if the stock price declines further and subsequent years’ puts become more expensive. However, there is always the chance of profit, based on the CoCo specification that the issuers’ put option is exercised immediately as soon as the stock price reaches the conversion trigger. Thus, this embedded put can never be in-the-money for the issuer; this in turn means that, for instance, if I am able to achieve the paper’s assumption that I will be able to sell the common at 50.00 then I will have outperformed significantly: I will have converted at the effective conversion price of less than 50.00 (given that I bought the bond below par), sold it at 50; and still have a long put option on the stock that, even if it is out of the money, may well have significant time value on it.
It is this question of mismatches on the time value of the option that lead me to use 1-year options; if the exercise is repeated with 10-year options (which would be OTC instruments) then the time-value mismatch makes the hedge a more expensive proposition.
Thus, when the bond price is 90.00, it yields 5.40%, providing me with 140bp over risk-free, or $1.2574 annually, used to buy two puts at $0.6288 with a strike price of 45.00 at a time when the price of the stock is 65.06.
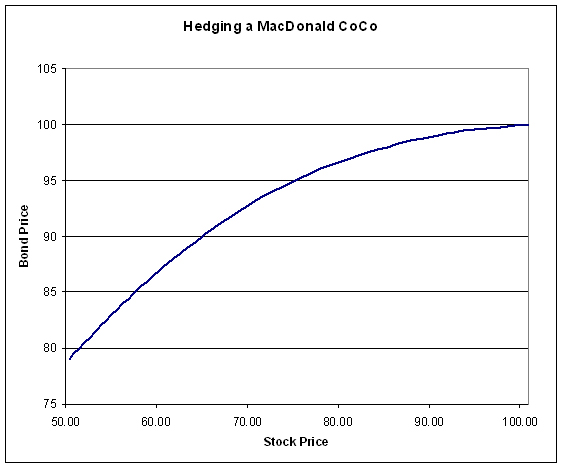
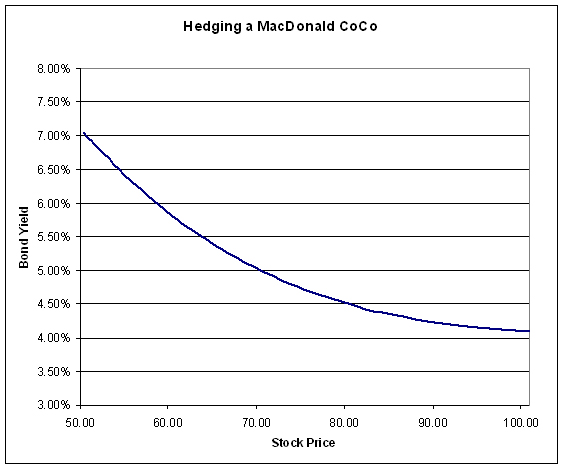
Repeating these calculations provides the following charts:
These graphs look entirely reasonable in the light of our experience of the past few years: it seems entirely reasonable to me that spreads will widen from 9bp to 305bp when the stock price halves.
The minimum bond price calculated is 79.00; prices lower than this, hedging the conversion price at 39.50, require the stock to be priced at less than 50.00; at which point the bond will no longer exist. Mind you, with the bond at 79.00, you’re winning if the stock does touch 50.00 and you can dump it for more than 39.50; with this kind of gap, do you really need to hedge?
However, there is an implication for Prof. Pennacchi’s assertion that:
it is best to set a trigger than can result in conversion when the bank’s original shareholders’ equity is only mildly depleted rather than have a trigger where conversion occurs at a very low value of original shareholders’ equity.
The above charts show that hedging cost will rise dramatically as the stock price approaches the trigger/conversion price.
Please note that I have no quibbles with Prof. Pennacchi’s math or reasoning; my objection relates to the embedded assumption that investors will have the ability in practice of a stop-loss order to be executed at a predictable price (or, at least, one that is based on the fundamentals of a bank’s assets). The May 6 bungee-jump (or “flash-crash”, as the cool kids are calling it now) showed that. I will also remind Assiduous Readers of the 1987 crash, exacerbated by equally mathematically pure portfolio insurance.
The spreadsheet used to make the charts is available for the edification and amusement of those who want to play with the numbers a bit.

