Fasken Martineau has some intelligent things to say about regulation, requesting a cost-benefit analysis in advance of imposing new rules, but some idiot has copy-protected it and damned if I’ll retype the interesting part.
Arvid O. I. Hoffmann and Hersh Shefrin have written a wonderful paper on retail’s use of technical analysis, titled Technical Analysis and Individual Investors:
We find that individual investors who use technical analysis and trade options frequently make poor portfolio decisions, resulting in dramatically lower returns than other investors. The data on which this claim is based consists of transaction records and matched survey responses of a sample of Dutch discount brokerage clients for the period 2000-2006. Overall, our results indicate that individual investors who report using technical analysis are disproportionately prone to have speculation on short-term stock-market developments as their primary investment objective, hold more concentrated portfolios which they turn over at a higher rate, are less inclined to bet on reversals, choose risk exposures featuring a higher ratio of nonsystematic risk to total risk, engage in more options trading, and earn lower returns.
…
We find that investors who report using technical analysis hold more concentrated portfolios than other investors, and have higher ratios of nonsystematic risk to total risk. They also trade more frequently than other investors, especially in respect to options. As a result of these behavior patterns, investors using technical analysis earn lower raw and risk-adjusted returns than other investors. The magnitudes are economically important: controlling for concentration and turnover, the marginal cost associated with technical analysis is approximately 50 basis points of raw return per month. Turnover associated with technical analysis adds a further 20 basis points per month of cost. Concentration adds an additional 2 basis points.
…
Most investors who use technical analysis do so in combination with some other strategy. Specifically, 23% of the investors in our sample use technical analysis in conjunction with some other strategy, whereas only 9% of the investors in our sample use technical analysis by itself.
…
Regarding the control variables, we find that portfolio concentration (Goetzmann and Kumar 2008) and turnover (Barber and Odean 2000) hurt performance, while investors with larger portfolios do better (Dhar and Zhu 2006). Of course, the latter result could be affected by the fact that better returns lead to larger portfolios. In addition, we find that investors with more trading experience (account tenure) achieve worse returns than investors with less experience, suggesting that experience may lead to overconfidence (Gervais and Odean 2001; Barber and Odean 2001a). Finally, consistent with Chalmers and Reuters (2012), Hoechle et al. (2013), and Karabulut (2013) we find that professional advice hurts investor performance.
…
Our results add to the literature documenting that individual investors are prone to invest in lottery-like securities that feature high risk and negative risk-adjusted returns (see Kumar 2009; Han and Kumar 2013). We find that technical analysis is the high octane gasoline that speculative high derivative rollers use to fuel their lottery-like trading. In this regard, the incremental impact of technical analysis on the risk-adjusted returns to high derivative rollers is 468 basis points per month less for speculators than for non-speculators.
Note that the “professional advice” referred to above is based on a survey of the account holders; the survey question was
3 – Professional advice: I base my investment decisions on the professional advice from an investment advisor
… which could be anything from a subscription to PrefLetter to membership in an Internet Technical Analysis Promotion Scheme. So it’s not really all that informative.
Naturally, there is some squealing from the Chosen:
All the criticism has Bloomberg First Word technical analyst William Maloney, a University of Delaware Fightin’ Blue Hens alumni, flapping his hen wings for a chance to defend technicians.
He’ll gladly show you numerous examples of how technical analysis can work effectively: the S&P 500 has consistently rebounded after slipping below its 100-day moving average over the past year.
Wow. A whole year of qualitative back-testing. Typical.
Philip Cross, a Senior Fellow with the Macdonald-Laurier Institute, brings to my attention an interesting OECD statistic:
Outside of industries directly regulated, all industries bear a cost of complying with regulations. The OECD estimates this costs the Canadian economy about 12 per cent of its GDP. While this is slightly below its high in the 1980s, it is significantly more than the 8 per cent of GDP that regulations cost the United States. One estimate conducted for the federal government is that the larger regulatory burden in Canada lowers all our incomes by an average of 2.2 per cent. This does not include the unknown cost to taxpayers of supporting the regulatory bureaucracy.
Tapering, Schmapering. The real story is the lousy economy:
The story told by bonds – especially government bonds in the developed world – is rather downcast. The yield on the Bloomberg Global Developed Sovereign Bond Index hit its lowest point in a year on Wednesday. That suggests investors are coming around to the notion that interest rates will remain lower for longer than they thought a few months back, and so are increasingly willing to load up on bonds, even at their current miserly yields.
Enbridge has issued some USD bonds:
DBRS has today assigned a rating of A (low) with a Stable trend to Enbridge Inc.’s issuance of USD 500 million 3.50% senior unsecured medium-term notes (Notes) maturing on June 10, 2024; USD 500 million 4.50% Notes maturing on June 10, 2044; and USD 500 million Notes with a Floating Rate Coupon of three-month USD LIBOR plus 0.45% due June 2, 2017 (collectively, the Notes). The Notes are expected to settle on June 4, 2014.
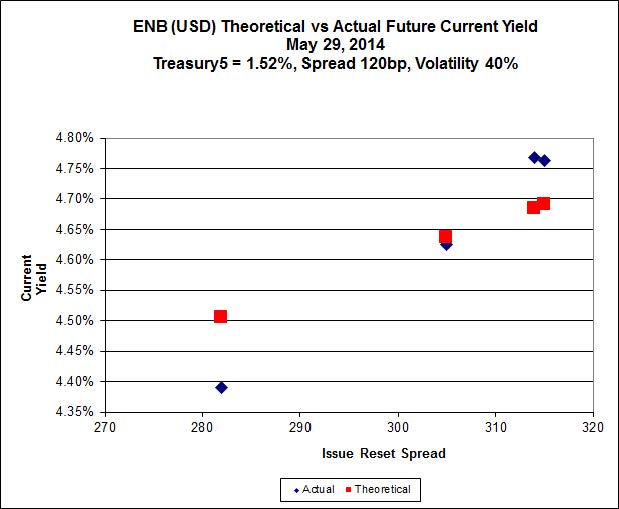
OK, so 4.50% for thirty-year USD money … compare it with what’s available on ENB USD FixedResets …
Click for Big
The highest spread issue is ENB.PF.U, a FixedReset, US Pay, 4.00%+315 resetting 2017-9-1, which closed today at 24.51-60 to yield 4.62%, assuming an end-price of 24.51 in 25 years … the lowest spread issue is ENB.PF.V, a US-Pay FixedReset, 4.40%+282 which closed today at 24.71-72 (HIGHER than ENB.PF.U!) to yield 4.29%, assuming an end-price of 24.71 in 25 years.
Add in the embedded inflation protection and preferential taxation, I’d say the preferreds look pretty good!
It was another poor day for the Canadian preferred share market, with PerpetualDiscounts off 3bp, FixedResets losing 33bp and DeemedRetrractibles down 16bp. Volatility was high and dominated by losing FixedResets. Volume was a little above average.
| HIMIPref™ Preferred Indices These values reflect the December 2008 revision of the HIMIPref™ Indices Values are provisional and are finalized monthly |
|||||||
| Index | Mean Current Yield (at bid) |
Median YTW |
Median Average Trading Value |
Median Mod Dur (YTW) |
Issues | Day’s Perf. | Index Value |
| Ratchet | 0.00 % | 0.00 % | 0 | 0.00 | 0 | 0.5012 % | 2,506.7 |
| FixedFloater | 4.47 % | 3.72 % | 31,659 | 17.94 | 1 | 0.1415 % | 3,837.1 |
| Floater | 2.91 % | 3.03 % | 49,051 | 19.60 | 4 | 0.5012 % | 2,706.6 |
| OpRet | 4.38 % | -12.06 % | 32,420 | 0.09 | 2 | 0.0195 % | 2,709.5 |
| SplitShare | 4.80 % | 3.86 % | 62,190 | 4.17 | 5 | 0.0397 % | 3,122.1 |
| Interest-Bearing | 0.00 % | 0.00 % | 0 | 0.00 | 0 | 0.0195 % | 2,477.5 |
| Perpetual-Premium | 5.50 % | -10.56 % | 89,456 | 0.09 | 15 | -0.1067 % | 2,405.8 |
| Perpetual-Discount | 5.29 % | 5.31 % | 103,711 | 14.90 | 21 | -0.0323 % | 2,551.7 |
| FixedReset | 4.56 % | 3.62 % | 202,626 | 8.75 | 75 | -0.3283 % | 2,530.8 |
| Deemed-Retractible | 5.02 % | 2.14 % | 158,686 | 0.16 | 43 | -0.1641 % | 2,519.4 |
| FloatingReset | 2.66 % | 2.45 % | 149,809 | 4.01 | 6 | -0.1124 % | 2,484.9 |
| Performance Highlights | |||
| Issue | Index | Change | Notes |
| IFC.PR.A | FixedReset | -2.20 % | YTW SCENARIO Maturity Type : Hard Maturity Maturity Date : 2025-01-31 Maturity Price : 25.00 Evaluated at bid price : 23.55 Bid-YTW : 4.41 % |
| GWO.PR.N | FixedReset | -1.58 % | YTW SCENARIO Maturity Type : Hard Maturity Maturity Date : 2025-01-31 Maturity Price : 25.00 Evaluated at bid price : 22.31 Bid-YTW : 4.26 % |
| BAM.PF.E | FixedReset | -1.52 % | YTW SCENARIO Maturity Type : Limit Maturity Maturity Date : 2044-05-29 Maturity Price : 22.96 Evaluated at bid price : 24.57 Bid-YTW : 4.25 % |
| SLF.PR.H | FixedReset | -1.36 % | YTW SCENARIO Maturity Type : Hard Maturity Maturity Date : 2025-01-31 Maturity Price : 25.00 Evaluated at bid price : 24.75 Bid-YTW : 3.87 % |
| BAM.PR.Z | FixedReset | -1.24 % | YTW SCENARIO Maturity Type : Limit Maturity Maturity Date : 2044-05-29 Maturity Price : 23.44 Evaluated at bid price : 25.45 Bid-YTW : 4.44 % |
| CIU.PR.C | FixedReset | -1.24 % | YTW SCENARIO Maturity Type : Limit Maturity Maturity Date : 2044-05-29 Maturity Price : 21.30 Evaluated at bid price : 21.59 Bid-YTW : 3.48 % |
| BAM.PF.A | FixedReset | -1.18 % | YTW SCENARIO Maturity Type : Limit Maturity Maturity Date : 2044-05-29 Maturity Price : 23.28 Evaluated at bid price : 25.20 Bid-YTW : 4.38 % |
| GWO.PR.I | Deemed-Retractible | -1.05 % | YTW SCENARIO Maturity Type : Hard Maturity Maturity Date : 2025-01-31 Maturity Price : 25.00 Evaluated at bid price : 22.15 Bid-YTW : 5.94 % |
| BAM.PR.C | Floater | 1.10 % | YTW SCENARIO Maturity Type : Limit Maturity Maturity Date : 2044-05-29 Maturity Price : 17.49 Evaluated at bid price : 17.49 Bid-YTW : 3.03 % |
| Volume Highlights | |||
| Issue | Index | Shares Traded |
Notes |
| TRP.PR.C | FixedReset | 187,127 | YTW SCENARIO Maturity Type : Limit Maturity Maturity Date : 2044-05-29 Maturity Price : 22.63 Evaluated at bid price : 23.01 Bid-YTW : 3.49 % |
| ENB.PF.C | FixedReset | 152,102 | Recent new issue. YTW SCENARIO Maturity Type : Limit Maturity Maturity Date : 2044-05-29 Maturity Price : 23.09 Evaluated at bid price : 24.92 Bid-YTW : 4.18 % |
| RY.PR.I | FixedReset | 88,245 | YTW SCENARIO Maturity Type : Call Maturity Date : 2019-02-24 Maturity Price : 25.00 Evaluated at bid price : 25.18 Bid-YTW : 3.38 % |
| BNS.PR.Z | FixedReset | 86,734 | YTW SCENARIO Maturity Type : Hard Maturity Maturity Date : 2022-01-31 Maturity Price : 25.00 Evaluated at bid price : 24.09 Bid-YTW : 3.71 % |
| MFC.PR.L | FixedReset | 55,735 | YTW SCENARIO Maturity Type : Hard Maturity Maturity Date : 2025-01-31 Maturity Price : 25.00 Evaluated at bid price : 24.75 Bid-YTW : 3.92 % |
| RY.PR.C | Deemed-Retractible | 40,350 | YTW SCENARIO Maturity Type : Call Maturity Date : 2014-11-24 Maturity Price : 25.25 Evaluated at bid price : 25.54 Bid-YTW : 2.31 % |
| There were 37 other index-included issues trading in excess of 10,000 shares. | |||
| Wide Spread Highlights | ||
| Issue | Index | Quote Data and Yield Notes |
| BAM.PR.X | FixedReset | Quote: 22.23 – 22.86 Spot Rate : 0.6300 Average : 0.4016 YTW SCENARIO |
| IFC.PR.A | FixedReset | Quote: 23.55 – 23.91 Spot Rate : 0.3600 Average : 0.2299 YTW SCENARIO |
| SLF.PR.G | FixedReset | Quote: 22.45 – 22.80 Spot Rate : 0.3500 Average : 0.2282 YTW SCENARIO |
| MFC.PR.B | Deemed-Retractible | Quote: 22.46 – 22.90 Spot Rate : 0.4400 Average : 0.3191 YTW SCENARIO |
| RY.PR.A | Deemed-Retractible | Quote: 25.33 – 25.71 Spot Rate : 0.3800 Average : 0.2712 YTW SCENARIO |
| BAM.PR.G | FixedFloater | Quote: 21.23 – 21.60 Spot Rate : 0.3700 Average : 0.2639 YTW SCENARIO |