Fed officials are busily warning against complacency:
Federal Reserve officials argued that an interest-rate increase is still warranted this year, laying out the case for liftoff in remarks over the weekend that counter bets by traders that the central bank will stay on hold until 2016.
Three policy makers separately explained their rationale for enacting a rate increase at one of the Fed’s two remaining meetings of 2015, citing declines in unemployment and other gains in the U.S. economy that should outweigh headwinds from slower growth abroad and turbulent financial markets.
San Francisco Fed President John Williams, a policy centrist who has worked closely with Chair Janet Yellen, said Sunday that “in my mind, it was a close call” to delay a rate rise at last week’s Federal Open Market Committee meeting.
Williams’ comments on Fox News Channel’s “Sunday Morning Futures with Maria Bartiromo” echoed remarks he made the day before, and chimed with the reasoning of St. Louis Fed President James Bullard and Richmond Fed President Jeffrey Lacker. Both weighed in on Saturday over the FOMC’s vote to leave rates near zero.
Non-voting FOMC members are also weighing in:
Federal Reserve Bank of St. Louis President James Bullard said he pushed against the central bank’s decision this week to delay an interest rate increase, because the economy has more or less fulfilled policy makers’ goals.
“The case for policy normalization is quite strong, since Committee objectives have essentially been met,” Bullard said in slides prepared for a speech in Nashville, Tennessee. “I argued against the decision at the FOMC meeting.”
Bullard is not a voting member of the policy-setting Federal Open Market Committee in 2015, but will vote in 2016.
I’ve said it before, I’ll say it again – I’m sure that most, if not all, of these public statements are deliberately orchestrated by the FOMC as a whole. ‘You made some good points in the meeting, guys. You should speak up in public.’ In that way, the market learns a bit more about the decision than is available in the simple ternary result (up, unchanged, down) and about what elements of the data are considered important and on the cusp of change. It’s a lot better system than the Canadian one, in which (since Dodge retired) Moses descends from the mountain with the Finance Minister’s decision.
I’ve heard a rumour that Volkswagen has a new motto – “Don’t help me!”:
Discrepancies in the European tests on the diesel models of the VW Passat, the VW Jetta and the BMW X5 last year gave Peter Mock an idea.
Mock, European managing director of a little-known clean-air group, suggested replicating the tests in the U.S. The U.S. has higher emissions standards than the rest of the world and a history of enforcing them, so Mock and his American counterpart, John German, were sure the U.S. versions of the vehicles would pass the emissions tests, German said. That way, they reasoned, they could show Europeans it was possible for diesel cars to run clean.
“We had no cause for suspicion,” German, U.S. co-lead of the International Council on Clean Transportation, said in an interview. “We thought the vehicles would be clean.”
So began a series of events that resulted in Volkswagen AG admitting that it built “defeat device” software into a half-million of its diesel cars from 2009 to 2015 that automatically cheated on U.S. air-pollution tests. The world’s second-biggest carmaker now faces billions in fines, possible jail time for its executives and the undoing of its U.S. expansion plans.
Hat tip to Assiduous Reader JP, who brought this to my attention.
It didn’t do their stock price much good:
Volkswagen AG dropped 15 percent, the most in almost six years, after it admitted to cheating on U.S. air pollution tests for years.
The shares declined as much as 23.80 euros and were down 14 percent at 140 euros as of 9:03 a.m. in Frankfurt. The drop extends the fall for the year to 24 percent, valuing the Wolfsburg, Germany-based company at 66.2 billion euros ($74.9 billion).
Volkswagen Chief Executive Officer Martin Winterkorn said on Sunday that the company is cooperating with regulatory investigators and ordered its own external investigation into the issue. The CEO said he was “deeply sorry” for breaking the public’s trust.
Public trust is right!
John Decker bought his 2013 Volkswagen Jetta diesel thinking he was doing his part to improve the environment and reduce his carbon footprint.
Now that the German automaker has admitted its claims about the model’s performance were false, he just wants the company to buy it back from him.
“I feel completely deceived by Volkswagen,” Decker, of Sacramento, California, said in an interview. “I’m extremely upset about it. I feel defrauded.”
…
Decker wants Volkswagen to compensate him for the purchase. He said he has been in contact with the law firm of Hagens Berman Sobol Shapiro LLP in Seattle, which announced Sept. 18 that it was filing a federal lawsuit against Volkswagen. The firm estimates that some consumers paid as much as $7,000 more for a diesel model.
“I don’t want my car anymore, frankly,” Decker said. “I’d like Volkswagen to buy it back from me. I really don’t want it. I don’t want to drive it. I don’t want anything to do with Volkswagen.”
Assiduous Reader JP – who has been very industriously outperforming you other bums who never send me anything – also alerts me to the denouement of a Dutch takeover defence initiated last spring:
Israel’s Teva Pharmaceutical Industries Ltd. said Tuesday it is bidding $40 billion for Mylan NV, a drug company with headquarters in Canonsburg, Pa., but incorporated in the Netherlands. In early April, moving preemptively to thwart such an offer, a Dutch law firm submitted paperwork on Mylan’s behalf to the Netherlands trade registry to create an obscure but powerful legal vehicle called a “stichting.”
The entity, named Stichting Preferred Shares Mylan, is essentially an empty shell. But it possesses special powers, thanks to a shareholder-approved provision tucked into the paperwork for a previous Mylan acquisition: If Mylan ever receives an unsolicited takeover bid, the stichting can get veto rights over any takeover.
Stichtings, which mean “foundations” in Dutch, have been around for hundreds of years, primarily used by Dutch charities. During the World War II, Dutch companies transferred their ownership to stichtings based in the Dutch Antilles in the Caribbean to protect assets from the German occupiers, experts say.
…
Their key attribute is that stichtings, often referred to as orphan foundations, don’t have any legal owners. That means they can be used to put money or other assets outside the reach of government authorities, competitors or shareholders. The stichting’s purpose and the responsibilities of its board of directors can be tailored to the vehicle’s needs.
But management has decided it is sufficiently entrenched:
Mylan said Monday that it has moved to cancel the preferred shares issued to the entity in July, as the threats to the company “have been sufficiently addressed.”
In a bit of fun news that shows Natural Philosophy as a hobby is not yet dead, World Bank economist Kaushik Basu has proved the Pythagorean Theorem. I don’t know if there’s any listing of proofs that might be considered authoritative, but here’s one site with 111 versions. Keep them coming, boys! Should we ever meet aliens, it will be most interesting to learn how many proofs they have and which ones they consider standard.
Meanwhile Russians are voting with their feet:
Official statistics show the number of Russian citizens leaving permanently or for more than nine months reached 53,235 in 2014, up 11 percent and the highest in nine years. Germany, the U.S. and Israel all report increases in the numbers of applications for immigration visas from Russia.
 Click for Big
Parakeet Poluz made a good point about Malthusian forecasts and Club of Rome projections:
But history has repeatedly shown that new technologies can quickly upend assumptions about future demand and supply.
For example, back in the 1970s, there were predictions that the world would run out of copper by the end of the century. The people who made that forecast did not foresee that copper wire, long a staple of communications infrastructure, would be replaced by fibre-optic cable, with its glass threads made from silica. This technology helped reduce the demand for copper, in essence extending its supply.
Similarly, digital photography had a dramatic impact on the photo-processing industry. Twenty years ago, the idea that everyone would carry around telephones that were also good-quality cameras was ridiculous. People took pictures with cameras that were loaded with film and took the film to a developer. The processing consumed a lot of silver. Back then, if you didn’t anticipate the emergence of digital photography, you might have expected this source of demand would continue indefinitely. Instead, according to the Washington-based Silver Institute, the use of silver in photography peaked in 1999 and has fallen by almost 80 per cent since.
It would appear that he fulfilled his cheerleading mandate in the question and answer period:
“In terms of being excessively dependent, I don’t buy that. Twenty per cent of our economy is the resource economy. That’s very important; it’s our backbone. It’s always been our history, and the rest is in some way dependent on that continuing to perform,” Mr Poloz told a business audience in Calgary, where the collapse in oil prices has led to deep cuts in spending and thousands of layoffs in the energy sector.
“We’re a highly diversified economy, and we should be thankful that we’ve got resources as part of our diversification, whereas lots of other countries don’t have that.”
During the federal election campaign, there has been considerable debate about the growing emphasis on energy-sector expansion under Conservative Leader Stephen Harper and, subsequently, the broad economic consequences of the industry’s downturn.
Excessively dependent? Bank of Canada research has noted:
Two aspects of the recent monetary history of Canada, Australia, and New Zealand stand out: the sensitivity of their dollars to prices of resource-based commodities, and inflation targeting.
… while less authoritative but still credible research asserts:
In the last ten years, over half of Canada’s total exports consisted of energy and non-energy commodities. Because the Canadian dollar is often called a “commodity currency”, this paper seeks to test the relevance of commodity prices in explaining the variation in the Canadian real exchange rate against the US dollar, the UK pound, and the Japanese yen. The currencies of these countries are chosen for the analysis because of Canada’s strong trade relationships with the United States, the United Kingdom, and Japan. The dynamic empirical model in this research demonstrates that the proportion of the variation in Canada’s real exchange rate that is attributable to a volatile commodity price shock differs depending on the currency pairing. The results also suggest that the relationship between commodity prices and the Canadian dollar has strengthened over the last two decades.
Sounds excessive to me! Meanwhile, Werner Antweiler of UBC has gone so far as to say:
Is the Canadian Dollar a petrodollar? If you had asked me this question in the 1990s, I would have said “only a little”. At the time, commodity prices were not generally thought to be primary drivers of the exchange rate. During that decade, oil prices were relatively flat and thus the observable variation in the exchange rate was driven by other factors. Most international economists, including those at the Bank of Canada who have a professional interest in this question, were indeed puzzled to find that the CAD/USD exchange rate was difficult to predict based on fundamental factors.
While I was researching oil prices for another issue, I had another look at the relationship between oil prices and the CAD/USD exchange rate, and was indeed a bit surprised how much the oil price matters for determining the value of the Canadian Dollar. As two diagrams show below, there can be little question that during the last fifteen years the Canadian Dollar has morphed into a “petrocurrency”.
In simple terms, a petrocurrency is a currency of an oil-producing country—such as Canada—whose oil exports as a share of total exports are sufficiently large that the value of that country’s currency rises and falls along with the price of oil. In other words, a petrocurrency appreciates when the oil price rises and depreciates when the oil price falls.
Perhaps Mr. Poluz will explain how a deeply rooted manufacturing complex is supposed to survive, when our currency fluctuates so much against our number one trading partner with such alarming amplitude?
One of the more entertaining corporate battles of recent times may have ended in a draw:
Sprott Asset Management LP (“Sprott” or “Sprott Asset Management”), together with Sprott Physical Gold Trust (NYSE:PHYS) (TSX:PHY.U) and Sprott Physical Silver Trust (NYSE:PSLV) (TSX:PHS.U), today announced that it has filed notices of extension in connection with the offers by Sprott Asset Management Gold Bid LP and Sprott Asset Management Silver Bid LP to acquire all of the outstanding units of Central GoldTrust (“GTU”) (TSX: GTU.UN) (TSX:GTU.U) (NYSEMKT:GTU) and Silver Bullion Trust (“SBT”) (TSX:SBT.UN) (TSX:SBT.U), respectively, for units of Sprott Physical Gold Trust and units of Sprott Physical Silver Trust, in each case on a net asset value (NAV) to NAV exchange basis (collectively, the “Sprott offers”). The notices of extension extend the expiry time of the Sprott offers to 5 p.m. (Toronto time) on October 9, 2015.
…
As of 5:00 p.m. (Toronto time) on September 18, 2015, there were 9,928,736 GTU units (51.45% of all outstanding units) and 2,065,574 SBT units (37.78% of all outstanding units) tendered into the respective Sprott offers.
IGM Financial, proud issuer of IGM.PR.B, has been confirmed at Pfd-2(high) by DBRS:
DBRS Limited (DBRS) has today confirmed the Issuer Rating and Unsecured Debentures rating of IGM Financial Inc. (IGM or the Company) at A (high) and the First Preferred Shares rating at Pfd-2 (high). The trends are Stable.
…
In addition to strong profitability, the Company’s credit rating also benefits from strong cash flows (which comfortably cover the upfront distribution costs of mutual fund sales), strong liquidity and a conservative financial profile. The Company’s ratio of debt plus preferred shares-to-total capitalization remains appropriate for the rating.
As a member of the Power Financial Corporation (Power) group of companies, IGM benefits from the additional financial flexibility of having a strategic shareholder and the associated strong governance and risk avoidance management model that is typical of Power subsidiaries.
It was a day of little overall movement for the Canadian preferred share market, with PerpetualDiscounts and DeemedRetractibles both off 6bp, while FixedResets gained 4bp. The placidity of the indices masked a lot of churn, though, as reported on the Performance Highlights table. Volume was very low.
For as long as the FixedReset market is so violently unsettled, I’ll keep publishing updates of the more interesting and meaningful series of FixedResets’ Implied Volatilities. This doesn’t include Enbridge because although Enbridge has a large number of issues outstanding, all of which are quite liquid, the range of Issue Reset Spreads is too small for decent conclusions. The low is 212bp (ENB.PR.H; second-lowest is ENB.PR.D at 237bp) and the high is a mere 268 for ENB.PF.G.
Remember that all rich /cheap assessments are:
» based on Implied Volatility Theory only
» are relative only to other FixedResets from the same issuer
» assume constant GOC-5 yield
» assume constant Implied Volatility
» assume constant spread
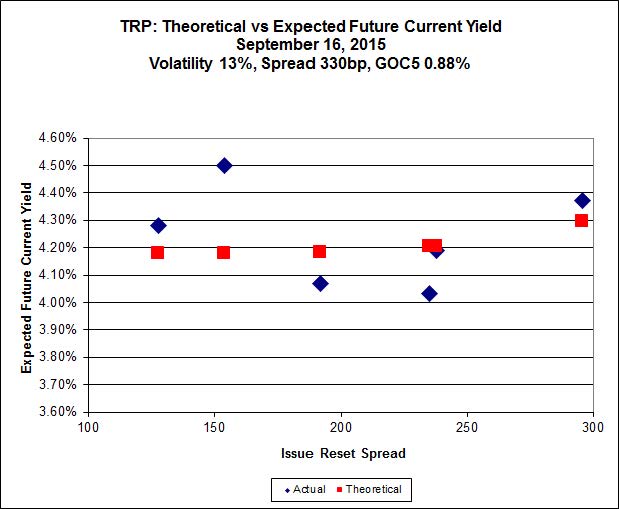
Here’s TRP:
 Click for Big
TRP.PR.E, which resets 2019-10-30 at +235, is bid at 20.00 to be $1.04 rich, while TRP.PR.C, resetting 2016-1-30 at +164, is $1.17 cheap at its bid price of 13.00.
 Click for Big
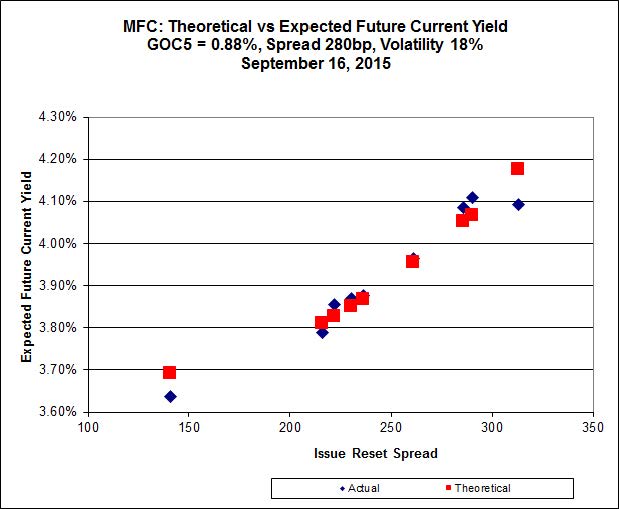
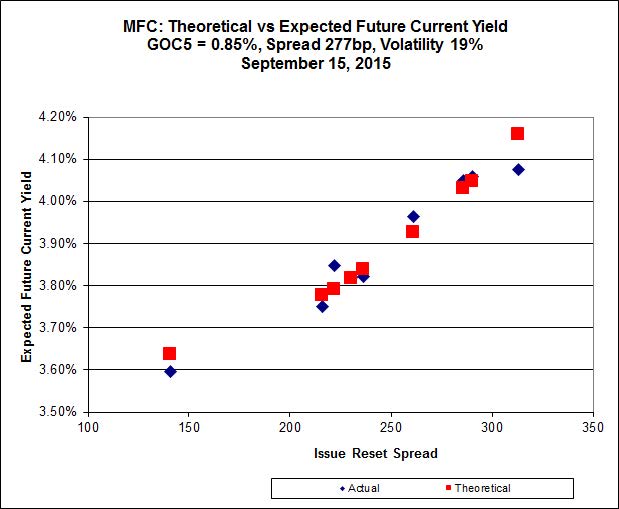
Another good fit today for MFC, with Implied Volatility falling a bit today.
Most expensive is MFC.PR.J, resetting at +261bp on 2018-3-19, bid at 22.65 to be 0.44 rich, while MFC.PR.G, resetting at +290bp on 2016-12-19, is bid at 23.03 to be 0.44 cheap.
 Click for Big
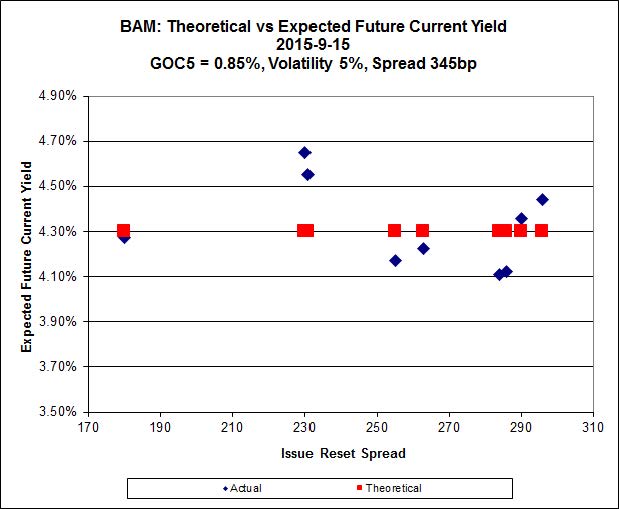
The fit on the BAM issues continues to be horrible.
The cheapest issue relative to its peers is BAM.PR.R, resetting at +230bp on 2016-6-30, bid at 16.50 to be $1.63 cheap. BAM.PF.G, resetting at +284bp on 2020-6-30 is bid at 22.60 and appears to be $1.31 rich.
 Click for Big
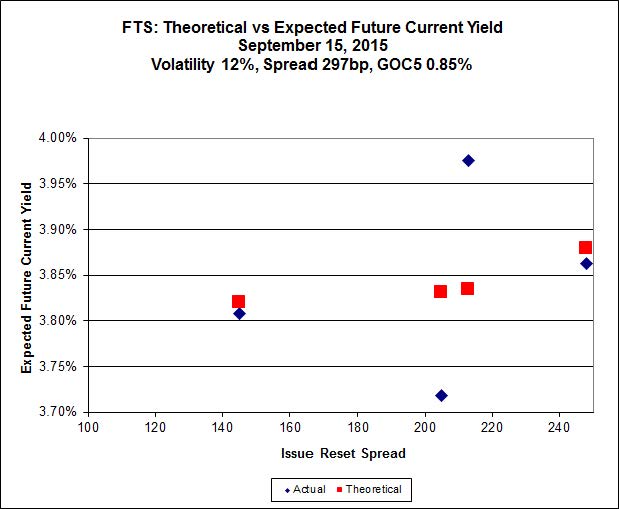
FTS.PR.M, with a spread of +248bp, and bid at 22.15, looks $0.54 expensive and resets 2019-12-1. FTS.PR.G, with a spread of +213bp and resetting 2018-9-1, is bid at 18.79 and is $0.53 cheap.
 Click for Big
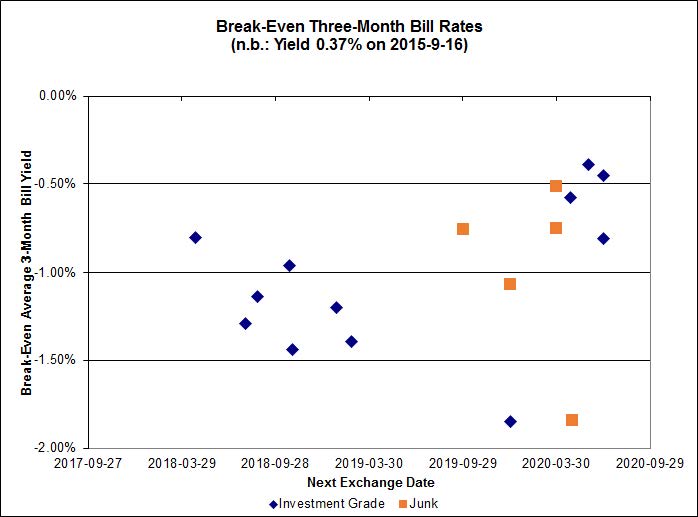
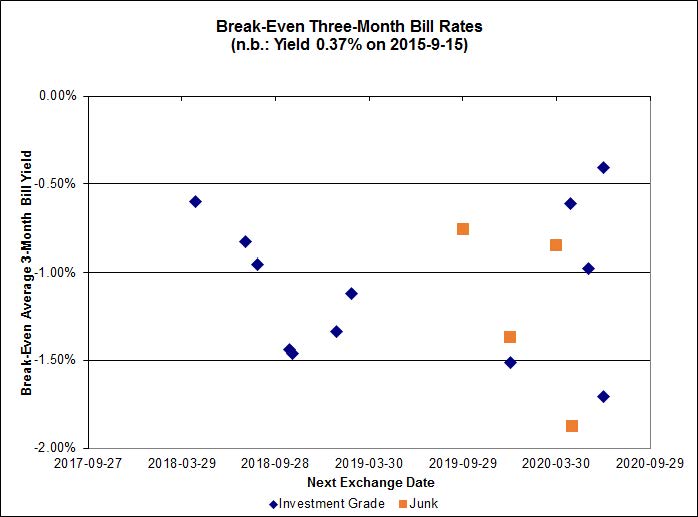
Investment-grade pairs predict an average three-month bill yield over the next five-odd years of -0.93%, with no outliers. The distribution’s bimodality has returned, with bank NVCC non-compliant pairs averaging -1.08% and other issues averaging -0.71%. There are two junk outliers above 0.00%.
 Click for Big
Shall we just say that this exhibits a high level of confidence in the continued rapacity of Canadian banks?
HIMIPref™ Preferred Indices
These values reflect the December 2008 revision of the HIMIPref™ Indices
Values are provisional and are finalized monthly |
| Index |
Mean
Current
Yield
(at bid) |
Median
YTW |
Median
Average
Trading
Value |
Median
Mod Dur
(YTW) |
Issues |
Day’s Perf. |
Index Value |
| Ratchet |
0.00 % |
0.00 % |
0 |
0.00 |
0 |
-0.0954 % |
1,647.0 |
| FixedFloater |
0.00 % |
0.00 % |
0 |
0.00 |
0 |
-0.0954 % |
2,879.8 |
| Floater |
4.51 % |
4.54 % |
59,940 |
16.36 |
3 |
-0.0954 % |
1,750.9 |
| OpRet |
0.00 % |
0.00 % |
0 |
0.00 |
0 |
-0.3382 % |
2,767.8 |
| SplitShare |
4.65 % |
5.03 % |
63,501 |
3.05 |
3 |
-0.3382 % |
3,243.7 |
| Interest-Bearing |
0.00 % |
0.00 % |
0 |
0.00 |
0 |
-0.3382 % |
2,530.8 |
| Perpetual-Premium |
5.71 % |
1.09 % |
53,552 |
0.08 |
8 |
0.0840 % |
2,496.2 |
| Perpetual-Discount |
5.45 % |
5.55 % |
67,270 |
14.55 |
30 |
-0.0619 % |
2,600.4 |
| FixedReset |
4.75 % |
4.24 % |
180,340 |
15.86 |
74 |
0.0365 % |
2,142.2 |
| Deemed-Retractible |
5.15 % |
4.68 % |
91,108 |
5.49 |
33 |
-0.0606 % |
2,578.9 |
| FloatingReset |
2.49 % |
4.12 % |
49,353 |
5.88 |
9 |
0.1700 % |
2,148.3 |
| Performance Highlights |
| Issue |
Index |
Change |
Notes |
| BIP.PR.A |
FixedReset |
-2.78 % |
YTW SCENARIO
Maturity Type : Limit Maturity
Maturity Date : 2045-09-21
Maturity Price : 21.65
Evaluated at bid price : 22.00
Bid-YTW : 5.00 % |
| GWO.PR.N |
FixedReset |
-2.46 % |
YTW SCENARIO
Maturity Type : Hard Maturity
Maturity Date : 2025-01-31
Maturity Price : 25.00
Evaluated at bid price : 14.68
Bid-YTW : 8.74 % |
| MFC.PR.F |
FixedReset |
-1.81 % |
YTW SCENARIO
Maturity Type : Hard Maturity
Maturity Date : 2025-01-31
Maturity Price : 25.00
Evaluated at bid price : 15.22
Bid-YTW : 8.58 % |
| TRP.PR.A |
FixedReset |
-1.79 % |
YTW SCENARIO
Maturity Type : Limit Maturity
Maturity Date : 2045-09-21
Maturity Price : 16.45
Evaluated at bid price : 16.45
Bid-YTW : 4.36 % |
| IFC.PR.C |
FixedReset |
-1.55 % |
YTW SCENARIO
Maturity Type : Hard Maturity
Maturity Date : 2025-01-31
Maturity Price : 25.00
Evaluated at bid price : 19.69
Bid-YTW : 6.65 % |
| BMO.PR.R |
FloatingReset |
-1.47 % |
YTW SCENARIO
Maturity Type : Hard Maturity
Maturity Date : 2022-01-31
Maturity Price : 25.00
Evaluated at bid price : 22.07
Bid-YTW : 4.12 % |
| BNS.PR.Y |
FixedReset |
-1.39 % |
YTW SCENARIO
Maturity Type : Hard Maturity
Maturity Date : 2022-01-31
Maturity Price : 25.00
Evaluated at bid price : 21.30
Bid-YTW : 4.58 % |
| BAM.PR.R |
FixedReset |
-1.31 % |
YTW SCENARIO
Maturity Type : Limit Maturity
Maturity Date : 2045-09-21
Maturity Price : 16.53
Evaluated at bid price : 16.53
Bid-YTW : 4.84 % |
| CU.PR.C |
FixedReset |
-1.24 % |
YTW SCENARIO
Maturity Type : Limit Maturity
Maturity Date : 2045-09-21
Maturity Price : 20.70
Evaluated at bid price : 20.70
Bid-YTW : 3.99 % |
| PWF.PR.F |
Perpetual-Discount |
-1.08 % |
YTW SCENARIO
Maturity Type : Limit Maturity
Maturity Date : 2045-09-21
Maturity Price : 23.63
Evaluated at bid price : 23.90
Bid-YTW : 5.57 % |
| BMO.PR.Y |
FixedReset |
1.04 % |
YTW SCENARIO
Maturity Type : Limit Maturity
Maturity Date : 2045-09-21
Maturity Price : 22.47
Evaluated at bid price : 23.35
Bid-YTW : 3.86 % |
| MFC.PR.N |
FixedReset |
1.07 % |
YTW SCENARIO
Maturity Type : Hard Maturity
Maturity Date : 2025-01-31
Maturity Price : 25.00
Evaluated at bid price : 20.78
Bid-YTW : 5.87 % |
| MFC.PR.J |
FixedReset |
1.12 % |
YTW SCENARIO
Maturity Type : Hard Maturity
Maturity Date : 2025-01-31
Maturity Price : 25.00
Evaluated at bid price : 22.65
Bid-YTW : 4.88 % |
| TRP.PR.B |
FixedReset |
1.12 % |
YTW SCENARIO
Maturity Type : Limit Maturity
Maturity Date : 2045-09-21
Maturity Price : 12.66
Evaluated at bid price : 12.66
Bid-YTW : 4.17 % |
| VNR.PR.A |
FixedReset |
1.26 % |
YTW SCENARIO
Maturity Type : Limit Maturity
Maturity Date : 2045-09-21
Maturity Price : 20.15
Evaluated at bid price : 20.15
Bid-YTW : 4.68 % |
| MFC.PR.I |
FixedReset |
1.27 % |
YTW SCENARIO
Maturity Type : Hard Maturity
Maturity Date : 2025-01-31
Maturity Price : 25.00
Evaluated at bid price : 23.19
Bid-YTW : 4.84 % |
| BAM.PR.X |
FixedReset |
1.31 % |
YTW SCENARIO
Maturity Type : Limit Maturity
Maturity Date : 2045-09-21
Maturity Price : 15.50
Evaluated at bid price : 15.50
Bid-YTW : 4.52 % |
| HSE.PR.G |
FixedReset |
1.34 % |
YTW SCENARIO
Maturity Type : Limit Maturity
Maturity Date : 2045-09-21
Maturity Price : 22.08
Evaluated at bid price : 22.65
Bid-YTW : 4.84 % |
| SLF.PR.H |
FixedReset |
1.43 % |
YTW SCENARIO
Maturity Type : Hard Maturity
Maturity Date : 2025-01-31
Maturity Price : 25.00
Evaluated at bid price : 17.75
Bid-YTW : 7.46 % |
| BNS.PR.D |
FloatingReset |
1.45 % |
YTW SCENARIO
Maturity Type : Hard Maturity
Maturity Date : 2022-01-31
Maturity Price : 25.00
Evaluated at bid price : 20.30
Bid-YTW : 4.83 % |
| BMO.PR.M |
FixedReset |
1.47 % |
YTW SCENARIO
Maturity Type : Hard Maturity
Maturity Date : 2022-01-31
Maturity Price : 25.00
Evaluated at bid price : 24.15
Bid-YTW : 3.56 % |
| TRP.PR.C |
FixedReset |
1.48 % |
YTW SCENARIO
Maturity Type : Limit Maturity
Maturity Date : 2045-09-21
Maturity Price : 13.00
Evaluated at bid price : 13.00
Bid-YTW : 4.65 % |
| BNS.PR.P |
FixedReset |
1.57 % |
YTW SCENARIO
Maturity Type : Hard Maturity
Maturity Date : 2022-01-31
Maturity Price : 25.00
Evaluated at bid price : 24.52
Bid-YTW : 3.51 % |
| SLF.PR.J |
FloatingReset |
1.69 % |
YTW SCENARIO
Maturity Type : Hard Maturity
Maturity Date : 2025-01-31
Maturity Price : 25.00
Evaluated at bid price : 13.25
Bid-YTW : 9.46 % |
| FTS.PR.K |
FixedReset |
1.89 % |
YTW SCENARIO
Maturity Type : Limit Maturity
Maturity Date : 2045-09-21
Maturity Price : 18.85
Evaluated at bid price : 18.85
Bid-YTW : 4.09 % |
| TRP.PR.F |
FloatingReset |
2.08 % |
YTW SCENARIO
Maturity Type : Limit Maturity
Maturity Date : 2045-09-21
Maturity Price : 14.70
Evaluated at bid price : 14.70
Bid-YTW : 3.89 % |
| PWF.PR.P |
FixedReset |
2.36 % |
YTW SCENARIO
Maturity Type : Limit Maturity
Maturity Date : 2045-09-21
Maturity Price : 15.62
Evaluated at bid price : 15.62
Bid-YTW : 3.96 % |
| Volume Highlights |
| Issue |
Index |
Shares
Traded |
Notes |
| FTS.PR.K |
FixedReset |
112,520 |
Desjardins crossed blocks of 85,200 and 10,000, both at 18.95.
YTW SCENARIO
Maturity Type : Limit Maturity
Maturity Date : 2045-09-21
Maturity Price : 18.85
Evaluated at bid price : 18.85
Bid-YTW : 4.09 % |
| TRP.PR.E |
FixedReset |
59,776 |
TD crossed blocks of 17,000 and 20,000, both at 20.05.
YTW SCENARIO
Maturity Type : Limit Maturity
Maturity Date : 2045-09-21
Maturity Price : 20.00
Evaluated at bid price : 20.00
Bid-YTW : 4.31 % |
| RY.PR.J |
FixedReset |
36,284 |
TD crossed 17,000 at 22.62.
YTW SCENARIO
Maturity Type : Limit Maturity
Maturity Date : 2045-09-21
Maturity Price : 22.49
Evaluated at bid price : 23.36
Bid-YTW : 3.78 % |
| RY.PR.I |
FixedReset |
33,900 |
Desjardins crossed blocks of 15,400 and 15,000, both at 24.80.
YTW SCENARIO
Maturity Type : Hard Maturity
Maturity Date : 2022-01-31
Maturity Price : 25.00
Evaluated at bid price : 24.62
Bid-YTW : 3.50 % |
| MFC.PR.G |
FixedReset |
32,593 |
Nesbitt crossed 30,000 at 23.20.
YTW SCENARIO
Maturity Type : Hard Maturity
Maturity Date : 2025-01-31
Maturity Price : 25.00
Evaluated at bid price : 23.03
Bid-YTW : 4.89 % |
| TRP.PR.D |
FixedReset |
28,912 |
YTW SCENARIO
Maturity Type : Limit Maturity
Maturity Date : 2045-09-21
Maturity Price : 19.29
Evaluated at bid price : 19.29
Bid-YTW : 4.40 % |
| There were 16 other index-included issues trading in excess of 10,000 shares. |
| Wide Spread Highlights |
| Issue |
Index |
Quote Data and Yield Notes |
| MFC.PR.M |
FixedReset |
Quote: 21.10 – 21.85
Spot Rate : 0.7500
Average : 0.5086
YTW SCENARIO
Maturity Type : Hard Maturity
Maturity Date : 2025-01-31
Maturity Price : 25.00
Evaluated at bid price : 21.10
Bid-YTW : 5.74 % |
| IFC.PR.C |
FixedReset |
Quote: 19.69 – 20.15
Spot Rate : 0.4600
Average : 0.3114
YTW SCENARIO
Maturity Type : Hard Maturity
Maturity Date : 2025-01-31
Maturity Price : 25.00
Evaluated at bid price : 19.69
Bid-YTW : 6.65 % |
| GWO.PR.R |
Deemed-Retractible |
Quote: 22.25 – 22.60
Spot Rate : 0.3500
Average : 0.2038
YTW SCENARIO
Maturity Type : Hard Maturity
Maturity Date : 2025-01-31
Maturity Price : 25.00
Evaluated at bid price : 22.25
Bid-YTW : 6.40 % |
| TD.PR.Z |
FloatingReset |
Quote: 22.40 – 22.74
Spot Rate : 0.3400
Average : 0.2227
YTW SCENARIO
Maturity Type : Hard Maturity
Maturity Date : 2022-01-31
Maturity Price : 25.00
Evaluated at bid price : 22.40
Bid-YTW : 3.90 % |
| GWO.PR.L |
Deemed-Retractible |
Quote: 25.15 – 25.50
Spot Rate : 0.3500
Average : 0.2367
YTW SCENARIO
Maturity Type : Hard Maturity
Maturity Date : 2025-01-31
Maturity Price : 25.00
Evaluated at bid price : 25.15
Bid-YTW : 5.59 % |
| BMO.PR.R |
FloatingReset |
Quote: 22.07 – 22.50
Spot Rate : 0.4300
Average : 0.3167
YTW SCENARIO
Maturity Type : Hard Maturity
Maturity Date : 2022-01-31
Maturity Price : 25.00
Evaluated at bid price : 22.07
Bid-YTW : 4.12 % |