There’s another reason not to hire a ‘star manager’ to run your mutual fund:
Aston Hill Financial Inc. has lost a key portfolio manager, the latest in a series of setbacks for the embattled asset manager. Late Tuesday, the company announced that Jeffrey Burchell, who had been with the company since 2010 and was also its co-chief investment officer, had resigned.
…
Mr. Burchell carved out a niche at Aston Hill running mutual funds with a dollop of hedge-fund style investing. A portion of the assets in Aston Hill Capital Growth Fund are sold short – a rarity in the mutual fund industry.Most mutual funds use a long-only strategy. The firm also used Mr. Burchell prominently in marketing materials to sell its funds.
Riots in France have targeted Uber:
Uber Technologies Inc. suspended its UberPop share-a-ride service in France amid difficulties in the country including clashes with taxi drivers, tensions with the government and arrests of top executives.
The UberPop service is to be suspended from 8:00 p.m. local time to protect drivers and calm tensions with the French government, according to Uber France spokesman Thomas Meister.
Uber is awaiting a ruling from the French constitutional court in September on the Thevenoud law, which regulates services to transport passengers, Meister said.
…
This followed a protest staged last week by taxi drivers against the low-cost service UberPop. French President Francois Hollande said at the time that UberPop “must be dismantled and made illegal.”The protest even caught up American rock singer Courtney Love, who said on her verified Twitter account that she escaped Roissy Charles de Gaulle airport on a motorcycle after rock-throwing protesters bashed her chauffeured car with metal bats and slashed its tires. She said she felt she’d be be safer in Baghdad.
The vested interests were not so lucky in Toronto:
An Ontario Superior Court judge has dismissed the City of Toronto’s attempt to shut down ride-sharing company Uber.
After a month of deliberating, Justice Sean Dunphy delivered his ruling Friday, saying the city failed to prove that Uber has broken any bylaws or that it is operating an illegal taxicab company.
There is a move in the States towards benefits over cash wages:
In lieu of higher salaries, employers are offering plusher benefits packages to attract and retain talent, a new survey suggests.
In a report on more than 450 employers surveyed by the Society of Human Resource Management, 35 percent cited bigger benefits packages, compared to 28 percent the year before. A small chunk of those asked—7 percent—noted a reduction, but that’s down from 9 percent the year earlier. The survey also noted the rise of such new benefits as company-provided fitness trackers, egg-freezing, group fitness, and student loan repayment programs.
The more attractive vacation and wellness offerings come at the expense of salary increases, as wages remain stagnant. The survey suggested that employees are promoting that trend. “Research has shown that many job seekers frequently place greater importance on health care coverage, flexible work schedules and other benefits rather than on their base salaries,” the report said.
…
The focus on benefits packages has less to do with changing employee preferences than health insurance trends. As health care costs have risen over the last 10 years, health benefits have eaten up an ever-growing share of total employee compensation. Between 2003 and 2013, health insurance premiums rose 60 percent with only an 11 percent increase in income during that same time period, per a Commonwealth Funds study. In the last few years, employers have started shoving even more of those costs on employees, without raising wages, according to the Center for American Progress. That falls in line with SHRM’s survey, which found 43 percent of employers now offer health-savings accounts, in which people put away tax free money to pay for their own medical costs, up from 38 percent five years ago. The report also found an increased focus on preventative focus health plans, with the hopes of decreased spending.
Those who are getting their insurance through Obamacare are in a good position to explain why health benefits are desirable:
Health insurance companies around the country are seeking rate increases of 20 percent to 40 percent or more, saying their new customers under the Affordable Care Act turned out to be sicker than expected. Federal officials say they are determined to see that the requests are scaled back.
Blue Cross and Blue Shield plans — market leaders in many states — are seeking rate increases that average 23 percent in Illinois, 25 percent in North Carolina, 31 percent in Oklahoma, 36 percent in Tennessee and 54 percent in Minnesota, according to documents posted online by the federal government and state insurance commissioners and interviews with insurance executives.
…
A study of 11 cities in different states by the Kaiser Family Foundation found that consumers would see relatively modest increases in premiums if they were willing to switch plans. But if they switch plans, consumers would have no guarantee that they can keep their doctors. And to get low premiums, they sometimes need to accept a more limited choice of doctors and hospitals.
…
Sylvia Mathews Burwell, the secretary of health and human services, said that federal subsidies would soften the impact of any rate increases. Of the 10.2 million people who obtained coverage through federal and state marketplaces this year, 85 percent receive subsidies in the form of tax credits to help pay premiums.
One problem, I think, is that the rates are cost-plus:
Federal officials have often highlighted a provision of the Affordable Care Act that caps insurers’ profits and requires them to spend at least 80 percent of premiums on medical care and related activities. “Because of the Affordable Care Act,” Mr. Obama told supporters in 2013, “insurance companies have to spend at least 80 percent of every dollar that you pay in premiums on your health care — not on overhead, not on profits, but on you.”
So why get tough on charges? If you pay $53 for a pair of gloves, you can justify $66 worth of premiums! Score!
But if you’re uninsured you’re pigeon pie:
Fifty hospitals in the United States are charging uninsured consumers more than 10 times the actual cost of patient care, according to research published Monday.
…
Topping the list is North Okaloosa Medical Center, a 110-bed facility in the Florida Panhandle about an hour outside of Pensacola. Uninsured patients are charged 12.6 times the actual cost of patient care.
…
By comparison, the researchers said, a typical U.S. hospital charges 3.4 times the cost of patient care.
Partners Value Split Corp., proud issuer of PVS.PR.A, PVS.PR.B, PVS.PR.C and PVS.PR.D, has been confirmed at Pfd-2(low) by DBRS:
DBRS Limited (DBRS) has today confirmed the Pfd-2 (low) ratings of the Class AA Preferred Shares, Series 1 (the Series 1 Preferred Shares), Class AA Preferred Shares, Series 3 (the Series 3 Preferred Shares), Class AA Preferred Shares, Series 5 (the Series 5 Preferred Shares) and the Class AA Preferred Shares, Series 6 (the Series 6 Preferred Shares; collectively, the Class AA Preferred Shares) issued by Partners Value Split Corp. (the Company).
The Company owns a portfolio (the Portfolio) of Class A Limited Voting Shares (the BAM Shares) of Brookfield Asset Management Inc. (BAM; rated A (low) by DBRS).
…
The downside protection available to the Class AA Preferred Shares is approximately 84%, based on the market value of the BAM Shares as of July 2, 2015. The current Class AA Preferred Share dividend coverage ratio is approximately 1.8 times. As a result, the Company continues to be able to fund the Class AA Preferred Shares distributions without relying on other methods for generating income or reverting to the sale of common shares in the Portfolio. In the event of a shortfall, the Company may sell some of the BAM Shares, engage in securities lending or write covered call options to generate sufficient income to satisfy its obligations to pay the Class AA Preferred Shares dividends.The Pfd-2 (low) ratings of the Class AA Preferred Shares are primarily based on the downside protection and dividend coverage available to the Class AA Preferred Shares.
It was a mixed day for the Canadian preferred share market, with PerpetualDiscounts gaining 27bp, FixedResets off 1bp and DeemedRetractibles flat. Floaters got hammered. The Performance Highlights table shows that volatility continues. There are not enough adjectives in the English language to describe how low the volume was, as all the hard-working PMs and advisors enjoyed the US holiday.
For as long as the FixedReset market is so violently unsettled, I’ll keep publishing updates of the more interesting and meaningful series of FixedResets’ Implied Volatilities. This doesn’t include Enbridge because although Enbridge has a large number of issues outstanding, all of which are quite liquid, the range of Issue Reset Spreads is too small for decent conclusions. The low is 212bp (ENB.PR.H; second-lowest is ENB.PR.D at 237bp) and the high is a mere 268 for ENB.PF.G.
Remember that all rich /cheap assessments are:
» based on Implied Volatility Theory only
» are relative only to other FixedResets from the same issuer
» assume constant GOC-5 yield
» assume constant Implied Volatility
» assume constant spread
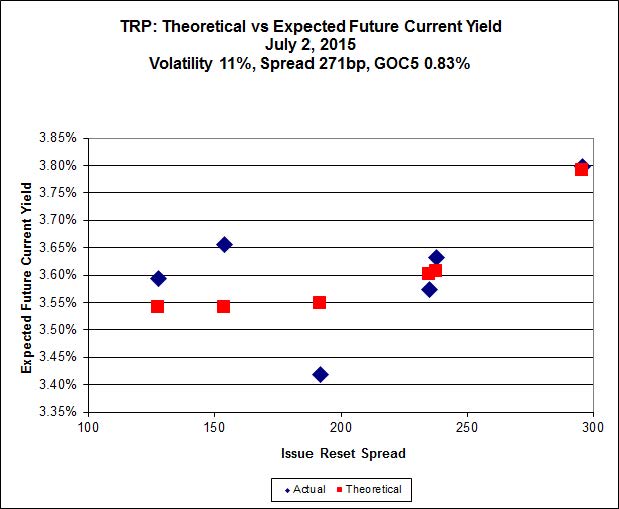
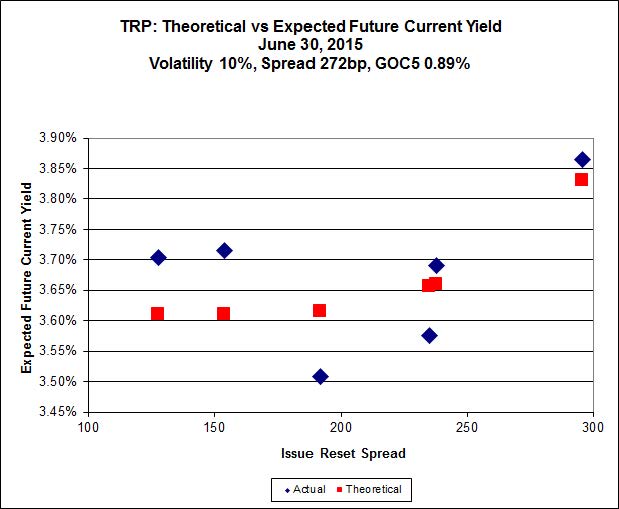
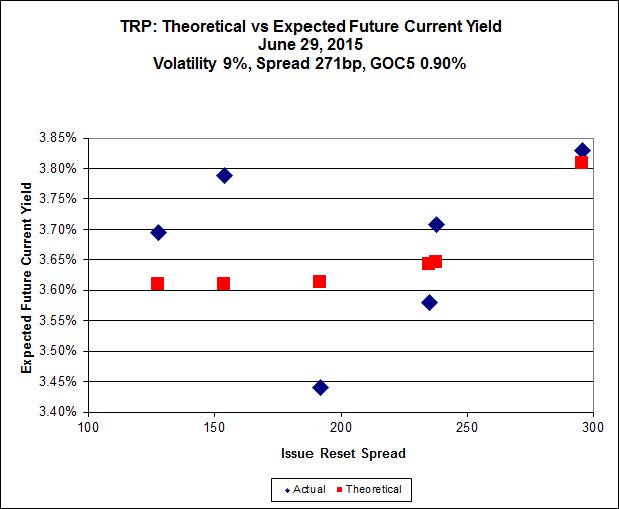
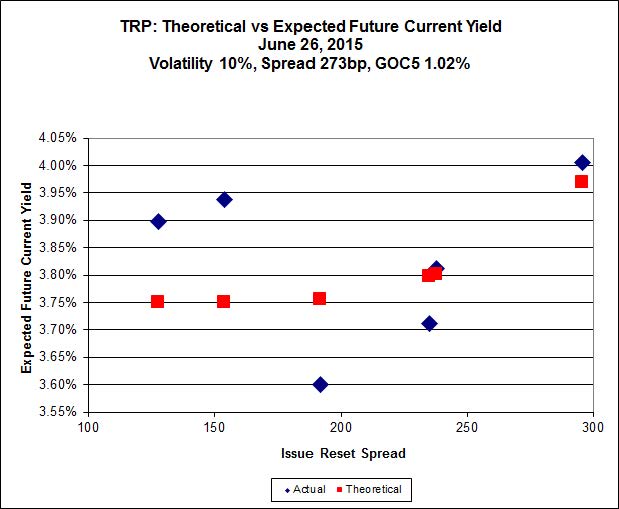
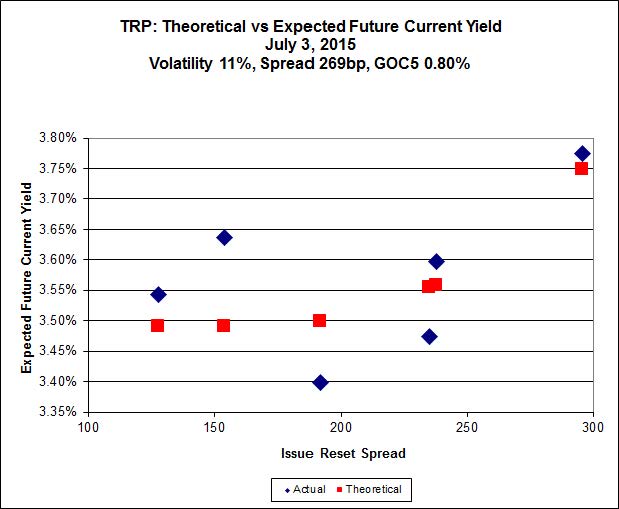
Here’s TRP:
Click for Big
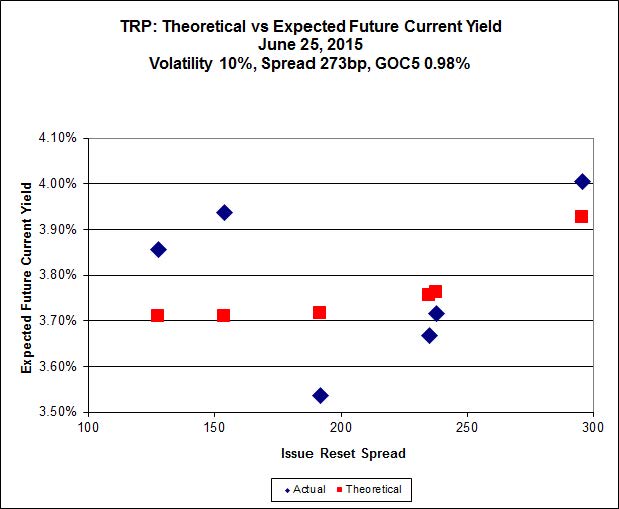
TRP.PR.A, which resets 2019-12-31 at +192, is bid at 20.01 to be $0.58 rich, while TRP.PR.C, resetting 2016-1-30 at +154, is $0.67 cheap at its bid price of 16.09.
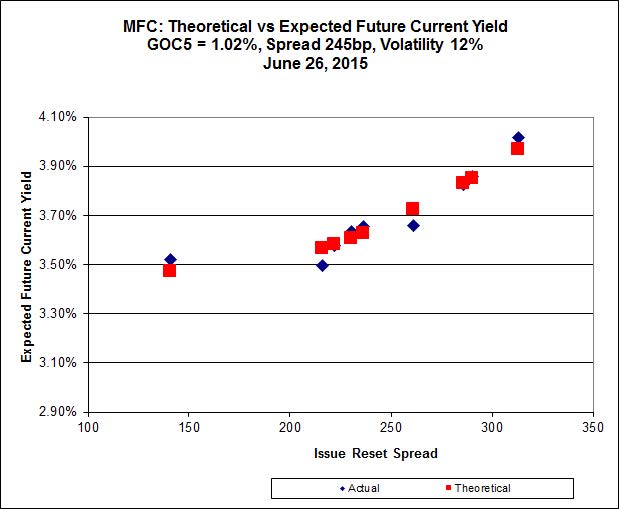
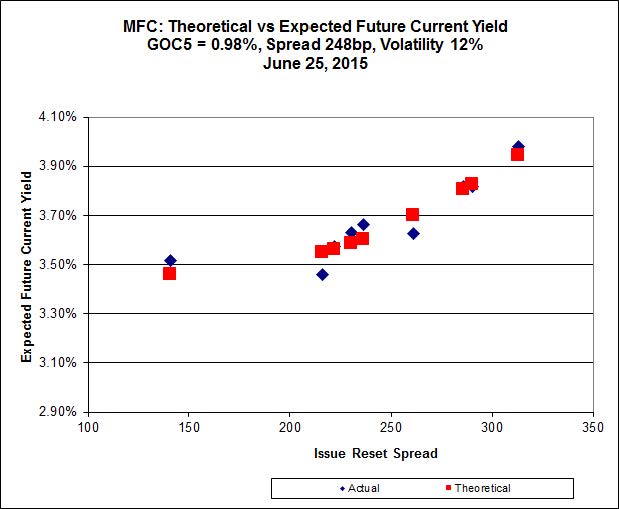
Click for Big
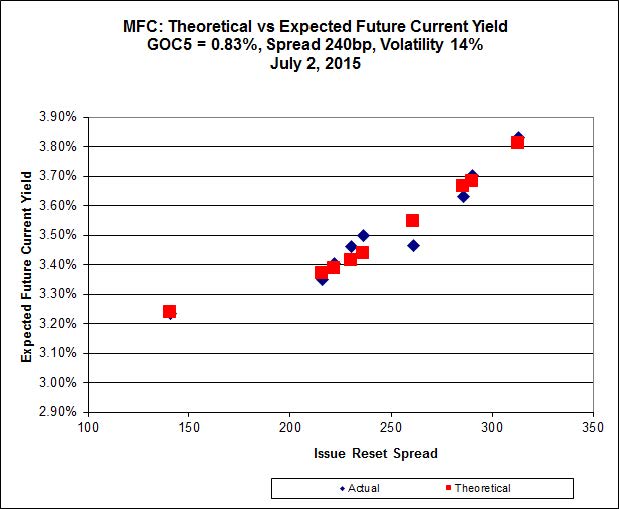
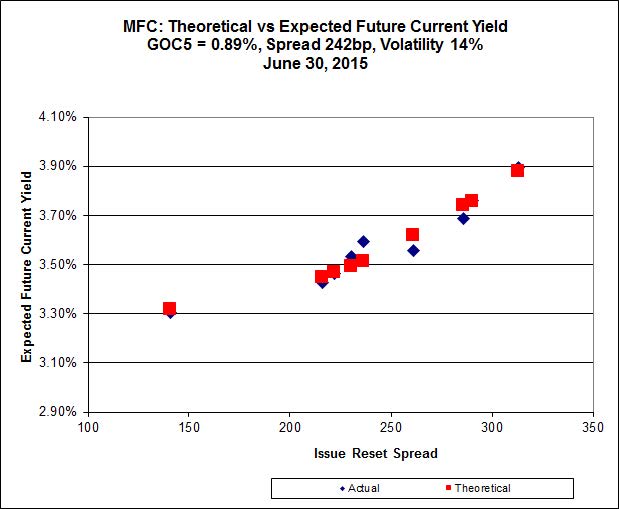
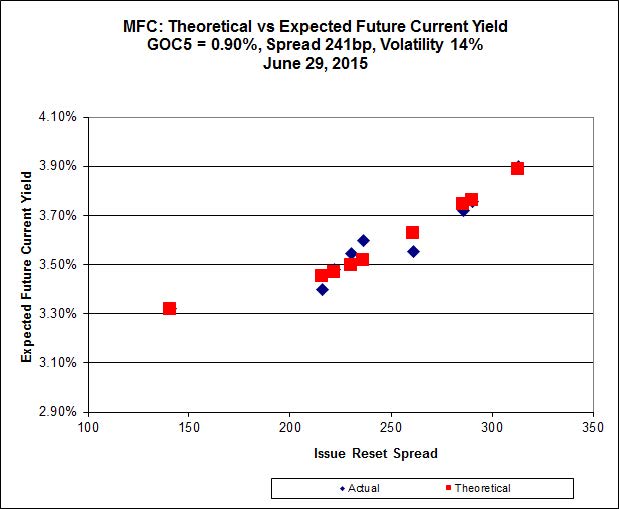
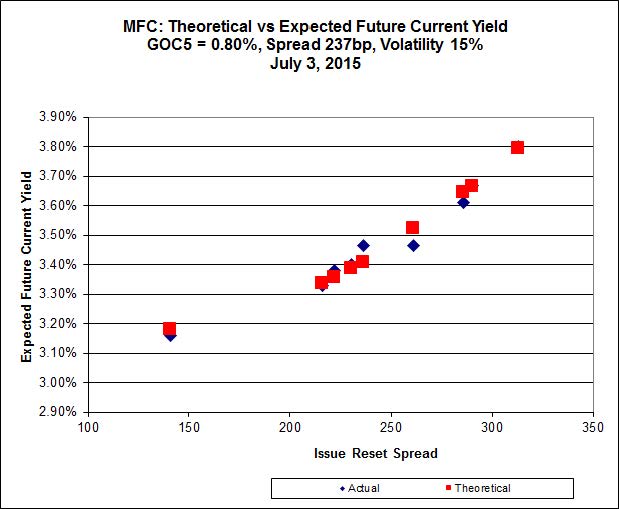
Another excellent fit, but the numbers are perplexing. Implied Volatility for MFC continues to be a conundrum. It is still too high if we consider that NVCC rules will never apply to these issues; it is still too low if we consider them to be NVCC non-compliant issues (and therefore with Deemed Maturities in the call schedule).
Most expensive is MFC.PR.J, resetting at +261bp on 2018-3-19, bid at 24.61 to be $0.40 rich, while MFC.PR.M, resetting at +236bp on 2019-12-19, is bid at 22.80 to be $0.38 cheap.
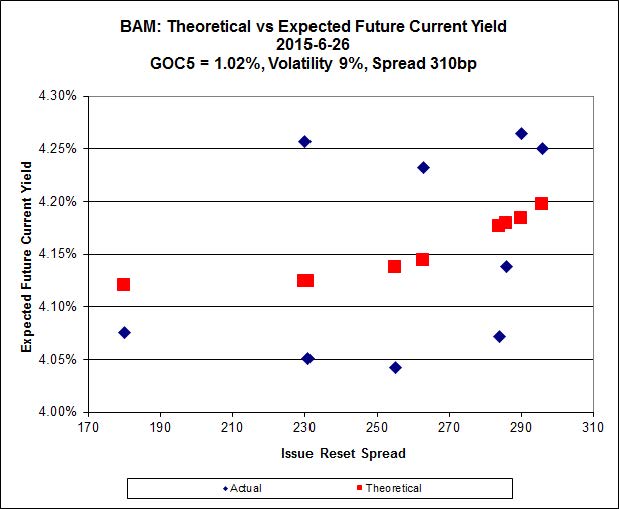
Click for Big
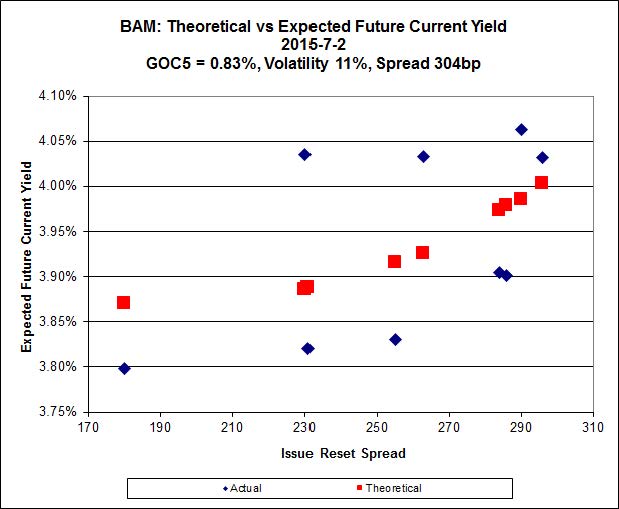
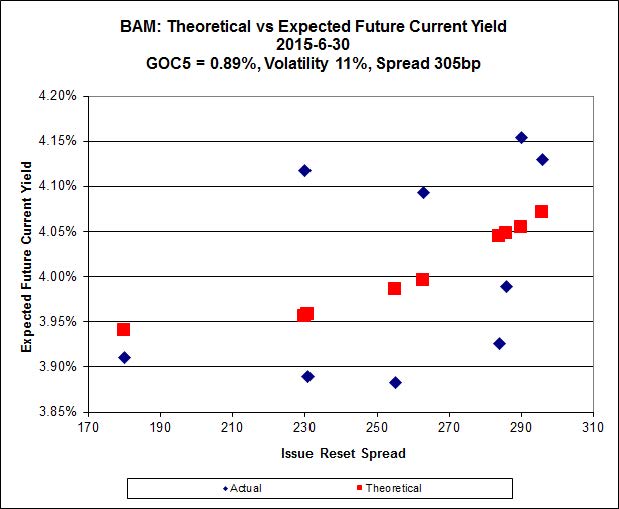
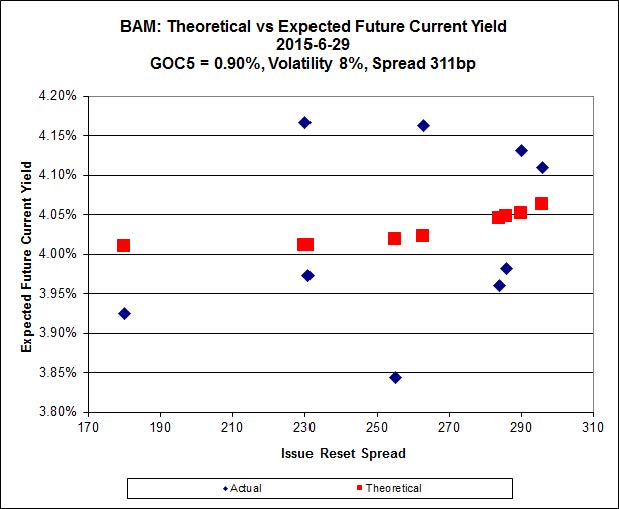
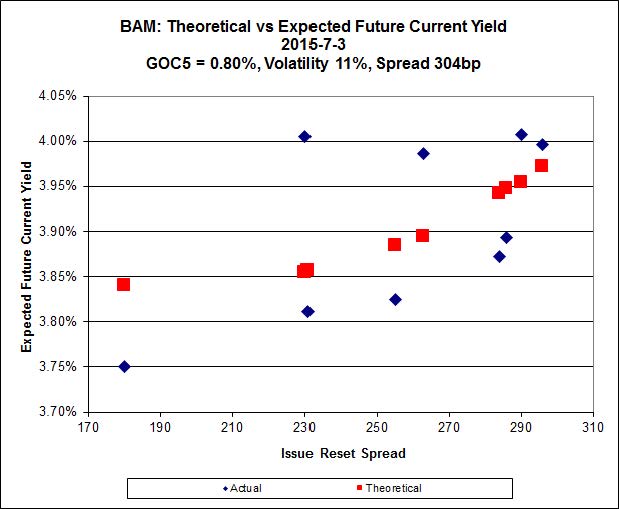
The cheapest issue relative to its peers is BAM.PR.R, resetting at +230bp on 2016-6-30, bid at 19.35 to be $0.75 cheap. BAM.PF.G, resetting at +284bp 2020-6-30 is bid at 23.50 and appears to be $0.42 rich.
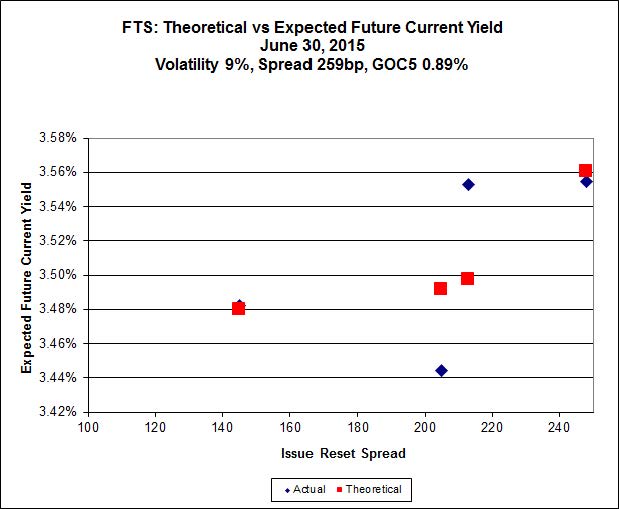
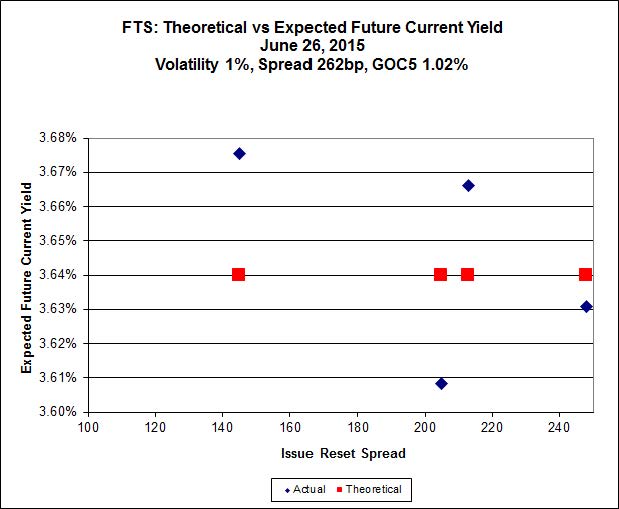
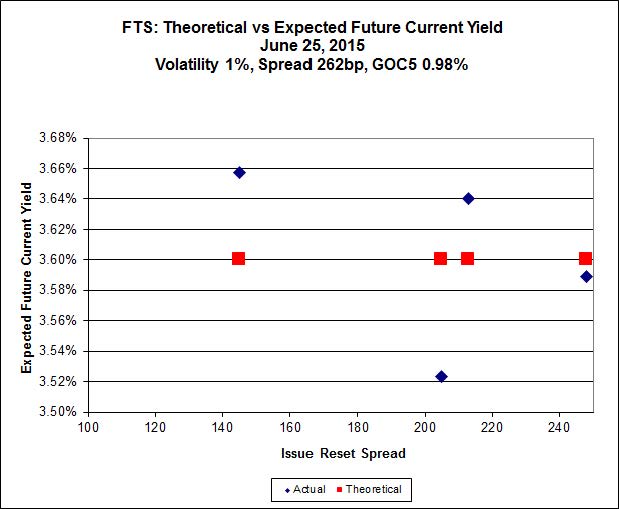
Click for Big
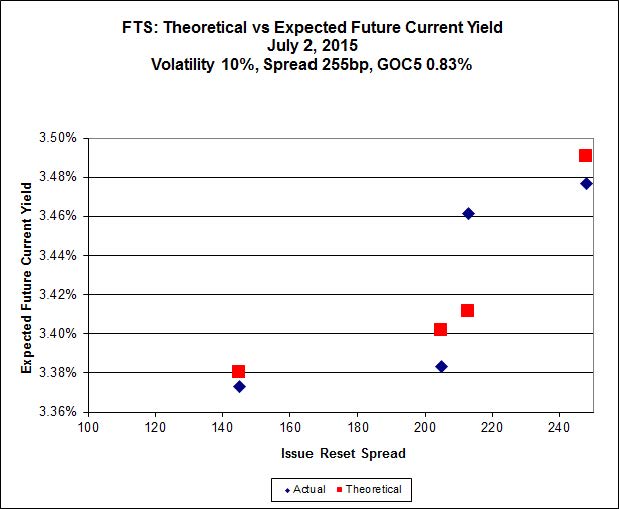
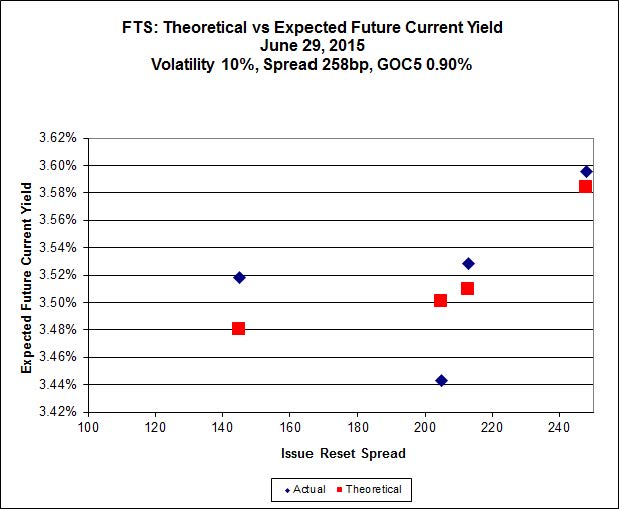
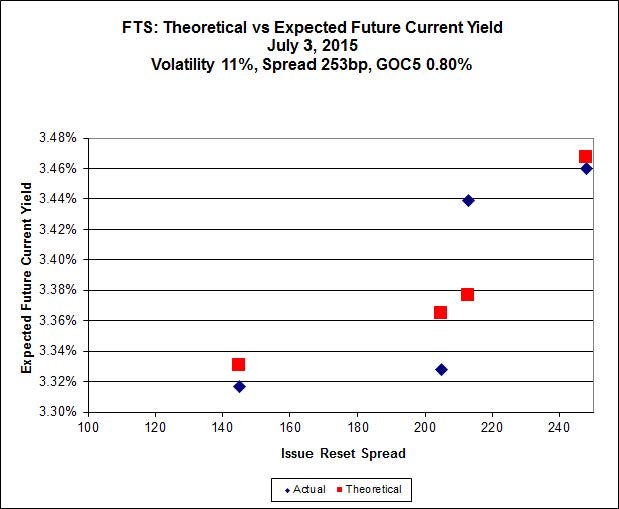
FTS.PR.G, with a spread of +213bp, and bid at 21.38, looks $0.39 cheap and resets 2018-9-1. FTS.PR.K, with a spread of +205bp and resetting 2019-3-1, is bid at 21.41 and is $0.23 rich.
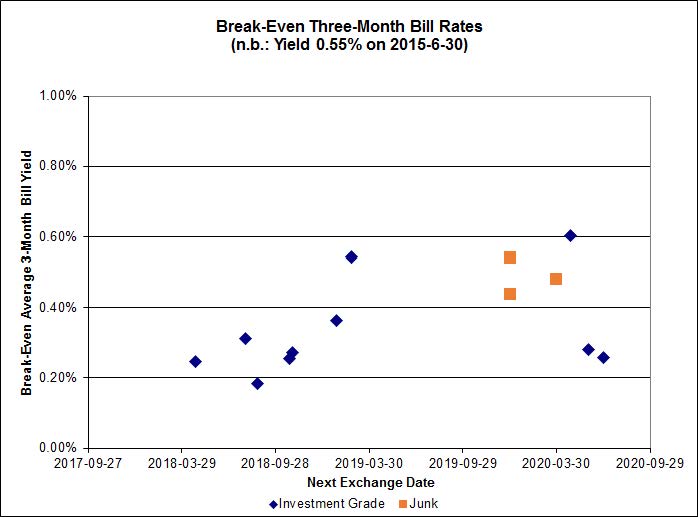
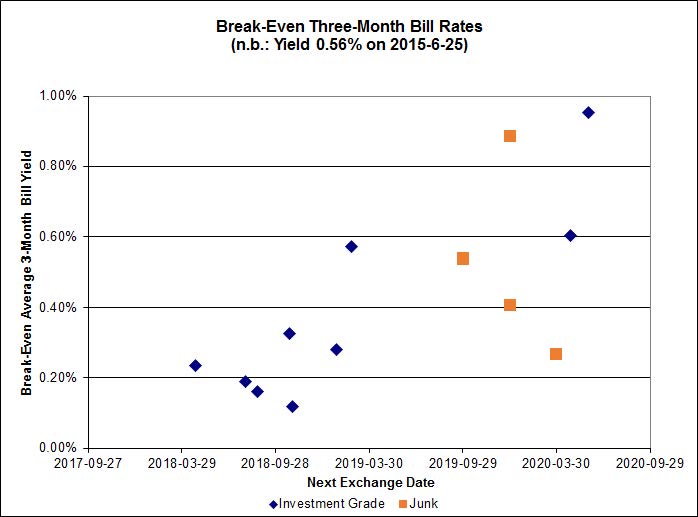
Click for Big
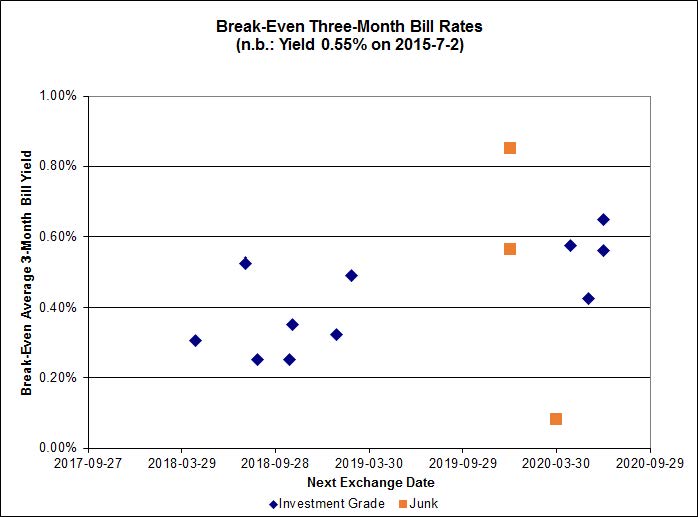
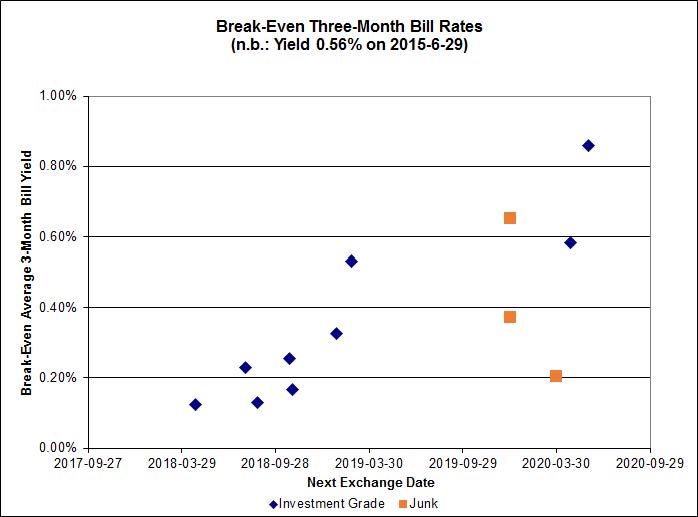
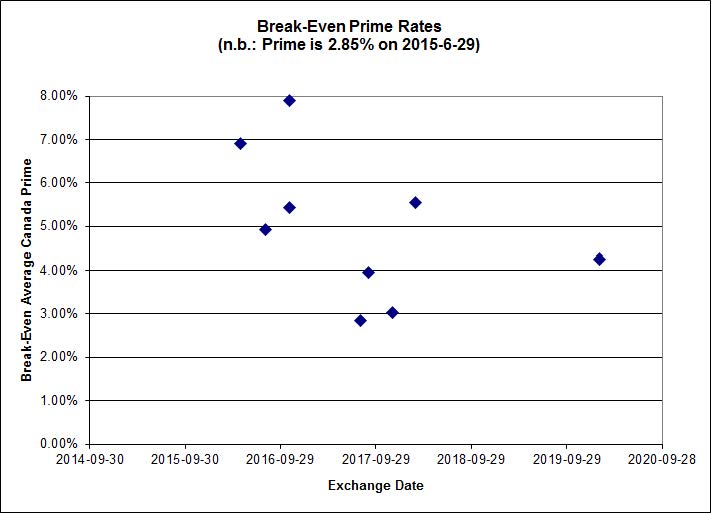
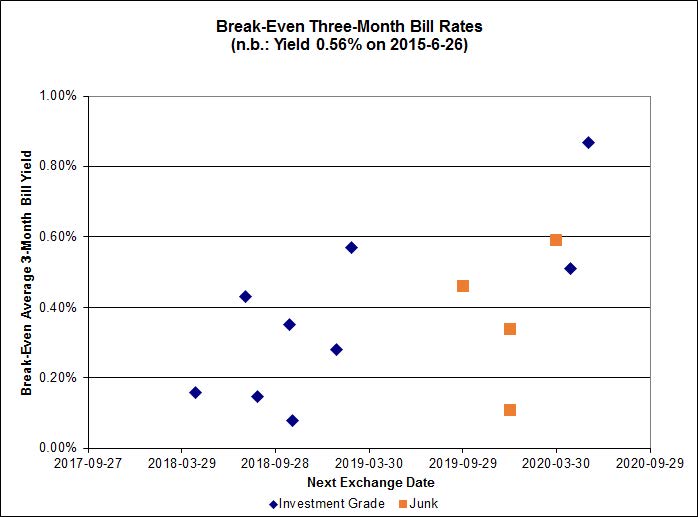
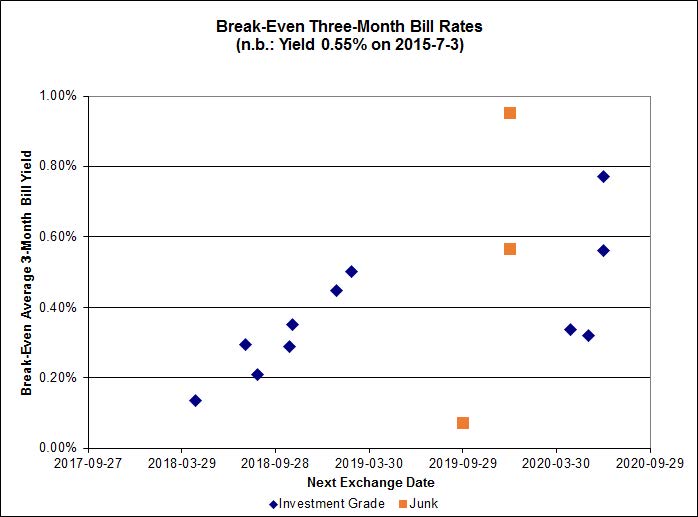
Investment-grade pairs predict an average three-month bill yield over the next five-odd years of about 0.35%, including the outlier TRP.PR.A / TRP.PR.F at -0.03%. On the junk side there are three outliers: FFH.PR.E / FFH.PR.F at -0.58%; BRF.PR.A / BRF.PR.B at -0.68%; and AIM.PR.A / AIM.PR.B at -0.01%.

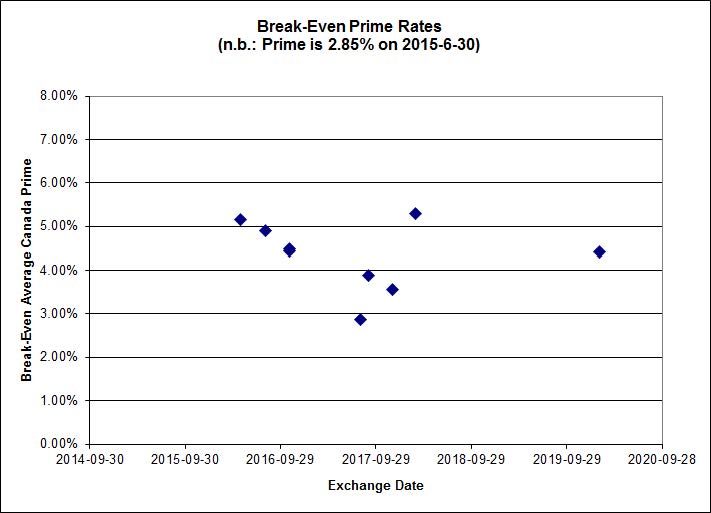
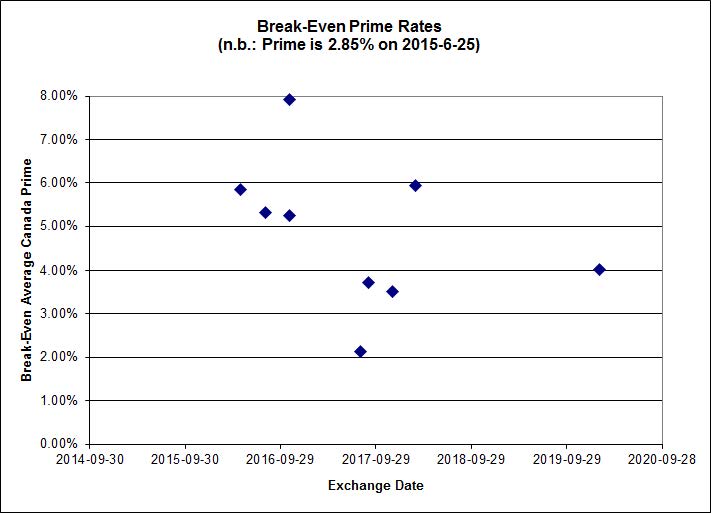
Click for Big
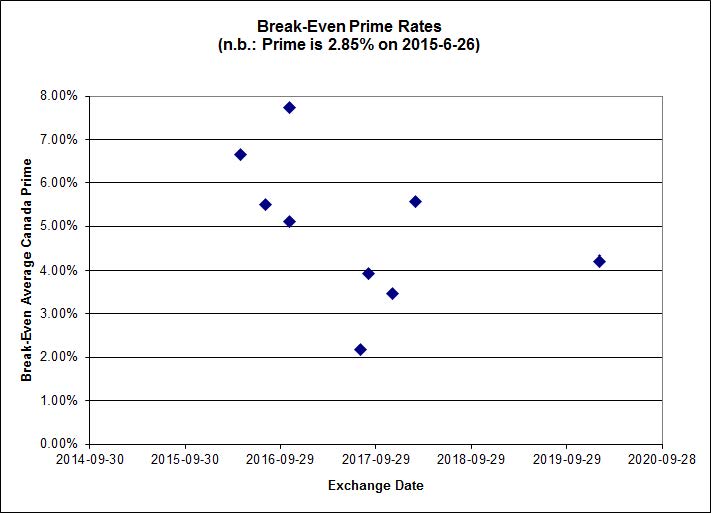
Shall we just say that this exhibits a high level of confidence in the continued rapacity of Canadian banks?
| HIMIPref™ Preferred Indices These values reflect the December 2008 revision of the HIMIPref™ Indices Values are provisional and are finalized monthly |
|||||||
| Index | Mean Current Yield (at bid) |
Median YTW |
Median Average Trading Value |
Median Mod Dur (YTW) |
Issues | Day’s Perf. | Index Value |
| Ratchet | 0.00 % | 0.00 % | 0 | 0.00 | 0 | -1.4065 % | 2,213.2 |
| FixedFloater | 0.00 % | 0.00 % | 0 | 0.00 | 0 | -1.4065 % | 3,869.8 |
| Floater | 3.50 % | 3.51 % | 61,195 | 18.53 | 3 | -1.4065 % | 2,352.8 |
| OpRet | 0.00 % | 0.00 % | 0 | 0.00 | 0 | -0.1071 % | 2,771.4 |
| SplitShare | 4.59 % | 4.94 % | 65,595 | 3.24 | 3 | -0.1071 % | 3,248.0 |
| Interest-Bearing | 0.00 % | 0.00 % | 0 | 0.00 | 0 | -0.1071 % | 2,534.2 |
| Perpetual-Premium | 5.46 % | 3.87 % | 66,390 | 0.08 | 13 | 0.0846 % | 2,517.8 |
| Perpetual-Discount | 5.33 % | 5.24 % | 93,269 | 15.00 | 21 | 0.2689 % | 2,680.7 |
| FixedReset | 4.51 % | 3.78 % | 217,156 | 16.19 | 88 | -0.0071 % | 2,328.1 |
| Deemed-Retractible | 5.02 % | 4.76 % | 107,882 | 0.80 | 34 | -0.0047 % | 2,620.6 |
| FloatingReset | 2.92 % | 3.25 % | 54,158 | 6.00 | 10 | 0.1567 % | 2,327.1 |
| Performance Highlights | |||
| Issue | Index | Change | Notes |
| TD.PF.D | FixedReset | -3.71 % | YTW SCENARIO Maturity Type : Limit Maturity Maturity Date : 2045-07-03 Maturity Price : 22.73 Evaluated at bid price : 23.90 Bid-YTW : 3.84 % |
| ENB.PR.F | FixedReset | -2.72 % | YTW SCENARIO Maturity Type : Limit Maturity Maturity Date : 2045-07-03 Maturity Price : 17.91 Evaluated at bid price : 17.91 Bid-YTW : 4.96 % |
| BAM.PR.C | Floater | -1.75 % | YTW SCENARIO Maturity Type : Limit Maturity Maturity Date : 2045-07-03 Maturity Price : 14.00 Evaluated at bid price : 14.00 Bid-YTW : 3.58 % |
| BAM.PR.B | Floater | -1.43 % | YTW SCENARIO Maturity Type : Limit Maturity Maturity Date : 2045-07-03 Maturity Price : 14.50 Evaluated at bid price : 14.50 Bid-YTW : 3.46 % |
| CM.PR.O | FixedReset | -1.31 % | YTW SCENARIO Maturity Type : Limit Maturity Maturity Date : 2045-07-03 Maturity Price : 22.12 Evaluated at bid price : 22.65 Bid-YTW : 3.68 % |
| IFC.PR.A | FixedReset | -1.18 % | YTW SCENARIO Maturity Type : Hard Maturity Maturity Date : 2025-01-31 Maturity Price : 25.00 Evaluated at bid price : 19.27 Bid-YTW : 6.41 % |
| IAG.PR.A | Deemed-Retractible | -1.09 % | YTW SCENARIO Maturity Type : Hard Maturity Maturity Date : 2025-01-31 Maturity Price : 25.00 Evaluated at bid price : 22.75 Bid-YTW : 5.88 % |
| BAM.PR.K | Floater | -1.04 % | YTW SCENARIO Maturity Type : Limit Maturity Maturity Date : 2045-07-03 Maturity Price : 14.26 Evaluated at bid price : 14.26 Bid-YTW : 3.51 % |
| ELF.PR.H | Perpetual-Discount | 1.01 % | YTW SCENARIO Maturity Type : Limit Maturity Maturity Date : 2045-07-03 Maturity Price : 24.46 Evaluated at bid price : 24.95 Bid-YTW : 5.51 % |
| FTS.PR.F | Perpetual-Discount | 1.24 % | YTW SCENARIO Maturity Type : Limit Maturity Maturity Date : 2045-07-03 Maturity Price : 23.31 Evaluated at bid price : 23.60 Bid-YTW : 5.24 % |
| RY.PR.Z | FixedReset | 1.30 % | YTW SCENARIO Maturity Type : Limit Maturity Maturity Date : 2045-07-03 Maturity Price : 22.57 Evaluated at bid price : 23.40 Bid-YTW : 3.48 % |
| SLF.PR.H | FixedReset | 1.37 % | YTW SCENARIO Maturity Type : Hard Maturity Maturity Date : 2025-01-31 Maturity Price : 25.00 Evaluated at bid price : 20.78 Bid-YTW : 5.51 % |
| ENB.PR.P | FixedReset | 1.48 % | YTW SCENARIO Maturity Type : Limit Maturity Maturity Date : 2045-07-03 Maturity Price : 18.57 Evaluated at bid price : 18.57 Bid-YTW : 4.81 % |
| BAM.PF.D | Perpetual-Discount | 1.54 % | YTW SCENARIO Maturity Type : Limit Maturity Maturity Date : 2045-07-03 Maturity Price : 21.42 Evaluated at bid price : 21.75 Bid-YTW : 5.65 % |
| SLF.PR.G | FixedReset | 1.66 % | YTW SCENARIO Maturity Type : Hard Maturity Maturity Date : 2025-01-31 Maturity Price : 25.00 Evaluated at bid price : 16.50 Bid-YTW : 7.31 % |
| TRP.PR.E | FixedReset | 1.89 % | YTW SCENARIO Maturity Type : Limit Maturity Maturity Date : 2045-07-03 Maturity Price : 22.12 Evaluated at bid price : 22.67 Bid-YTW : 3.78 % |
| TD.PF.A | FixedReset | 2.26 % | YTW SCENARIO Maturity Type : Limit Maturity Maturity Date : 2045-07-03 Maturity Price : 22.38 Evaluated at bid price : 23.11 Bid-YTW : 3.57 % |
| SLF.PR.J | FloatingReset | 2.50 % | YTW SCENARIO Maturity Type : Hard Maturity Maturity Date : 2025-01-31 Maturity Price : 25.00 Evaluated at bid price : 16.40 Bid-YTW : 7.39 % |
| Volume Highlights | |||
| Issue | Index | Shares Traded |
Notes |
| BNS.PR.L | Deemed-Retractible | 111,827 | TD crossed 100,100 at 25.20. YTW SCENARIO Maturity Type : Call Maturity Date : 2016-04-27 Maturity Price : 25.00 Evaluated at bid price : 25.12 Bid-YTW : 3.46 % |
| SLF.PR.I | FixedReset | 63,900 | Nesbitt crossed 59,600 at 24.80. YTW SCENARIO Maturity Type : Hard Maturity Maturity Date : 2025-01-31 Maturity Price : 25.00 Evaluated at bid price : 24.75 Bid-YTW : 3.90 % |
| TD.PF.D | FixedReset | 41,300 | Scotia crossed 25,000 at 24.80. YTW SCENARIO Maturity Type : Limit Maturity Maturity Date : 2045-07-03 Maturity Price : 22.73 Evaluated at bid price : 23.90 Bid-YTW : 3.84 % |
| BNS.PR.Z | FixedReset | 30,551 | YTW SCENARIO Maturity Type : Hard Maturity Maturity Date : 2022-01-31 Maturity Price : 25.00 Evaluated at bid price : 23.35 Bid-YTW : 3.53 % |
| SLF.PR.J | FloatingReset | 23,954 | Recently listed following conversion. YTW SCENARIO Maturity Type : Hard Maturity Maturity Date : 2025-01-31 Maturity Price : 25.00 Evaluated at bid price : 16.40 Bid-YTW : 7.39 % |
| ENB.PR.Y | FixedReset | 17,286 | YTW SCENARIO Maturity Type : Limit Maturity Maturity Date : 2045-07-03 Maturity Price : 17.92 Evaluated at bid price : 17.92 Bid-YTW : 4.87 % |
| There were 6 other index-included issues trading in excess of 10,000 shares. | |||
| Wide Spread Highlights | ||
| Issue | Index | Quote Data and Yield Notes |
| TD.PF.D | FixedReset | Quote: 23.90 – 24.90 Spot Rate : 1.0000 Average : 0.5472 YTW SCENARIO |
| TRP.PR.H | FloatingReset | Quote: 14.35 – 20.09 Spot Rate : 5.7400 Average : 5.5474 YTW SCENARIO |
| CM.PR.O | FixedReset | Quote: 22.65 – 23.45 Spot Rate : 0.8000 Average : 0.6075 YTW SCENARIO |
| NA.PR.W | FixedReset | Quote: 22.40 – 22.89 Spot Rate : 0.4900 Average : 0.3094 YTW SCENARIO |
| ENB.PR.A | Perpetual-Discount | Quote: 24.78 – 25.26 Spot Rate : 0.4800 Average : 0.3123 YTW SCENARIO |
| ENB.PR.F | FixedReset | Quote: 17.91 – 18.32 Spot Rate : 0.4100 Average : 0.2442 YTW SCENARIO |