It was a poor day for US equities:
The Standard & Poor’s 500 Index lost 1.3 percent by 4 p.m. in New York, while the Dow Jones Industrial Average slid the most since Jan. 5. The Stoxx Europe 600 Index dropped 1 percent from a seven-year high as euro climbed 1.3 percent to $1.1378. Japan’s currency strengthened 0.5 percent helping send the Bloomberg Dollar Spot Index to its first retreat in eight days. Gold futures rose 1 percent as 10-year Treasury (USGG10YR) yields fell one basis point to 1.82 percent. U.S. natural gas advanced 3.5 percent as a snowstorm blanketed the country’s northeast.
Caterpillar (CAT), the world’s largest manufacturer of mining and construction equipment, reported profit that missed estimates, while Microsoft’s software-license sales to businesses trailed estimates. Orders for business equipment in the U.S. unexpectedly fell in December for a fourth month, signaling the global slowdown may be weighing on American companies. U.S. stock exchanges were operating normally amid travel bans imposed by the government because of the snowstorm.
…
Orders for U.S. durable goods — items meant to last at least three years — decreased 3.4 percent in December after falling 2.1 percent the prior month, Commerce Department data showed. Separate reports showed U.S. consumer confidence surged more than forecast, while purchases of new homes increased 11.6 percent in December.
… but Canada did all right:
Canadian stocks rose a fifth day, after erasing an earlier loss, as gold producers rallied to offset disappointing U.S. economic data and earnings. The U.S. is Canada’s largest trading partner.
Metro Inc. rallied to a record after announcing a three-for-one stock split and dividend increase. Torex Gold Resources Inc. and Detour Gold Corp. jumped at least 5.6 percent as gold snapped a two-day decline. Finning International Inc. (FTT), which sells Caterpillar Inc. equipment, lost 3.8 percent after the U.S.-based heavy equipment company forecast profit that missed estimates.
The Standard & Poor’s/TSX Composite Index (SPTSX) rose 36.05 points, or 0.2 percent, to 14,833.88 at 4 p.m. in Toronto, erasing an earlier loss of as much as 1 percent. The benchmark Canadian equity gauge has rallied 3.7 percent during its five-day streak, the longest since November. It is up 1.4 percent this year and trades at a two-month high.
Toronto is headed for another round of airport wars:
AGF Management Ltd. and billionaire investor Larry Tanenbaum are part of an investment group that agreed to buy Toronto Island’s Billy Bishop airport terminal from Porter Aviation Holdings Inc.
The terms of the deal weren’t disclosed, according to a statement today from the buyers, known as Nieuport Aviation Infrastructure Partners GP. People familiar with the matter said this month the sale of the terminal was expected to raise more than C$750 million ($605 million).
Robert Deluce, Porter’s chief executive officer, declined to comment on the price, saying the matter was confidential.
…
He said the airline remains focused on getting the go-ahead to expand the runway at Billy Bishop to accommodate the use of Bombardier Inc. (BBD/B) CSeries jets. He expects the matter will go before a vote at Toronto’s city council in the second half of 2015.Deluce said he hoped the addition of a new terminal owner at the airport will bolster efforts to expand it.
The investment group included InstarAGF Asset Management Inc., a joint venture between AGF and Instar Group Inc. The group said it contributed C$105 million of capital to acquire the terminal.
AGF, based in Toronto, is a money manager with more than C$34 billion in assets under management. InstarAGF and Instar Group are run by Gregory Smith, a former executive at Brookfield Financial and Macquarie Capital Funds Canada Ltd. Tanenbaum is chairman of Kilmer Van Nostrand Co., a Toronto-based private equity firm, and is also chairman of Maple Leaf Sports & Entertainment Ltd., owner of the Toronto Maple Leafs and Toronto Raptors sports franchises.
The terminal will become the cornerstone asset in InstarAGF’s infrastructure fund established last year, in part to target infrastructure assets that are too small to get the attention of larger pension funds, Smith said in an interview.
The Globe has some interesting commentary on Canadian corporate issuance:
Canadian corporates have floated just $2.8-billion worth of fixed income securities in Canada this month, compared to $7.4-billion at the same time last year and $11-billion in the same periods in 2013 and 2012, Desjardins says. Meanwhile, there has been an almost 100 per cent jump year-over-year in fixed income issuance by Canadian corporates. So far, the tally is $19.5-billion beyond Canada’s borders – more than three-quarters of that from banks and other financial firms – compared to $10-billion by this point last year, according to Desjardins’ vice president and senior analyst, Jean-Francois Godin. “This is taking a lot of refinancing money out of the [domestic] market,” he said.
There are two reasons for this, according to senior figures in the Canadian bond world. The biggest factor is that Canadian banks have found a huge appetite for their debt internationally, particularly covered bonds, which are triple-A-rated fixed income instruments backed by mortgages. Central banks in Europe apparently can’t get enough of them, particularly as the European Central Bank cranks up its asset-buying machine to bolster the continent’s sluggish economies. In the last 20 days, Bank of Nova Scotia, Bank of Montreal, Canadian Imperial Bank of Commerce and National Bank of Commerce have issued €4.50-billion ($6.3-billion) in covered bonds to banks in Europe, which are drawn to the high ratings and ability to earn a slightly better return compared to European debt securities.
Happy preferred share investors held a meeting today:

It was carnage for the Canadian preferred share market today, with PerpetualDiscounts down 32bp, FixedResets losing 87bp and DeemedRetractibles off 7bp. A very lengthy Performance Highlights table is suitably dominated by losing FixedResets. Volume was high.
For as long as the FixedReset market is so violently unsettled, I’ll keep publishing updates of the more interesting and meaningful series of FixedResets’ Implied Volatilities. This doesn’t include Enbridge because although Enbridge has a large number of issues outstanding, all of which are quite liquid, the range of Issue Reset Spreads is too small for decent conclusions. The low is 212bp (ENB.PR.H; second-lowest is ENB.PR.D at 237bp) and the high is a mere 268 for ENB.PF.G.
Remember that all rich /cheap assessments are:
- based on Implied Volatility Theory only
- are relative only to other FixedResets from the same issuer
- assume constant GOC-5 yield
- assume constant Implied Volatility
- assume constant spread
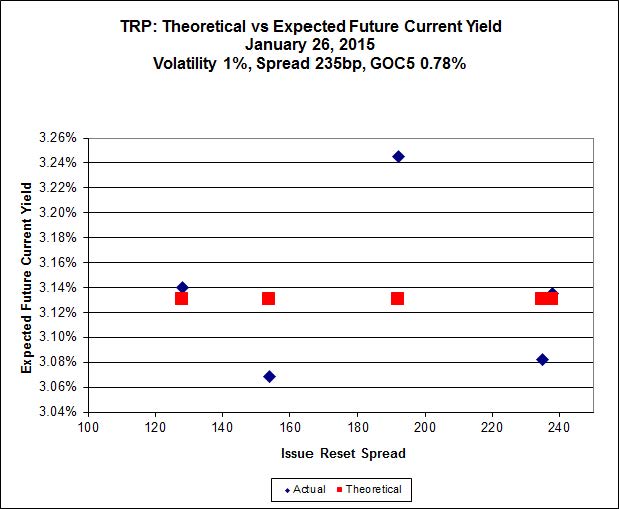
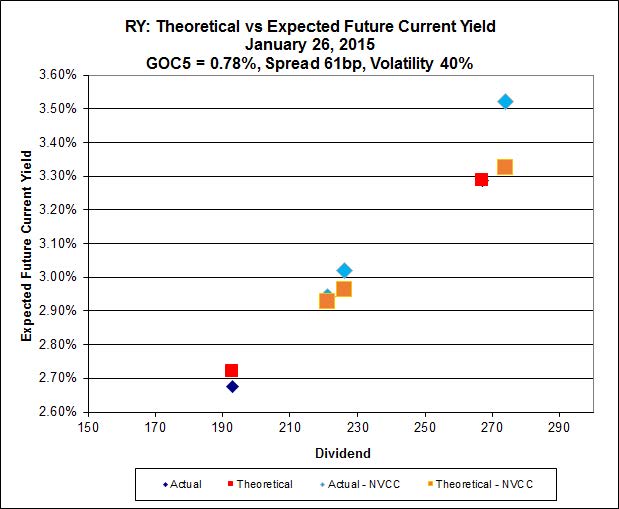
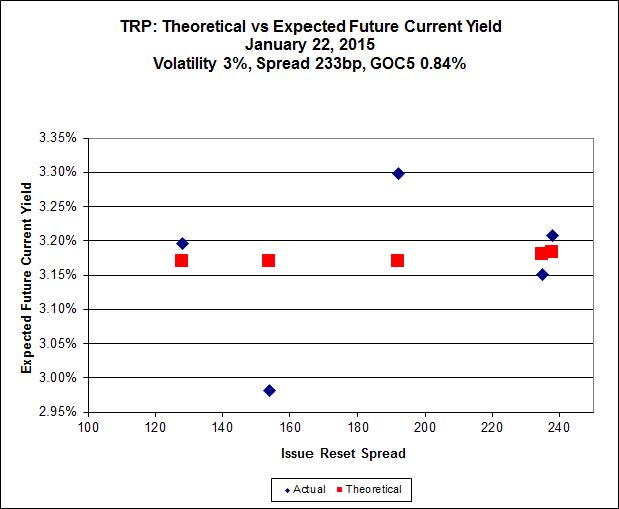
Here’s TRP:
Click for Big
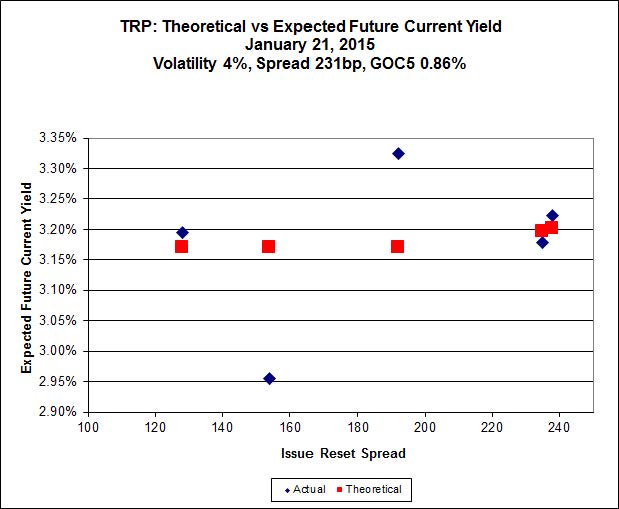
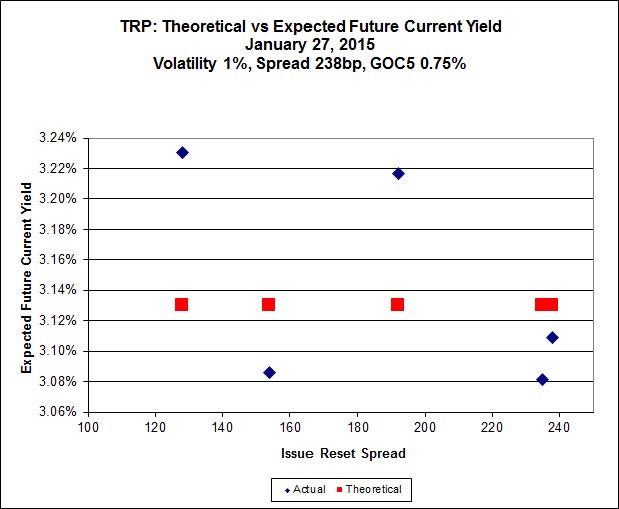
So according to this, TRP.PR.A, bid at 20.75, is $0.58 cheap, and will reset again 2019-12-31 at +192. TRP.PR.E, bid at 25.15 and resetting at +235bp on 2019-10-30 is $0.39 rich. In the interim, TRP.PR.E pays about $0.25 p.a. more than TRP.PR.A, which is not incorporated in the calculation of these numbers. Still, the yield to perpetuity (which does include the different dividends until reset) is 3.44% for TRP.PR.A and 3.22% for TRP.PR.E.
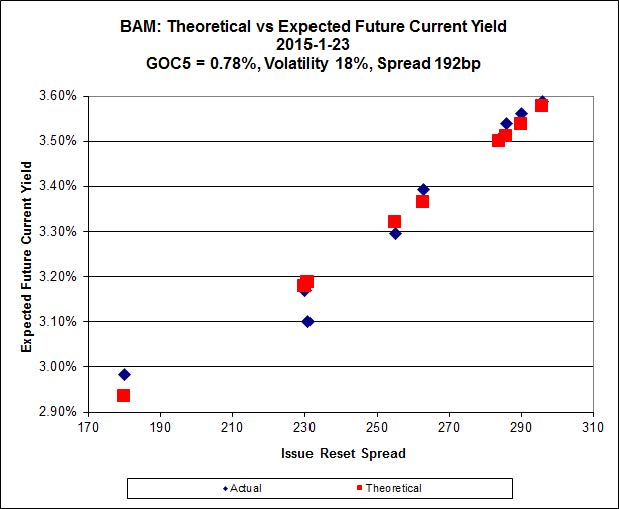
Click for Big
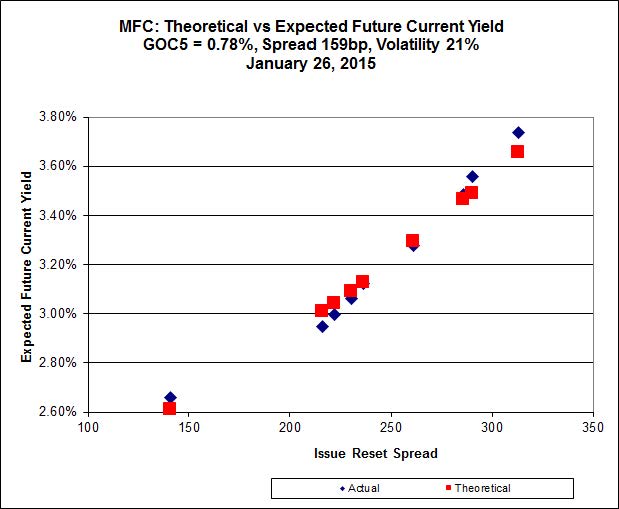
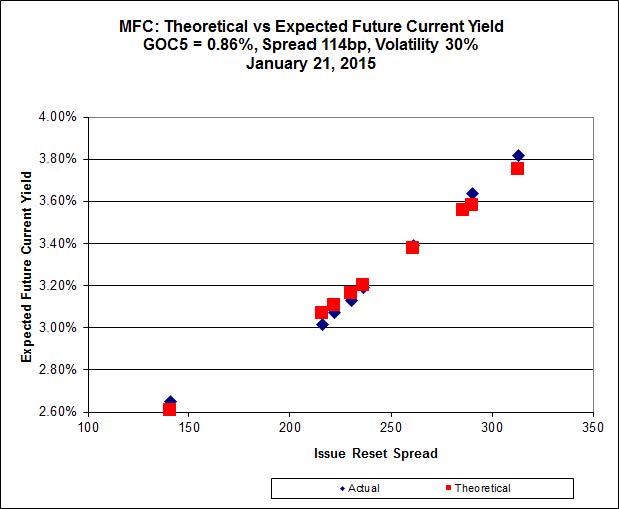
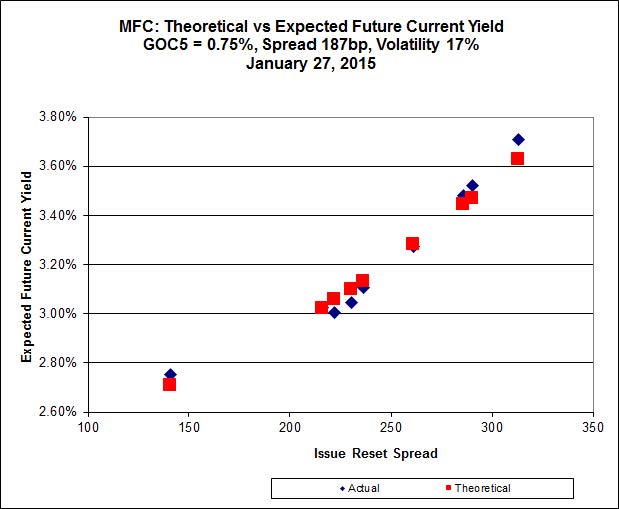
MFC.PR.F continues to be near the line defined by its peers, but underperformed today as Implied Volatility declined.
Implied Volatility for MFC continues to be a conundrum. It is still too high if we consider that NVCC rules will never apply to these issues; it is still too low if we consider them to be NVCC non-compliant issues (and therefore with Deemed Maturities in the call schedule).
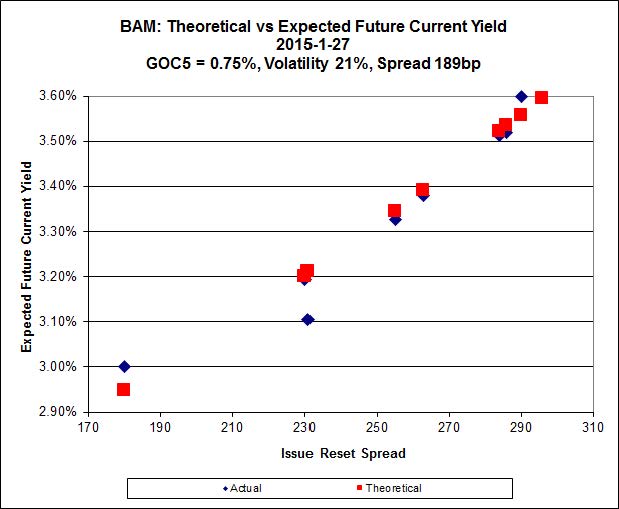
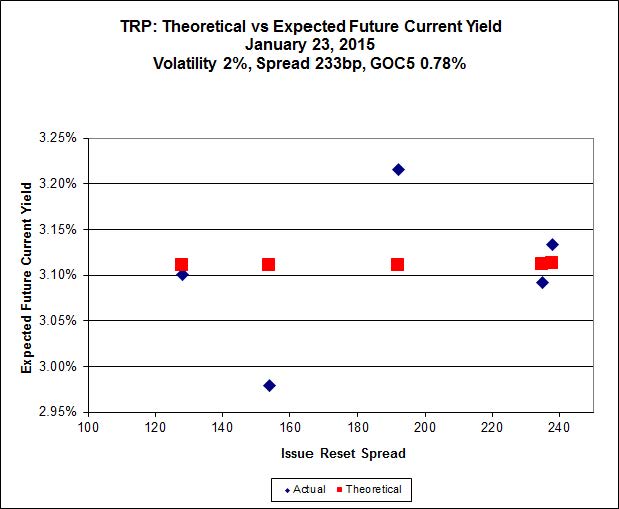
Click for Big
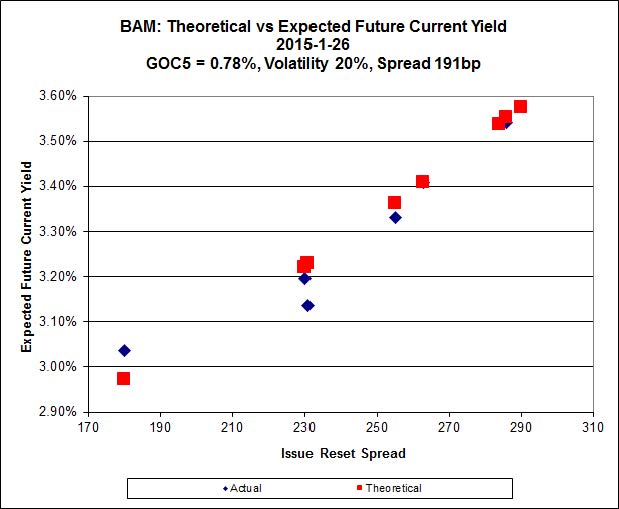
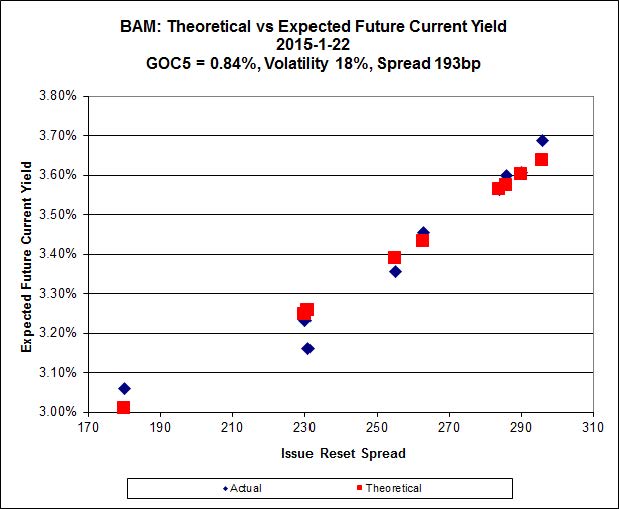
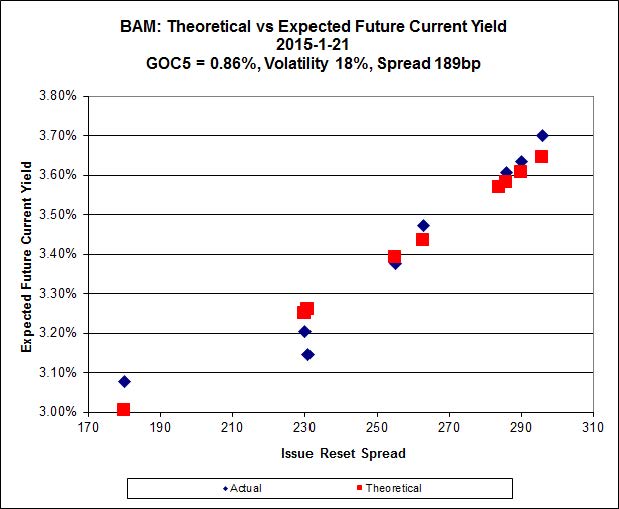
There continues to be cheapness in the lowest-spread issue, BAM.PR.X, resetting at +180bp on 2017-6-30, which is bid at 21.25 and appears to be $0.38 cheap, while BAM.PR.T, resetting at +231bp 2017-3-31 is bid at 24.63 and appears to be $0.80 rich.
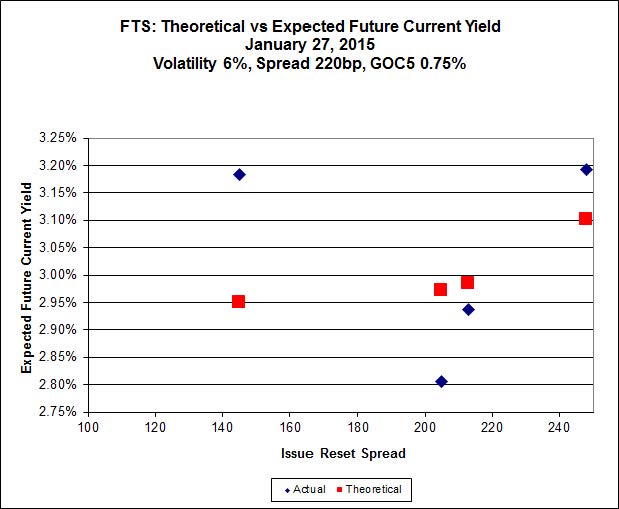
Click for Big
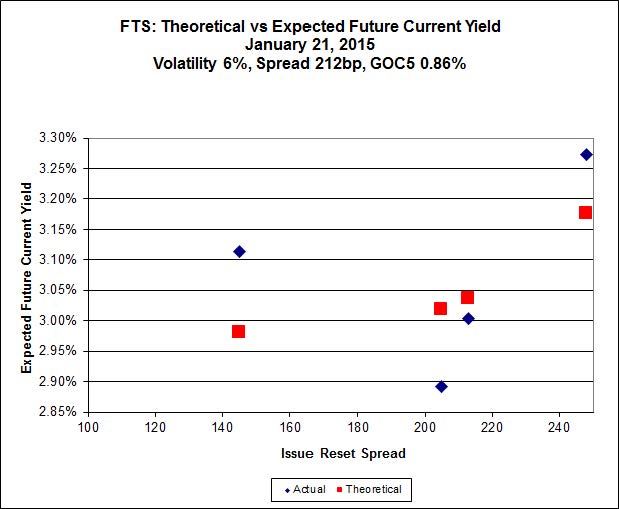
This is just weird because the middle is expensive and the ends are cheap but anyway … FTS.PR.H, with a spread of +145bp, and bid at 17.28 after getting hammered today, looks $1.36 cheap and resets 2015-6-1. FTS.PR.K, with a spread of +205bp, and bid at 24.95, looks $1.39 expensive and resets 2019-3-1.
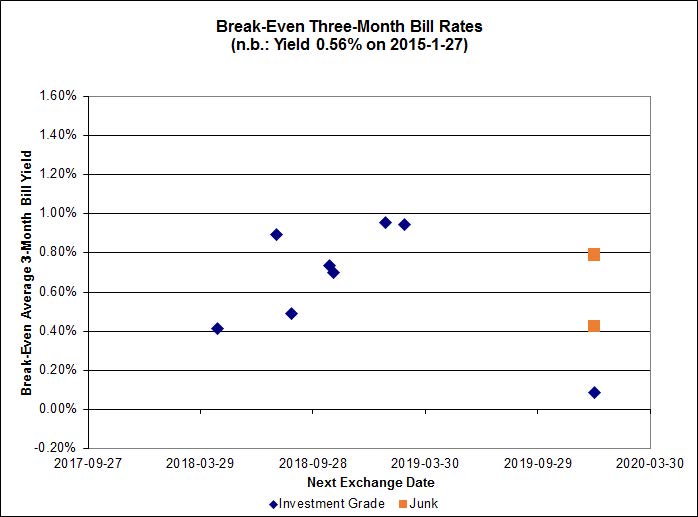
Click for Big
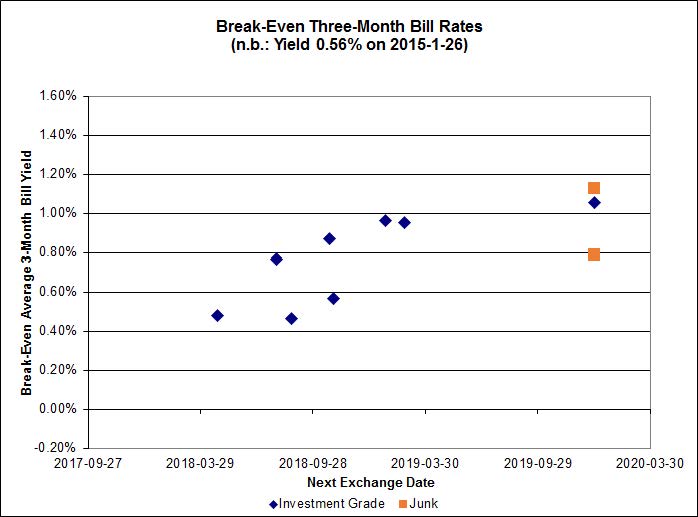
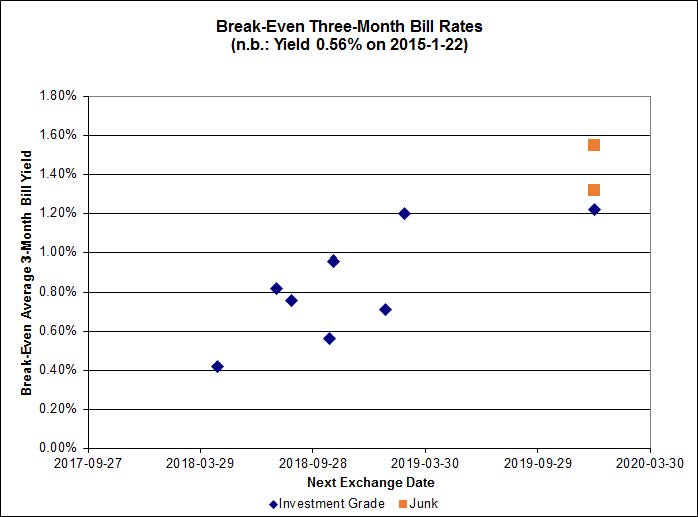
The point representing the DC.PR.B / DC.PR.D pair, interconvertible 2019-9-30, is not shown: it has an implied three-month bill yield of negative 1.56% – rather an extreme view for the market to take!
Pairs equivalence is looking more rational, with the investment grade pairs (which are presumably more closely watched and easier to trade) do show a rising trend with increasing time to interconversio which, qualitatively speaking, is entirely reasonable, although the increase (over five years-odd) looks pretty substantial given the scale of the chart (two years-odd). The average break-even rate is way down from recent levels again today
| HIMIPref™ Preferred Indices These values reflect the December 2008 revision of the HIMIPref™ Indices Values are provisional and are finalized monthly |
|||||||
| Index | Mean Current Yield (at bid) |
Median YTW |
Median Average Trading Value |
Median Mod Dur (YTW) |
Issues | Day’s Perf. | Index Value |
| Ratchet | 0.00 % | 0.00 % | 0 | 0.00 | 0 | -3.6916 % | 2,347.4 |
| FixedFloater | 4.35 % | 3.53 % | 19,899 | 18.39 | 1 | 2.1495 % | 4,067.0 |
| Floater | 3.23 % | 3.29 % | 54,969 | 19.02 | 4 | -3.6916 % | 2,495.5 |
| OpRet | 4.05 % | 2.18 % | 107,126 | 0.39 | 1 | 0.1187 % | 2,748.8 |
| SplitShare | 4.28 % | 4.07 % | 31,080 | 3.59 | 5 | 0.1510 % | 3,189.8 |
| Interest-Bearing | 0.00 % | 0.00 % | 0 | 0.00 | 0 | 0.1187 % | 2,513.5 |
| Perpetual-Premium | 5.43 % | -6.20 % | 54,247 | 0.08 | 19 | -0.1069 % | 2,507.0 |
| Perpetual-Discount | 5.02 % | 4.92 % | 108,601 | 15.33 | 16 | -0.3155 % | 2,759.3 |
| FixedReset | 4.29 % | 3.27 % | 205,621 | 17.30 | 77 | -0.8660 % | 2,493.5 |
| Deemed-Retractible | 4.91 % | -0.04 % | 102,742 | 0.16 | 39 | -0.0676 % | 2,642.4 |
| FloatingReset | 2.46 % | 2.58 % | 67,705 | 6.46 | 7 | -0.8815 % | 2,379.2 |
| Performance Highlights | |||
| Issue | Index | Change | Notes |
| PWF.PR.A | Floater | -10.37 % | Not real. Just another piece of Toronto Stock Exchange idiocy, although I’m not sure whether this one was inadequate market making or dumb reporting. The low for the day was $19.00, but I guess the huge volume of 4,001 shares, of which a whopping 1,283 were traded a mere five minutes prior to the close simply overwhelmed their systems. YTW SCENARIO Maturity Type : Limit Maturity Maturity Date : 2045-01-27 Maturity Price : 17.03 Evaluated at bid price : 17.03 Bid-YTW : 3.07 % |
| FTS.PR.H | FixedReset | -5.16 % | This one actually is real, since the last twenty-five trades of the day (twenty four of which happened after 3:40pm) were all executed at 17.30 and lower. YTW SCENARIO Maturity Type : Limit Maturity Maturity Date : 2045-01-27 Maturity Price : 17.28 Evaluated at bid price : 17.28 Bid-YTW : 3.31 % |
| TRP.PR.F | FloatingReset | -5.12 % | This is real enough, since the last trade of the day was for 1,000 shares at 19.46. All the trading on and after 2:59pm (there wasn’t much of it, but there was some) was executed below 20.00. So say ‘real, but with light volume’. YTW SCENARIO Maturity Type : Limit Maturity Maturity Date : 2045-01-27 Maturity Price : 19.45 Evaluated at bid price : 19.45 Bid-YTW : 3.21 % |
| MFC.PR.F | FixedReset | -4.66 % | YTW SCENARIO Maturity Type : Hard Maturity Maturity Date : 2025-01-31 Maturity Price : 25.00 Evaluated at bid price : 19.62 Bid-YTW : 5.38 % |
| TRP.PR.B | FixedReset | -4.21 % | YTW SCENARIO Maturity Type : Limit Maturity Maturity Date : 2045-01-27 Maturity Price : 15.71 Evaluated at bid price : 15.71 Bid-YTW : 3.35 % |
| IFC.PR.A | FixedReset | -3.53 % | YTW SCENARIO Maturity Type : Hard Maturity Maturity Date : 2025-01-31 Maturity Price : 25.00 Evaluated at bid price : 20.50 Bid-YTW : 5.48 % |
| MFC.PR.L | FixedReset | -3.53 % | YTW SCENARIO Maturity Type : Hard Maturity Maturity Date : 2025-01-31 Maturity Price : 25.00 Evaluated at bid price : 24.06 Bid-YTW : 3.92 % |
| GWO.PR.N | FixedReset | -3.31 % | YTW SCENARIO Maturity Type : Hard Maturity Maturity Date : 2025-01-31 Maturity Price : 25.00 Evaluated at bid price : 19.01 Bid-YTW : 5.40 % |
| SLF.PR.G | FixedReset | -3.14 % | YTW SCENARIO Maturity Type : Hard Maturity Maturity Date : 2025-01-31 Maturity Price : 25.00 Evaluated at bid price : 18.50 Bid-YTW : 5.77 % |
| ENB.PR.Y | FixedReset | -2.58 % | YTW SCENARIO Maturity Type : Limit Maturity Maturity Date : 2045-01-27 Maturity Price : 21.55 Evaluated at bid price : 21.55 Bid-YTW : 3.95 % |
| HSE.PR.A | FixedReset | -2.50 % | YTW SCENARIO Maturity Type : Limit Maturity Maturity Date : 2045-01-27 Maturity Price : 19.50 Evaluated at bid price : 19.50 Bid-YTW : 3.38 % |
| ENB.PR.B | FixedReset | -2.45 % | YTW SCENARIO Maturity Type : Limit Maturity Maturity Date : 2045-01-27 Maturity Price : 21.26 Evaluated at bid price : 21.54 Bid-YTW : 3.84 % |
| NA.PR.S | FixedReset | -1.88 % | YTW SCENARIO Maturity Type : Limit Maturity Maturity Date : 2045-01-27 Maturity Price : 23.26 Evaluated at bid price : 25.12 Bid-YTW : 3.20 % |
| TRP.PR.C | FixedReset | -1.85 % | YTW SCENARIO Maturity Type : Limit Maturity Maturity Date : 2045-01-27 Maturity Price : 18.55 Evaluated at bid price : 18.55 Bid-YTW : 3.26 % |
| BAM.PR.K | Floater | -1.67 % | YTW SCENARIO Maturity Type : Limit Maturity Maturity Date : 2045-01-27 Maturity Price : 15.93 Evaluated at bid price : 15.93 Bid-YTW : 3.32 % |
| FTS.PR.G | FixedReset | -1.57 % | YTW SCENARIO Maturity Type : Limit Maturity Maturity Date : 2045-01-27 Maturity Price : 23.11 Evaluated at bid price : 24.51 Bid-YTW : 3.06 % |
| BAM.PR.C | Floater | -1.55 % | YTW SCENARIO Maturity Type : Limit Maturity Maturity Date : 2045-01-27 Maturity Price : 15.92 Evaluated at bid price : 15.92 Bid-YTW : 3.32 % |
| BAM.PR.N | Perpetual-Discount | -1.50 % | YTW SCENARIO Maturity Type : Limit Maturity Maturity Date : 2045-01-27 Maturity Price : 22.66 Evaluated at bid price : 22.93 Bid-YTW : 5.22 % |
| PWF.PR.P | FixedReset | -1.43 % | YTW SCENARIO Maturity Type : Limit Maturity Maturity Date : 2045-01-27 Maturity Price : 20.71 Evaluated at bid price : 20.71 Bid-YTW : 2.99 % |
| CU.PR.E | Perpetual-Discount | -1.37 % | YTW SCENARIO Maturity Type : Limit Maturity Maturity Date : 2045-01-27 Maturity Price : 24.71 Evaluated at bid price : 25.15 Bid-YTW : 4.92 % |
| SLF.PR.I | FixedReset | -1.35 % | YTW SCENARIO Maturity Type : Call Maturity Date : 2016-12-31 Maturity Price : 25.00 Evaluated at bid price : 25.65 Bid-YTW : 3.03 % |
| BNS.PR.Y | FixedReset | -1.32 % | YTW SCENARIO Maturity Type : Hard Maturity Maturity Date : 2022-01-31 Maturity Price : 25.00 Evaluated at bid price : 22.50 Bid-YTW : 3.47 % |
| MFC.PR.B | Deemed-Retractible | -1.22 % | YTW SCENARIO Maturity Type : Hard Maturity Maturity Date : 2025-01-31 Maturity Price : 25.00 Evaluated at bid price : 24.34 Bid-YTW : 5.08 % |
| MFC.PR.K | FixedReset | -1.20 % | YTW SCENARIO Maturity Type : Hard Maturity Maturity Date : 2025-01-31 Maturity Price : 25.00 Evaluated at bid price : 24.72 Bid-YTW : 3.51 % |
| ENB.PR.F | FixedReset | -1.19 % | YTW SCENARIO Maturity Type : Limit Maturity Maturity Date : 2045-01-27 Maturity Price : 22.03 Evaluated at bid price : 22.43 Bid-YTW : 3.82 % |
| SLF.PR.B | Deemed-Retractible | -1.14 % | YTW SCENARIO Maturity Type : Hard Maturity Maturity Date : 2025-01-31 Maturity Price : 25.00 Evaluated at bid price : 25.05 Bid-YTW : 4.85 % |
| HSE.PR.C | FixedReset | -1.08 % | YTW SCENARIO Maturity Type : Limit Maturity Maturity Date : 2045-01-27 Maturity Price : 23.08 Evaluated at bid price : 24.75 Bid-YTW : 4.03 % |
| BAM.PF.D | Perpetual-Discount | -1.06 % | YTW SCENARIO Maturity Type : Limit Maturity Maturity Date : 2045-01-27 Maturity Price : 23.00 Evaluated at bid price : 23.30 Bid-YTW : 5.30 % |
| ENB.PR.D | FixedReset | -1.03 % | YTW SCENARIO Maturity Type : Limit Maturity Maturity Date : 2045-01-27 Maturity Price : 21.80 Evaluated at bid price : 22.08 Bid-YTW : 3.75 % |
| BAM.PF.C | Perpetual-Discount | -1.03 % | YTW SCENARIO Maturity Type : Limit Maturity Maturity Date : 2045-01-27 Maturity Price : 22.81 Evaluated at bid price : 23.11 Bid-YTW : 5.29 % |
| SLF.PR.A | Deemed-Retractible | -1.03 % | YTW SCENARIO Maturity Type : Hard Maturity Maturity Date : 2025-01-31 Maturity Price : 25.00 Evaluated at bid price : 25.05 Bid-YTW : 4.80 % |
| BMO.PR.Q | FixedReset | -1.01 % | YTW SCENARIO Maturity Type : Hard Maturity Maturity Date : 2022-01-31 Maturity Price : 25.00 Evaluated at bid price : 23.62 Bid-YTW : 3.39 % |
| PWF.PR.S | Perpetual-Discount | 1.01 % | YTW SCENARIO Maturity Type : Limit Maturity Maturity Date : 2045-01-27 Maturity Price : 24.53 Evaluated at bid price : 24.95 Bid-YTW : 4.81 % |
| BNS.PR.Z | FixedReset | 1.39 % | YTW SCENARIO Maturity Type : Hard Maturity Maturity Date : 2022-01-31 Maturity Price : 25.00 Evaluated at bid price : 23.35 Bid-YTW : 3.43 % |
| GWO.PR.P | Deemed-Retractible | 1.45 % | YTW SCENARIO Maturity Type : Call Maturity Date : 2021-03-31 Maturity Price : 25.00 Evaluated at bid price : 26.53 Bid-YTW : 4.36 % |
| BAM.PR.G | FixedFloater | 2.15 % | YTW SCENARIO Maturity Type : Limit Maturity Maturity Date : 2045-01-27 Maturity Price : 21.97 Evaluated at bid price : 21.86 Bid-YTW : 3.53 % |
| Volume Highlights | |||
| Issue | Index | Shares Traded |
Notes |
| BMO.PR.P | FixedReset | 780,900 | Called for redemption effective February 25. YTW SCENARIO Maturity Type : Call Maturity Date : 2015-03-27 Maturity Price : 25.00 Evaluated at bid price : 25.31 Bid-YTW : 0.01 % |
| TD.PR.P | Deemed-Retractible | 126,255 | Called for redemption effective March 2. YTW SCENARIO Maturity Type : Call Maturity Date : 2015-02-26 Maturity Price : 25.50 Evaluated at bid price : 25.57 Bid-YTW : 0.95 % |
| TD.PR.Q | Deemed-Retractible | 123,270 | Called for redemption effective March 2. YTW SCENARIO Maturity Type : Call Maturity Date : 2015-03-02 Maturity Price : 25.50 Evaluated at bid price : 25.59 Bid-YTW : 0.89 % |
| MFC.PR.N | FixedReset | 90,629 | Scotia crossed 30,100 at 25.24. YTW SCENARIO Maturity Type : Hard Maturity Maturity Date : 2025-01-31 Maturity Price : 25.00 Evaluated at bid price : 25.04 Bid-YTW : 3.53 % |
| MFC.PR.M | FixedReset | 75,750 | RBC crossed 50,000 at 25.04. YTW SCENARIO Maturity Type : Hard Maturity Maturity Date : 2025-01-31 Maturity Price : 25.00 Evaluated at bid price : 25.02 Bid-YTW : 3.59 % |
| TD.PF.C | FixedReset | 70,655 | YTW SCENARIO Maturity Type : Limit Maturity Maturity Date : 2045-01-27 Maturity Price : 23.13 Evaluated at bid price : 24.90 Bid-YTW : 3.11 % |
| There were 47 other index-included issues trading in excess of 10,000 shares. | |||
| Wide Spread Highlights | ||
| Issue | Index | Quote Data and Yield Notes |
| PWF.PR.A | Floater | Quote: 17.03 – 19.00 Spot Rate : 1.9700 Average : 1.2487 YTW SCENARIO |
| TRP.PR.F | FloatingReset | Quote: 19.45 – 20.50 Spot Rate : 1.0500 Average : 0.6158 YTW SCENARIO |
| MFC.PR.L | FixedReset | Quote: 24.06 – 25.06 Spot Rate : 1.0000 Average : 0.6023 YTW SCENARIO |
| MFC.PR.F | FixedReset | Quote: 19.62 – 20.30 Spot Rate : 0.6800 Average : 0.4132 YTW SCENARIO |
| FTS.PR.H | FixedReset | Quote: 17.28 – 17.90 Spot Rate : 0.6200 Average : 0.3759 YTW SCENARIO |
| HSE.PR.A | FixedReset | Quote: 19.50 – 20.05 Spot Rate : 0.5500 Average : 0.3484 YTW SCENARIO |