Archive for December, 2009

BPO: Issuer Bid for Retractibles?

Tuesday, December 8th, 2009

Brookfield Properties has announced:

that the Toronto Stock Exchange accepted a notice filed by Brookfield Properties of its intention to make a normal course issuer bid for its class AAA preference shares, series F (“Series F Shares”), series G (“Series G Shares”), series H (“Series H Shares”), series I (“Series I Shares”), series J (“Series J Shares”) and series K (“Series K Shares”). Brookfield Properties stated that at times its class AAA preference shares trade in price ranges that do not fully reflect their value. As a result, from time to time, acquiring class AAA preference shares will represent an attractive and a desirable use of available funds.
The notice provides that Brookfield Properties may, during the twelve month period commencing December 11, 2009 and ending December 10, 2010, purchase on the Toronto Stock Exchange up to 400,000 Series F Shares, 220,000 Series G Shares, 400,000 Series H Shares, 400,000 Series I Shares, 400,000 Series J Shares and 300,000 Series K Shares, each representing approximately 5% of the issued and outstanding of the relevant series of class AAA preference shares. At December 3, 2009, there were 8,000,000 Series F Shares, 4,400,000 Series G Shares, 8,000,000 Series H Shares, 8,000,000 Series I Shares, 8,000,000 Series J Shares and 6,000,000 Series K Shares issued and outstanding. Under the normal course issuer bid, Brookfield Properties may purchase up to 2,652 Series F Shares, 1,000 Series G Shares, 2,614 Series H Shares, 4,439 Series I Shares, 2,026 Series J Shares, and 1,550 Series K Shares on the Toronto Stock Exchange during any trading day, each of which represents 25% of the average daily trading volume on the Toronto Stock Exchange for the most recently completed six calendar months prior to the Toronto Stock Exchange’s acceptance of the notice of the normal course issuer bid. This limitation does not apply to purchases made pursuant to block purchase exemptions.

The price to be paid for the class AAA preference shares under the normal course issuer bid will be the market price at the time of purchase. The actual number of class AAA preference shares to be purchased and the timing of such purchases will be determined by Brookfield Properties, and all class AAA preference shares will be purchased on the open market or such other means as approved by the Toronto Stock Exchange. All class AAA preference shares purchased by Brookfield Properties under this bid will be promptly cancelled.

The average daily trading volumes of the class AAA preference shares on the Toronto Stock Exchange during the six months ended November, 2009 was 10,606 with respect to the Series F Shares, 3,636 with respect to the Series G Shares, 10,454 with respect to the Series H Shares, 17,755 with respect to the Series I Shares, 8,103 with respect to the Series J Shares, and 6,199 with respect to the Series K Shares.

There is no mention of a preferred share NCIB in the 2008 Annual Report (although there is a significant common share NCIB), so this announcement is not something I would normally report. In this case, however, I was specifically asked about it by Assiduous Reader MP and there are some other things that give credence to the idea … like, f’rinstance, relative yields:

BPO Issues
Ticker Retraction YTW
BPO.PR.F 2013-3-31 6.35%
BPO.PR.H 2015-12-31 7.52%
BPO.PR.I 2011-1-1 4.65%
BPO.PR.J 2014-12-31 7.11%
BPO.PR.K 2016-12-31 7.58%
BPO.PR.L Never. Resets 2014-9-30 6.29% (to presumed call on reset date)

BPO.PR.L, the FixedReset, has been insanely expensive since its opening date, yielding less, with a lower chance of 5-year maturity, than the retractible.

Even that might not have been enough for me to take this bid seriously … but there is also the recent YPG FixedReset 6.90%+426 issue to consider. This, the second YPG FixedReset, has just been announced and YPG.PR.B, retractible 2017-6-30 and the target of a real issuer bid continues to trade with a double digit yield. Such is the allure of FixedResets!

A FixedReset issue, being perpetual, will appear in the equity section of the balance sheet (retractibles are considered liabilities for balance sheet purposes) improving credit ratios; additionally, credit rating agencies will assign a greater equity equivalency factor to perpetuals. In terms of lowering the cost of bond issues, refinancing retractibles with FixedResets makes all kinds of sense.

No predictions! But it will be interesting to see how this turns out.
IGM.PR.B Opening Day Limp and Lifeless

Tuesday, December 8th, 2009

Investors’ Group has announced:

the successful completion and closing of an offering of 5.90% Non-Cumulative First Preferred Shares, Series B (the “Series B Shares”), priced at $25.00 per share to raise gross proceeds of $150 million.

The issue was bought by an underwriting group co-led by BMO Capital Markets and by RBC Capital Markets.

The Series B Shares will be listed and posted for trading on the Toronto Stock Exchange under the symbol “IGM.PR.B”. Proceeds from the issue will be used to supplement IGM Financial’s financial resources and for general corporate purposes.

Vital statistics are:

IGM.PR.B Perpetual-Discount YTW SCENARIO
Maturity Type : Limit Maturity
Maturity Date : 2039-12-08
Maturity Price : 24.30
Evaluated at bid price : 24.50
Bid-YTW : 6.06 %

It still looks expensive to me! The issue was announced on November 30.

IGM.PR.B will be tracked by HIMIPref™. It has been assigned to the PerpetualDiscount index.

December 8, 2009

Tuesday, December 8th, 2009

CIT Group will shortly be exiting bankruptcy:

CIT Group Inc., the 101-year-old commercial lender, won court approval of a plan to cancel old shares, shed debt and exit bankruptcy court protection with new stock worth as much $11 billion.

U.S. Bankruptcy Judge Allan Gropper in New York today confirmed CIT’s so-called prepackaged Chapter 11 reorganization plan, which already had creditor support when CIT filed for bankruptcy last month. The U.S. won’t recover much, if any of the $2.3 billion in taxpayer money used in a bailout of CIT, and shareholders will be wiped out.

“I recognize, literally, billions of debt have agreed to this plan,” Gropper said, adding that the plan could take effect on Dec. 10. “It’s an enormous achievement to have gotten the vote that you’ve gotten.”

I missed this when it came out, but here’s the latest in the David Berry saga:

On March 7, 2008, Berry commenced this application (the “Application”) pursuant to section 21.7 of the Securities Act, R.S.O. 1990, c. S.5, as amended (the “Act”) for a hearing and review of the RS Stay Decision by the Ontario Securities Commission (the “Commission”). He submits that the RS Panel erred in refusing to stay the RS Proceeding and asks the Commission to set aside the RS Stay Decision and permanently stay the RS Proceeding.

[5] For the reasons set out below, we dismiss this Application. We conclude that UMIR are rules of RS and are applicable to and enforceable against Participants and other persons within the jurisdiction of the TSX.

A downdraft hit the preferred market today, with PerpetualDiscounts giving up 10bp (a portion of which is due to the lousy opening of IGM.PR.B) and FixedResets a hair on the wrong side of flat, losing under 1bp. Volume was normal.

HIMIPref™ Preferred Indices
These values reflect the December 2008 revision of the HIMIPref™ Indices

Values are provisional and are finalized monthly
Index Mean
Current
Yield
(at bid)
Median
YTW
Median
Average
Trading
Value
Median
Mod Dur
(YTW)
Issues Day’s Perf. Index Value
Ratchet 0.00 % 0.00 % 0 0.00 0 0.9871 % 1,519.3
FixedFloater 6.04 % 4.16 % 36,838 18.59 1 0.0000 % 2,578.8
Floater 2.57 % 3.04 % 98,334 19.55 3 0.9871 % 1,898.0
OpRet 4.86 % -4.19 % 147,267 0.08 15 0.1149 % 2,309.5
SplitShare 6.42 % -3.51 % 262,437 0.08 2 -0.7031 % 2,093.5
Interest-Bearing 0.00 % 0.00 % 0 0.00 0 0.1149 % 2,111.9
Perpetual-Premium 5.88 % 5.81 % 61,359 6.00 7 0.0285 % 1,875.1
Perpetual-Discount 5.82 % 5.87 % 184,633 14.05 68 -0.1020 % 1,786.3
FixedReset 5.42 % 3.75 % 366,072 3.90 41 -0.0080 % 2,155.5
Performance Highlights
Issue Index Change Notes
GWO.PR.I Perpetual-Discount -1.32 % YTW SCENARIO
Maturity Type : Limit Maturity
Maturity Date : 2039-12-08
Maturity Price : 18.73
Evaluated at bid price : 18.73
Bid-YTW : 6.03 %
BNA.PR.C SplitShare -1.30 % YTW SCENARIO
Maturity Type : Hard Maturity
Maturity Date : 2019-01-10
Maturity Price : 25.00
Evaluated at bid price : 18.96
Bid-YTW : 8.22 %
GWO.PR.F Perpetual-Premium -1.06 % YTW SCENARIO
Maturity Type : Limit Maturity
Maturity Date : 2039-12-08
Maturity Price : 23.99
Evaluated at bid price : 24.30
Bid-YTW : 6.07 %
PWF.PR.G Perpetual-Premium 1.00 % YTW SCENARIO
Maturity Type : Limit Maturity
Maturity Date : 2039-12-08
Maturity Price : 24.76
Evaluated at bid price : 25.15
Bid-YTW : 5.93 %
BAM.PR.J OpRet 1.10 % YTW SCENARIO
Maturity Type : Soft Maturity
Maturity Date : 2018-03-30
Maturity Price : 25.00
Evaluated at bid price : 26.70
Bid-YTW : 4.58 %
CM.PR.R OpRet 1.20 % YTW SCENARIO
Maturity Type : Call
Maturity Date : 2010-01-07
Maturity Price : 25.60
Evaluated at bid price : 26.25
Bid-YTW : -18.68 %
TRI.PR.B Floater 1.27 % YTW SCENARIO
Maturity Type : Limit Maturity
Maturity Date : 2039-12-08
Maturity Price : 20.00
Evaluated at bid price : 20.00
Bid-YTW : 1.98 %
BAM.PR.K Floater 1.41 % YTW SCENARIO
Maturity Type : Limit Maturity
Maturity Date : 2039-12-08
Maturity Price : 12.96
Evaluated at bid price : 12.96
Bid-YTW : 3.07 %
Volume Highlights
Issue Index Shares
Traded
Notes
GWO.PR.J FixedReset 249,515 TD crossed 28,700 at 27.10; National crossed 50,000 at 27.10; Nesbitt crossed 100,000 at 27.10; and finally National crossed 24,700 at 27.04.
YTW SCENARIO
Maturity Type : Call
Maturity Date : 2014-01-30
Maturity Price : 25.00
Evaluated at bid price : 27.04
Bid-YTW : 3.75 %
MFC.PR.D FixedReset 122,060 National bought 48,200 from anonymous at 27.90; then crossed 50,000 at 27.94.
YTW SCENARIO
Maturity Type : Call
Maturity Date : 2014-07-19
Maturity Price : 25.00
Evaluated at bid price : 27.85
Bid-YTW : 3.88 %
IGM.PR.B Perpetual-Discount 48,726 New issue settled today.
YTW SCENARIO
Maturity Type : Limit Maturity
Maturity Date : 2039-12-08
Maturity Price : 24.30
Evaluated at bid price : 24.50
Bid-YTW : 6.06 %
RY.PR.I FixedReset 47,775 RBC crossed 40,000 at 26.30.
YTW SCENARIO
Maturity Type : Call
Maturity Date : 2014-03-26
Maturity Price : 25.00
Evaluated at bid price : 26.31
Bid-YTW : 3.70 %
TRP.PR.A FixedReset 46,390 YTW SCENARIO
Maturity Type : Call
Maturity Date : 2015-01-30
Maturity Price : 25.00
Evaluated at bid price : 25.90
Bid-YTW : 3.77 %
BAM.PR.N Perpetual-Discount 34,002 RBC crossed 15,400 at 17.72.
YTW SCENARIO
Maturity Type : Limit Maturity
Maturity Date : 2039-12-08
Maturity Price : 17.71
Evaluated at bid price : 17.71
Bid-YTW : 6.86 %
There were 36 other index-included issues trading in excess of 10,000 shares.

December 7, 2009

Monday, December 7th, 2009

Bob Eisenbeis, Chief Monetary Economist at Cumberland Advisors, has posted a good commentary on Contingent Capital.

It was a mixed day for preferred shares, with PerpetualDiscounts down 10bp and FixedResets up 11bp – which took the weighted median yield-to-worst of the latter class down to 3.75%. How low can it go? The five lowest yields recorded on the FixedReset index have been observed on the last five trading days. Volume returned to normal levels.

HIMIPref™ Preferred Indices
These values reflect the December 2008 revision of the HIMIPref™ Indices

Values are provisional and are finalized monthly
Index Mean
Current
Yield
(at bid)
Median
YTW
Median
Average
Trading
Value
Median
Mod Dur
(YTW)
Issues Day’s Perf. Index Value
Ratchet 0.00 % 0.00 % 0 0.00 0 0.1538 % 1,504.4
FixedFloater 6.04 % 4.16 % 37,390 18.59 1 0.1669 % 2,578.8
Floater 2.59 % 3.04 % 97,849 19.55 3 0.1538 % 1,879.5
OpRet 4.87 % -3.81 % 140,288 0.08 15 -0.1555 % 2,306.9
SplitShare 6.37 % -6.89 % 271,118 0.08 2 -0.3067 % 2,108.3
Interest-Bearing 0.00 % 0.00 % 0 0.00 0 -0.1555 % 2,109.4
Perpetual-Premium 5.88 % 5.83 % 60,931 6.00 7 -0.3065 % 1,874.6
Perpetual-Discount 5.81 % 5.88 % 184,910 14.03 67 -0.1012 % 1,788.1
FixedReset 5.42 % 3.75 % 366,983 3.90 41 0.1056 % 2,155.6
Performance Highlights
Issue Index Change Notes
BMO.PR.H Perpetual-Discount -1.68 % YTW SCENARIO
Maturity Type : Limit Maturity
Maturity Date : 2039-12-07
Maturity Price : 22.61
Evaluated at bid price : 23.36
Bid-YTW : 5.68 %
BAM.PR.J OpRet -1.46 % YTW SCENARIO
Maturity Type : Soft Maturity
Maturity Date : 2018-03-30
Maturity Price : 25.00
Evaluated at bid price : 26.41
Bid-YTW : 4.75 %
MFC.PR.B Perpetual-Discount -1.37 % YTW SCENARIO
Maturity Type : Limit Maturity
Maturity Date : 2039-12-07
Maturity Price : 19.40
Evaluated at bid price : 19.40
Bid-YTW : 6.02 %
CM.PR.R OpRet -1.37 % YTW SCENARIO
Maturity Type : Call
Maturity Date : 2010-01-06
Maturity Price : 25.60
Evaluated at bid price : 25.94
Bid-YTW : -5.24 %
GWO.PR.I Perpetual-Discount -1.15 % YTW SCENARIO
Maturity Type : Limit Maturity
Maturity Date : 2039-12-07
Maturity Price : 18.98
Evaluated at bid price : 18.98
Bid-YTW : 5.94 %
BMO.PR.K Perpetual-Discount -1.01 % YTW SCENARIO
Maturity Type : Limit Maturity
Maturity Date : 2039-12-07
Maturity Price : 23.33
Evaluated at bid price : 23.51
Bid-YTW : 5.62 %
PWF.PR.K Perpetual-Discount 1.01 % YTW SCENARIO
Maturity Type : Limit Maturity
Maturity Date : 2039-12-07
Maturity Price : 21.07
Evaluated at bid price : 21.07
Bid-YTW : 5.96 %
HSB.PR.D Perpetual-Discount 1.27 % YTW SCENARIO
Maturity Type : Limit Maturity
Maturity Date : 2039-12-07
Maturity Price : 22.21
Evaluated at bid price : 22.35
Bid-YTW : 5.70 %
Volume Highlights
Issue Index Shares
Traded
Notes
PWF.PR.M FixedReset 212,750 National Bank crossed two blocks at 27.25, of 200,000 and 10,000 shares.
YTW SCENARIO
Maturity Type : Call
Maturity Date : 2014-03-02
Maturity Price : 25.00
Evaluated at bid price : 27.18
Bid-YTW : 3.90 %
SLF.PR.B Perpetual-Discount 79,596 RBC crossed 60,000 at 20.10.
YTW SCENARIO
Maturity Type : Limit Maturity
Maturity Date : 2039-12-07
Maturity Price : 20.02
Evaluated at bid price : 20.02
Bid-YTW : 6.01 %
TRI.PR.B Floater 75,000 RBC crossed two blocks at 19.75, of 50,000 and 25,000 shares.
YTW SCENARIO
Maturity Type : Limit Maturity
Maturity Date : 2039-12-07
Maturity Price : 19.75
Evaluated at bid price : 19.75
Bid-YTW : 2.01 %
TRP.PR.A FixedReset 73,585 Scotia crossed 50,000 at 25.85.
YTW SCENARIO
Maturity Type : Call
Maturity Date : 2015-01-30
Maturity Price : 25.00
Evaluated at bid price : 25.86
Bid-YTW : 3.80 %
SLF.PR.D Perpetual-Discount 62,748 RBC crossed 60,000 at 18.75.
YTW SCENARIO
Maturity Type : Limit Maturity
Maturity Date : 2039-12-07
Maturity Price : 18.71
Evaluated at bid price : 18.71
Bid-YTW : 5.96 %
BAM.PR.B Floater 56,648 RBC crossed 50,000 at 13.06.
YTW SCENARIO
Maturity Type : Limit Maturity
Maturity Date : 2039-12-07
Maturity Price : 13.06
Evaluated at bid price : 13.06
Bid-YTW : 3.04 %
There were 36 other index-included issues trading in excess of 10,000 shares.

New Issue: YPG FixedReset 6.90%+426

Monday, December 7th, 2009

Yellow Pages Income Fund has announced:

that its subsidiary, YPG Holdings Inc. (the “Issuer”), will be issuing 5,000,000 cumulative rate reset preferred shares, series 5 (the “Series 5 Preferred Shares”) for aggregate gross proceeds of $125 million on a bought deal basis to a syndicate of underwriters led by BMO Nesbitt Burns Inc., CIBC World Markets Inc., RBC Dominion Securities Inc. and Scotia Capital Inc., acting as joint book-runners. The Series 5 Preferred Shares will pay cumulative dividends of $1.7250 per share per annum, yielding 6.90% per annum, payable quarterly, for the initial five and one-half year period ending June 30, 2015. The dividend rate will be reset on June 30, 2015 and every five years thereafter at a rate equal to the 5-year Government of Canada bond yield plus 4.26 %. The Series 5 Preferred Shares will be redeemable by the Issuer on or after June 30, 2015, in accordance with their terms.

Holders of the Series 5 Preferred Shares will have the right, at their option, to convert their shares into cumulative floating rate preferred shares, series 6, (the “Series 6 Preferred Shares”) subject to certain conditions, on June 30, 2015 and on June 30 every five years thereafter. Holders of the Series 6 Preferred Shares will be entitled to receive cumulative quarterly floating dividends at a rate equal to the three-month Government of Canada Treasury Bill yield plus 4.26 %.

The Issuer has also granted the underwriters the option to purchase up to 750,000 additional Series 5 Preferred Shares to cover over-allotments, exercisable in whole or in part anytime up to 30 days following closing of the offering.

Net proceeds resulting from the sale of the Series 5 Preferred Shares of the Issuer shall be used by the Issuer to repay indebtedness, and for general corporate purposes.

The first dividend is payable on March 29, 2010 for $0.45842, assuming a closing date of 2009-12-22.

BIS Publishes 4Q09 Quarterly Review

Sunday, December 6th, 2009

The Bank for International Settlements has released its December 2009 Quarterly Review with:

  • A review of current conditions
  • Macro stress tests and crises: what can we learn?
  • Monetary policy and the risk-taking channel
  • Government size and macroeconomic stability
  • Issues and developments in loan loss provisioning: the case of Asia
  • Dollar appreciation in 2008: safe haven, carry trades, dollar shortage and overhedging

The review contained the following snippet of interest:

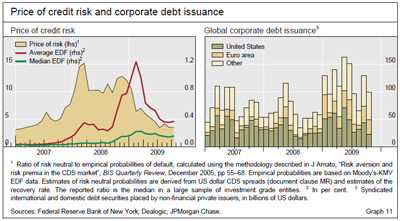
the market-implied price of credit risk also continued its downward trend, but to its pre-crisis level (Graph 11, left-hand panel).

The return to more normal credit market conditions was also reflected in corporate bond issuance (Graph 11, right-hand panel, and Highlights section).


Click for big

The methodology used to prepare the chart of market implied cost of risk has been summarized on PrefBlog.

The paper by Leonardo Gambacorta, Monetary policy and the risk-taking channel, has been highlighted by Bloomberg and makes the claim that ‘reaching for yield’ is not merely a retail problem:

This paper investigates the link between low interest rates and bank risk-taking. Monetary policy may influence banks’ perceptions of, and attitude towards, risk in at least two ways: (i) through a search for yield process, especially in the case of nominal return targets; and (ii) by means of the impact of interest rates on valuations, incomes and cash flows, which in turn can modify how banks measure risk. Using a comprehensive dataset of listed banks, this paper finds that low interest rates over an extended period cause an increase in banks’ risk-taking.

For instance:

The inertia in nominal targets at a time of lower interest rates may reflect a number of factors. Some are psychological, such as money illusion: investors may ignore the fact that nominal interest rates may decline to compensate for lower inflation. Others may reflect institutional or regulatory constraints.

More generally, financial institutions regularly enter into long-term contracts committing them to produce relatively high nominal rates of return. The same mechanism could be in place whenever private investors use short-term returns as a way of judging manager competence and withdraw funds after poor performance

In the short term, low interest rates reduce the probability of default of outstanding variable rate loans, by reducing interest burdens of existing borrowers. In the medium term, however, due to the higher collateral values and the search for yield, banks tend to grant more risky loans and, in general, to soften their lending standards: they lend more to borrowers with bad credit histories and with more uncertain prospects. Overall, these results suggest that low interest rates reduce credit risk in banks’ portfolios in the short term – since the volume of outstanding loans is larger than the volume of new loans – but raise it in the medium term.

The empirical exercise points to a number of other interesting findings. First, developments in housing prices prior to the crisis appear to have contributed to bank risk-taking. An inflation-adjusted house price growth rate that is 1 percentage point above its long-run average for six consecutive years leading up to the crisis increases the probability of default of the average bank by 1.5%. This result is in line with the view that the housing market had a substantial role in the crisis and that banking distress was typically more severe in countries that experienced a more pronounced boom-bust cycle in house prices.

Second, banks that experienced a higher growth rate of lending with respect to the industry average prior to the crisis proved to be riskier ex post. For example, lending of about 10% above average over the six years preceding the crisis caused an increase in bank probability of default by 3.9%.

Risk aversion and risk premia in the CDS market

Sunday, December 6th, 2009

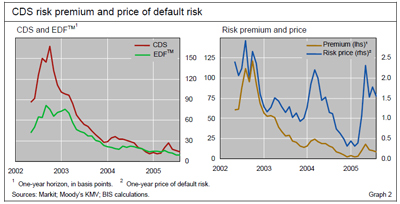
Jeffery D Amato wrote a paper with the captioned title in the BIS Quarterly Review, 4Q05:

Credit default swap (CDS) spreads compensate investors for expected loss, but they also contain risk premia because of investors’ aversion to default risk. We estimate CDS risk premia and default risk aversion to have been highly volatile during 2002–2005. Both measures appear to be related to fundamental macroeconomic factors, such as the stance of monetary policy, and technical market factors, such as issuance of collateralised debt obligations.

To proxy for default probabilities, we use one-year EDFs™ as in the study by Berndt et al (2005). EDFs™ are constructed using balance sheet and equity price data under the principles of a Merton-type model for gauging the likelihood of default. Our data on EDFs™ are available at a monthly frequency for all but two firms in the CDX.NA.IG.4 index. Aggregate and sector EDFs™ are constructed as simple arithmetic averages of existing data on the constituents.

In order to see how we obtain measures of risk premia and risk aversion, note that CDS spreads can be roughly decomposed as follows:

CDS spread = expected loss + risk premium
= expected loss x risk adjustment

where

risk adjustment = 1 + price of default risk

The first equation above says that the CDS spread is approximately equal to expected loss plus a risk premium, where the latter is compensation paid to investors for enduring exposure to default risk. In the second equation, the spread is re-expressed in terms of risk-adjusted expected loss, where the risk adjustment varies proportionally with the price of default risk. The price of default risk has the interpretation as the compensation per unit of expected loss. It is an indicator of investors’ aversion to default risk: a positive price of risk means that investors demand that they be paid more than actuarial losses. Hereafter, we will use the terms “price of default risk” and “indicator of default risk aversion” interchangeably.

While the formulations of spreads above isolate a “risk premium” and a “price of risk”, in principle there are two distinct types of default risk that may command a premium. One is cyclical variation in expected loss, which usually rises during economic downturns, when overall income growth is low. The other is the actual default of an entity and its impact on investors’ wealth due to an inability to perfectly diversify credit portfolios. In the literature, these are generally referred to as systematic and jump-at-default risk, respectively.


Click for big

The use of Moody’s KMV methodology to determine intrinsic default probability is similar to the Bank of England approach, but different from the recently published Bank of Canada liquidity research which, essentially, assigns a value of zero to the variable “price of default risk”.

MAPF Performance: November 2009

Sunday, December 6th, 2009

The fund performaned very well in November, helped by its relatively high concentration in PerpetualDiscount issues but assisted by the usually liquidity-inspired trades between issues.

The fund’s Net Asset Value per Unit as of the close November 30 was $12.5153.

Returns to November 30, 2009
Period MAPF Index CPD
according to
Claymore
One Month +3.72% +2.40% +2.19%
Three Months +0.25% -0.52% +0.33%
One Year +91.67% +35.03% +32.54%
Two Years (annualized) +28.27% +3.33% +2.33% *
Three Years (annualized) +16.06% -0.07%  
Four Years (annualized) +13.62% +1.03%  
Five Years (annualized) +12.14% +1.76%  
Six Years (annualized) +12.59% +2.47%  
Seven Years (annualized) +15.00% +3.20%  
Eight Years (annualized) +12.79% +3.12%  
The Index is the BMO-CM “50”
MAPF returns assume reinvestment of dividends, and are shown after expenses but before fees.
CPD Returns are for the NAV and are after all fees and expenses.
* CPD does not directly report its two-year returns. The figure shown is the product of the current one-year return and the similar figure reported for November 2008
Figures for Omega Preferred Equity (which are after all fees and expenses) for 1-, 3- and 12-months are +2.3%, +0.1% and +31.4%, respectively, according to Morningstar after all fees & expenses
Figures for Jov Leon Frazer Preferred Equity Fund (which are after all fees and expenses) for 1-, 3- and 12-months are N/A, N/A & N/A, respectively, according to Morningstar and the Globe and Mail
Figures for AIC Preferred Income Fund (which are after all fees and expenses) for 1-, 3- and 12-months are +1.7%, -0.4% & N/A, respectively

MAPF returns assume reinvestment of dividends, and are shown after expenses but before fees. Past performance is not a guarantee of future performance. You can lose money investing in Malachite Aggressive Preferred Fund or any other fund. For more information, see the fund’s main page.

I am very pleased with the returns over the past year, but implore Assiduous Readers not to project this level of outperformance for the indefinite future. The year in the preferred share market was filled with episodes of panic and euphoria, together with many new entrants who do not appear to know what they are doing; perfect conditions for a disciplined quantitative approach.

Sometimes everything works … sometimes the trading works, but sectoral shifts overwhelm the increment … sometimes nothing works. The fund seeks to earn incremental return by selling liquidity (that is, taking the other side of trades that other market participants are strongly motivated to execute), which can also be referred to as ‘trading noise’. There have been a lot of strongly motivated market participants in the past year, generating a lot of noise! The conditions of the past year may never be repeated in my lifetime … but the fund will simply attempt to make trades when swaps seem profitable, whether that implies monthly turnover of 10% or 100%.

There’s plenty of room for new money left in the fund. Just don’t expect the current level of outperformance every year, OK? While I will continue to exert utmost efforts to outperform, it should be borne in mind that beating the index by 500bp represents a good year, and there will almost inevitably be periods of underperformance in the future.

The yields available on high quality preferred shares remain elevated, which is reflected in the current estimate of sustainable income.

Calculation of MAPF Sustainable Income Per Unit
Month NAVPU Portfolio
Average
YTW
Leverage
Divisor
Securities
Average
YTW
Sustainable
Income
June, 2007 9.3114 5.16% 1.03 5.01% 0.4665
September 9.1489 5.35% 0.98 5.46% 0.4995
December, 2007 9.0070 5.53% 0.942 5.87% 0.5288
March, 2008 8.8512 6.17% 1.047 5.89% 0.5216
June 8.3419 6.034% 0.952 6.338% $0.5287
September 8.1886 7.108% 0.969 7.335% $0.6006
December, 2008 8.0464 9.24% 1.008 9.166% $0.7375
March 2009 $8.8317 8.60% 0.995 8.802% $0.7633
June 10.9846 7.05% 0.999 7.057% $0.7752
September 12.3462 6.03% 0.998 6.042% $0.7460
November 2009 12.5153 5.92% 1.002 5.908% $0.7394
NAVPU is shown after quarterly distributions.
“Portfolio YTW” includes cash (or margin borrowing), with an assumed interest rate of 0.00%
“Securities YTW” divides “Portfolio YTW” by the “Leverage Divisor” to show the average YTW on the securities held; this assumes that the cash is invested in (or raised from) all securities held, in proportion to their holdings.
“Sustainable Income” is the resultant estimate of the fund’s dividend income per unit, before fees and expenses.

As discussed in the post MAPF Portfolio Composition: November 2009, the fund has a position in the high-yielding split-share BNA.PR.C, about half of which was sold during the month in a swap for the slightly lower-yielding PerpetualDiscount BAM.PR.N. Additionally, the fund has a position in the high-yielding Operating Retractible YPG.PR.B. Both BNA.PR.C and YPG.PR.B are scheduled to mature (or to be retracted) in the future, hence the sustainability of sustainable yield calculated while incorporating their contribution is somewhat suspect, as discussed in August, 2008.

Significant positions were also held in Fixed-Reset issues on November 30; all of which currently have their yields calculated with the presumption that they will be called by the issuers at par at the first possible opportunity. This presents another complication in the calculation of sustainable yield.

However, if the entire portfolio except for the PerpetualDiscounts were to be sold and reinvested in these issues, the yield of the portfolio would be the 6.01% shown in the MAPF Portfolio Composition: November 2009 analysis(which is in excess of the 5.90% index yield on November 30). Given such reinvestment, the sustainable yield would be 12.5153 * 0.0601 = 0.7522 a significant increase from the $0.7433 derived by a similar calculation last month.

Different assumptions lead to different results from the calculation, but the overall positive trend is apparent. I’m very pleased with the results! It will be noted that if there was no trading in the portfolio, one would expect the sustainable yield to be constant (before fees and expenses). The success of the fund’s trading is showing up in

  • the very good performance against the index
  • the long term increases in sustainable income per unit

As has been noted, the fund has maintained a credit quality equal to or better than the index; outperformance is due to constant exploitation of trading anomalies.

Again, there are no predictions for the future! The fund will continue to trade between issues in an attempt to exploit market gaps in liquidity, in an effort to outperform the index and keep the sustainable income per unit – however calculated! – growing.

Index Performance: November 2009

Sunday, December 6th, 2009

Performance of the HIMIPref™ Indices for November, 2009, was:

Total Return
Index Performance
November 2009
Three Months
to
November 30, 2009
Ratchet -2.28% * +3.46% *
FixFloat +8.06% -4.15%
Floater +2.28% +3.46%
OpRet +0.85% +1.26%
SplitShare +2.33% +2.15%
Interest +0.85%**** +1.26%****
PerpetualPremium +1.49% -0.39%
PerpetualDiscount +3.07% -1.53%
FixedReset +1.93% +2.09%
* The last member of the RatchetRate index was transferred to Scraps at the February, 2009, rebalancing; subsequent performance figures are set equal to the Floater index
**** The last member of the InterestBearing index was transferred to Scraps at the June, 2009, rebalancing; subsequent performance figures are set equal to the OperatingRetractible index
Passive Funds (see below for calculations)
CPD +2.19% +0.31%
DPS.UN +3.09% -0.05%
Index
BMO-CM 50 +2.40% -0.52%

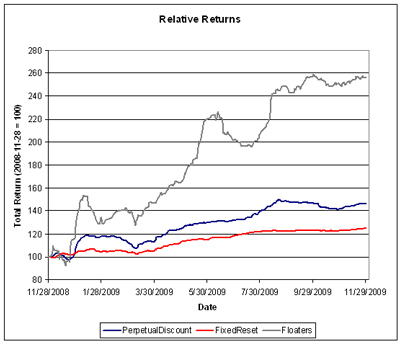
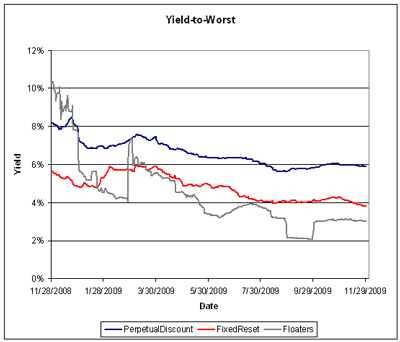
The charts have a calmer look to them this month, now that the apocalyptic months of October and November 2008 have been removed from the trailing 12-months.

The pre-tax interest equivalent spread of PerpetualDiscounts over Long Corporates (which I also refer to as the Seniority Spread) closed the month at 225bp, a significant tightening from the 250bp reported on October 30.

Meanwhile, Floaters continued their wild ride.


Click for big

Click for big


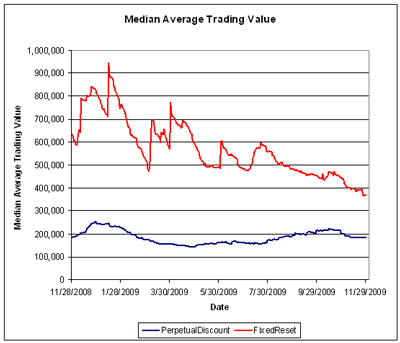
Click for big

Volume may be under-reported due to the influence of Alternative Trading Systems (as discussed in the November PrefLetter), but I am biding my time before incorporating ATS volumes into the calculations, to see if the effect is transient or not. The average volume of FixedResets continues to decline, which may be due to a number of factors:

  • The calculation is an exponential moving average with dampening applied to spikes. While this procedure has worked very well in the past (it is used to estimate the maximum size of potential trades when performing simulations) there are no guarantees that it works well this particular time
  • There hasn’t been much issuance of investment-grade FixedResets recently, which will decrease the liquidity of the whole group, both for technical and real reasons
  • The issues are becoming seasoned, as the shares gradually find their way into the accounts of buy-and-hold investors

As usual, I will make no predictions of how long the calculated current trend will continue or what liquidity might be like next year!

Compositions of the passive funds were discussed in the September edition of PrefLetter.

Claymore has published NAV and distribution data (problems with the page in IE8 can be kludged by using compatibility view) for its exchange traded fund (CPD) and I have derived the following table:

CPD Return, 1- & 3-month, to October 30, 2009
Date NAV Distribution Return for Sub-Period Monthly Return
August 31, 2009 16.93 0.00    
September 25 16.63 0.21 -0.53% -0.59%
September 30 16.62 0.00 -0.06%
October 30 16.41     -1.26%
November 30, 2009 16.77     +2.19%
Quarterly Return +0.31%

Claymore currently holds $350,336,161 (advisor & common combined) in CPD assets, up $35-million on the month and a stunning increase from the $84,005,161 reported in the Dec 31/08 Annual Report

The DPS.UN NAV for December 2 has been published so we may calculate the approximate November returns.

DPS.UN NAV Return, November-ish 2009
Date NAV Distribution Return for sub-period Return for period
October 28, 2009 19.32      
December 2, 2009 19.94     +3.21%
Estimated October Ending Stub -0.06% *
Estimated December Beginning Stub -0.06% **
Estimated November Return +3.09% ***
*CPD had a NAVPU of 16.40 on October 28 and 16.41 on October 30, hence the total return for the period for CPD was +0.06%. The return for DPS.UN in this period is presumed to be equal.
**CPD had a NAVPU of 16.77 on November 30 and 16.78 on December 2, hence the total return for the period for CPD was +0.06%. The return for DPS.UN in this period is presumed to be equal.
*** The November return for DPS.UN’s NAV is therefore the product of three period returns, +3.21%, -0.06% and -0.06% to arrive at an estimate for the calendar month of +3.09%

Now, to see the DPS.UN quarterly NAV approximate return, we refer to the calculations for September and October:

DPS.UN NAV Returns, three-month-ish to end-November-ish, 2009
September-ish -0.60%
October-ish -2.46%
November-ish +3.09%
Three-months-ish -0.05%

MAPF Portfolio Composition: November 2009

Saturday, December 5th, 2009

Turnover remained steady in November at about 48%. While activity both this month and last has been much lower than normal throughout the Credit Crunch – particularly since the Lehman bankruptcy brought chaos to the market – it at least marks a return to normalcy.

Trades were, as ever, triggered by a desire to exploit transient mispricing in the preferred share market (which may the thought of as “selling liquidity”), rather than any particular view being taken on market direction, sectoral performance or credit anticipation.

MAPF Sectoral Analysis 2009-11-30
HIMI Indices Sector Weighting YTW ModDur
Ratchet 0% N/A N/A
FixFloat 0% N/A N/A
Floater 0% N/A N/A
OpRet 0% N/A N/A
SplitShare 4.3% (-4.6) 7.90% 7.17
Interest Rearing 0% N/A N/A
PerpetualPremium 0.5% (0) 4.74% 0.57
PerpetualDiscount 72.6% (+5.3) 6.01% 13.90
Fixed-Reset 18.2% (+2.9) 3.90% 3.99
Scraps (OpRet) 4.5% (-0.1) 10.70% 5.84
Cash -0.2% (-3.3) 0.00% 0.00
Total 100% 5.92% 11.39
Totals and changes will not add precisely due to rounding. Bracketted figures represent change from October month-end. Cash is included in totals with duration and yield both equal to zero.

The “total” reflects the un-leveraged total portfolio (i.e., cash is included in the portfolio calculations and is deemed to have a duration and yield of 0.00.). MAPF will often have relatively large cash balances, both credit and debit, to facilitate trading. Figures presented in the table have been rounded to the indicated precision.

Of interest during the month was a swap out of BNA.PR.C into BAM.PR.N, at a take-out of approximately $2.00, executed in numerous small pieces. Approximately half of the position was swapped. This is a lazy little swap that goes back and forth from time to time; the last time was reported in August 2008. The format of the trade analysis at that time will be retained:

Post Mortem: BNA.PR.C / BAM.PR.N Swaps
Date BNA.PR.C BAM.PR.N
August 2008
Trade
Bought
17.25
Sold
16.85
November 2009
Trade
Sold
19.55
Bought
17.60
Dividends Earned about 2/3 of August ’08; Nov ’08; Feb, May, Aug & about 2/3 of Nov; Total ~$1.45 Missed Sep & Dec 08; Missed Mar, Jun, Sep 09; Total ~$1.48
The August ’08 trades were executed in pieces that spanned the BNA.PR.C ex-dividend date; dividends were earned on about 2/3 of the final position
The November ’09 trades were executed in pieces that spanned the BNA.PR.C ex-dividend date; dividends were earned on about 2/3 of the final position
This table attempts to present fairly the aggregate effect of a series of trades. Full disclosure of the 2008 trades is available on the Fund’s main page; full disclosure of the 2009 trades will be made at the time the audited 2009 Financials are published.

As can be seen, the swap has proved immensely profitable, but the long time-span of the holding masks a great deal of excitement! When market movements reduced the portfolio weight of BNA.PR.C to a lower than anticipated number, the position was topped up in December 2008 at 8.65.

Credit distribution is:

MAPF Credit Analysis 2009-11-30
DBRS Rating Weighting
Pfd-1 0 (0)
Pfd-1(low) 78.3% (+4.4)
Pfd-2(high) 4.9% (-0.5)
Pfd-2 2.4% (-0.5)
Pfd-2(low) 10.1% (+0.3)
Pfd-3(high) 4.5% (-0.1)
Cash -0.2% (-3.3)
Totals will not add precisely due to rounding. Bracketted figures represent change from October month-end.

Liquidity Distribution is:

MAPF Liquidity Analysis 2009-10-30
Average Daily Trading Weighting
<$50,000 0.0% (0)
$50,000 – $100,000 5.0% (-3.9)
$100,000 – $200,000 6.9% (-2.2)
$200,000 – $300,000 57.9% (+4.1)
>$300,000 30.5% (+6.2)
Cash -0.2% (-3.3)
Totals will not add precisely due to rounding. Bracketted figures represent change from October month-end.

MAPF is, of course, Malachite Aggressive Preferred Fund, a “unit trust” managed by Hymas Investment Management Inc. Further information and links to performance, audited financials and subscription information are available the fund’s web page. A “unit trust” is like a regular mutual fund, but is sold by offering memorandum rather than prospectus. This is cheaper, but means subscription is restricted to “accredited investors” (as defined by the Ontario Securities Commission) and those who subscribe for $150,000+. Fund past performances are not a guarantee of future performance. You can lose money investing in MAPF or any other fund.

A similar portfolio composition analysis has been performed on the Claymore Preferred Share ETF (symbol CPD) as of August 17 and published in the September PrefLetter. When comparing CPD and MAPF:

  • MAPF credit quality is better
  • MAPF liquidity is a little better
  • MAPF Yield is higher
  • Weightings in
    • MAPF is much more exposed to PerpetualDiscounts
    • MAPF is much less exposed to Operating Retractibles
    • MAPF is more exposed to SplitShares
    • MAPF is less exposed to FixFloat / Floater / Ratchet
    • MAPF weighting in FixedResets is much lower