Archive for November, 2014

November 7, 2014

Friday, November 7th, 2014

There was a good US jobs number today:

The American labor market is powering past a global slowdown as unemployment decreased to a six-year low in October and 214,000 workers were added to payrolls.

The jobless rate fell to 5.8 percent, the lowest since July 2008, from 5.9 percent in September, Labor Department figures showed today in Washington. The increase in hiring last month followed a 256,000 advance that was larger than first estimated as job gains head for their best showing in 15 years.

The report probably keeps Federal Reserve policy makers on track to raise interest rates in 2015 even as wages continued to show little momentum. Disappointing average hourly earnings help explain the voter discontent that gave the Republican party control of the Senate in this week’s election.

The one soft spot in the employment picture remains the inability of wages to show bigger increases. Average hourly earnings for all workers rose 0.1 percent in October from the prior month, and were up 2 percent since October 2013, less than the 2.1 percent median forecast. By this measure pay climbed 3.1 percent in the year before the recession began in December 2007

The ruble is continuing to have problems:

Russia’s central bank said it’s ready to step in at any time to prop up the ruble as the world’s worst-performing currency over the past three months extended declines.

The demand for dollars is creating conditions for risks to financial stability to emerge, the Bank of Russia in Moscow said in a statement on its website today. The monetary authority said it’s also ready to “use its other financial-market tools.”

The central bank led by Elvira Nabiullina has been struggling to stem the ruble’s decline as fighting erupts anew in Ukraine and crude oil, Russia’s main export earner, trades near a four-year low. Traders have tested how far the currency needs to drop before policy makers step in after the Bank of Russia moved closer to a free-floating exchange rate this week.

The ruble, which slumped as much as 4.3 percent earlier today, traded down 0.2 percent at 46.7136 per dollar at 7:33 p.m. in Moscow. It has plunged 22 percent in the mast three months, the most among more than 170 currencies tracked by Bloomberg.

The monetary authority sold $30 billion in October to limit the ruble fall, according to the statement, the first intervention since May. The value of Russia’s international reserves declined for 11 consecutive weeks to $428.6 billion as of Oct. 31, shrinking by a fifth since last year’s peak.

US bond dealers are losing market share to electronic exchanges:

Daily trading of corporate bonds averaged $21.8 billion in October, the most ever, according to the Securities Industry & Financial Markets Association. Meanwhile, at the 22 primary dealers that are counterparties with the Federal Reserve, it was about average for the year.

The data suggest the biggest banks are losing a bit of their dominance over the bond market as post-crisis regulations prompt them to cut staff and inventories of riskier debt. In response, investors are changing the way they do business, transacting more frequently on electronic exchanges and stepping into trading once dominated by dealers.

Last month, bond prices swung the most in more than a year as investors grew jittery about plunging oil prices and slowing global growth. A measure of implied volatility in Treasuries as measured by Bank of America Merrill Lynch’s MOVE index was 19 percent higher in October than the average over the prior year.

Junk-bond trading averaged a record $8.3 billion a day in October, 26 percent higher than the average during the previous 12 months, according to the Financial Industry Regulatory Authority. The volume of speculative-grade debt traded on MarketAxess Holdings Inc.’s electronic system last month was almost 30 percent higher than the prior record.

At the same time, corporate-bond trading at primary dealers averaged $111 billion a week in October, just under the $112 billion average during the prior year, Fed data show.

Part of the decline in activity at Wall Street’s biggest banks can be attributed to a drop-off in new corporate-bond sales, which tend to drive a significant portion of their business.

Another reason: The firms have been steadily cutting their inventories of riskier debt. They slashed their high-yield bond holdings 68 percent in the week ended Oct. 15 to a net $2 billion, Fed data show.

There will be plenty of grist for academic mills in sorting all this out. Increased volatility is a logical consequence of exchange trading, but there is no shortage of confounding factors!

It was a mixed day for the Canadian preferred share market today, with PerpetualDiscounts off 4bp, FixedResets up 12bp and DeemedRetractibles flat. Volatility was average. Volume was on the low side of average.

HIMIPref™ Preferred Indices
These values reflect the December 2008 revision of the HIMIPref™ Indices

Values are provisional and are finalized monthly
Index Mean
Current
Yield
(at bid)
Median
YTW
Median
Average
Trading
Value
Median
Mod Dur
(YTW)
Issues Day’s Perf. Index Value
Ratchet 0.00 % 0.00 % 0 0.00 0 0.3257 % 2,542.9
FixedFloater 0.00 % 0.00 % 0 0.00 0 0.3257 % 4,025.9
Floater 2.96 % 3.06 % 63,472 19.55 4 0.3257 % 2,703.3
OpRet 4.01 % -2.76 % 107,804 0.08 1 0.1176 % 2,751.9
SplitShare 4.24 % 3.89 % 58,920 3.77 5 0.0848 % 3,189.5
Interest-Bearing 0.00 % 0.00 % 0 0.00 0 0.1176 % 2,516.3
Perpetual-Premium 5.44 % -8.32 % 69,750 0.08 19 0.0185 % 2,483.4
Perpetual-Discount 5.13 % 5.03 % 104,489 15.38 16 -0.0450 % 2,663.7
FixedReset 4.18 % 3.58 % 170,794 4.54 74 0.1161 % 2,581.0
Deemed-Retractible 4.97 % -0.20 % 101,716 0.13 41 0.0010 % 2,598.3
FloatingReset 2.55 % -1.43 % 67,948 0.08 6 0.0065 % 2,554.0
Performance Highlights
Issue Index Change Notes
POW.PR.G Perpetual-Premium -1.60 % YTW SCENARIO
Maturity Type : Call
Maturity Date : 2021-04-15
Maturity Price : 25.00
Evaluated at bid price : 26.41
Bid-YTW : 4.67 %
FTS.PR.G FixedReset 1.08 % YTW SCENARIO
Maturity Type : Limit Maturity
Maturity Date : 2044-11-07
Maturity Price : 23.37
Evaluated at bid price : 25.32
Bid-YTW : 3.57 %
MFC.PR.G FixedReset 1.35 % YTW SCENARIO
Maturity Type : Call
Maturity Date : 2016-12-19
Maturity Price : 25.00
Evaluated at bid price : 26.35
Bid-YTW : 2.07 %
Volume Highlights
Issue Index Shares
Traded
Notes
NA.PR.W FixedReset 214,250 Recent new issue.
YTW SCENARIO
Maturity Type : Limit Maturity
Maturity Date : 2044-11-07
Maturity Price : 23.18
Evaluated at bid price : 25.10
Bid-YTW : 3.70 %
TRP.PR.E FixedReset 146,928 Nesbitt crossed 50,000 at 25.38, then two blocks of 30,000 each at the same price. TD crossed 30,000 at the same price again.
YTW SCENARIO
Maturity Type : Limit Maturity
Maturity Date : 2044-11-07
Maturity Price : 23.24
Evaluated at bid price : 25.25
Bid-YTW : 3.82 %
NA.PR.S FixedReset 130,672 Nesbitt crossed 29,500 at 25.65; TD crossed 98,400 at the same price.
YTW SCENARIO
Maturity Type : Call
Maturity Date : 2019-05-15
Maturity Price : 25.00
Evaluated at bid price : 25.55
Bid-YTW : 3.56 %
RY.PR.I FixedReset 109,190 RBC crossed 13,600 at 25.67, then 50,000 and 35,200 at 25.70. TD crossed 10,000 at 25.67.
YTW SCENARIO
Maturity Type : Call
Maturity Date : 2019-02-24
Maturity Price : 25.00
Evaluated at bid price : 25.60
Bid-YTW : 2.89 %
TD.PF.A FixedReset 95,555 Nesbitt crossed 17,200 at 25.45, then 30,000 at 25.46. TD crossed 40,000 at 25.45.
YTW SCENARIO
Maturity Type : Call
Maturity Date : 2019-10-31
Maturity Price : 25.00
Evaluated at bid price : 25.45
Bid-YTW : 3.54 %
RY.PR.H FixedReset 82,190 RBC crossed 50,000 at 25.40; Scotia crossed 25,000 at the same price.
YTW SCENARIO
Maturity Type : Call
Maturity Date : 2019-08-24
Maturity Price : 25.00
Evaluated at bid price : 25.40
Bid-YTW : 3.51 %
There were 27 other index-included issues trading in excess of 10,000 shares.
Wide Spread Highlights
Issue Index Quote Data and Yield Notes
FTS.PR.H FixedReset Quote: 20.35 – 21.19
Spot Rate : 0.8400
Average : 0.5048

YTW SCENARIO
Maturity Type : Limit Maturity
Maturity Date : 2044-11-07
Maturity Price : 20.35
Evaluated at bid price : 20.35
Bid-YTW : 3.78 %

POW.PR.G Perpetual-Premium Quote: 26.41 – 26.97
Spot Rate : 0.5600
Average : 0.3365

YTW SCENARIO
Maturity Type : Call
Maturity Date : 2021-04-15
Maturity Price : 25.00
Evaluated at bid price : 26.41
Bid-YTW : 4.67 %

BAM.PF.A FixedReset Quote: 25.85 – 26.17
Spot Rate : 0.3200
Average : 0.2238

YTW SCENARIO
Maturity Type : Call
Maturity Date : 2018-09-30
Maturity Price : 25.00
Evaluated at bid price : 25.85
Bid-YTW : 3.71 %

FTS.PR.K FixedReset Quote: 25.02 – 25.30
Spot Rate : 0.2800
Average : 0.2016

YTW SCENARIO
Maturity Type : Limit Maturity
Maturity Date : 2044-11-07
Maturity Price : 23.22
Evaluated at bid price : 25.02
Bid-YTW : 3.59 %

HSB.PR.D Deemed-Retractible Quote: 25.31 – 25.70
Spot Rate : 0.3900
Average : 0.3187

YTW SCENARIO
Maturity Type : Call
Maturity Date : 2014-12-31
Maturity Price : 25.00
Evaluated at bid price : 25.31
Bid-YTW : 0.16 %

GWO.PR.F Deemed-Retractible Quote: 25.61 – 25.86
Spot Rate : 0.2500
Average : 0.1793

YTW SCENARIO
Maturity Type : Call
Maturity Date : 2014-12-07
Maturity Price : 25.00
Evaluated at bid price : 25.61
Bid-YTW : -15.42 %

November 6, 2014

Thursday, November 6th, 2014

Our political and appointed masters are once again avoiding communication with Canadians:

Lawrence Schembri isn’t the first official to warn how dangerous this could be.

But his paper, published today, is notable in that it comes from a deputy governor of the Bank of Canada, which only recently again cited the threats from the massive debt loads of Canadian households.

Mr. Schembri stresses that the system is sound, as long as there’s no “severe” shock that would drive up unemployment, and that the “imbalances” among consumers will probably ease as mortgage rates inevitably rise.

Nonetheless, he writes in the National Institute Economic Review, things have to change given, among other things, debt-to-income levels that have been at or near record levels in Canada.

The Bank of Canada states that ordinary Canadians can go fuck themselves:

Members of the media may obtain a copy of this article by contacting the National Institute of Economic and Social Research Press Office:

Yeah, I’ll bet the smart cookies in the press do a really good job of summarizing the article in all its essentials. This business of senior officials hiding their thoughts behind foreign pay walls is a real disgrace.

While we’re on the topic of autocratic central banks immune from criticism, PBOC has a familiar problem – people want to borrow money for inappropriate purposes (as determined by central bank):

The People’s Bank of China confirmed it pumped 769.5 billion yuan ($126 billion) into the country’s lenders in the last two months through a newly-created Medium-term Lending Facility. The PBOC injected 500 billion yuan in September and another 269.5 billion yuan in October via the facility — all termed at three months with an interest rate of 3.5 percent.

The announcement, included in the PBOC’s quarterly monetary policy statement, is the first official confirmation of earlier reports on the injections. Goldman Sachs Group Inc. said every 500 billion yuan in funds from the central bank is similar to a 50-basis-point cut in the required reserve ratio.

“It shows the central bank is very reluctant to loosen monetary policy, but it has to reduce financing costs for end borrowers,” said Guan Qingyou, chief macro-economic researcher with Minsheng Securities Co. in Beijing. “It doesn’t mean the new tools can replace traditional tools forever.”

The operations “affected mid-term interest rates while providing liquidity to guide commercial banks to lower their lending rates and overall social-financing costs,” the central bank said in the report published yesterday. “As liquidity generated from capital inflows eases, MLF has played a role of covering the liquidity gap and maintaining a neutral and appropriate liquidity situation.”

The facility is the latest unconventional liquidity tool as the PBOC joins the European Central Bank on a path of easing even as the U.S. begins the shift to a more normal monetary policy. The expansion builds on targeted steps to support growth in Asia’s largest economy, while stopping short of broad-based monetary loosening and fiscal stimulus that could heighten debt risks and the risk of bad loans.

It was a mixed day for the Canadian preferred share market, with PerpetualDiscounts gaining 2bp, FixedResets down 21bp and DeemedRetractibles up 12bp. Volatility was high. Volume was average.

HIMIPref™ Preferred Indices
These values reflect the December 2008 revision of the HIMIPref™ Indices

Values are provisional and are finalized monthly
Index Mean
Current
Yield
(at bid)
Median
YTW
Median
Average
Trading
Value
Median
Mod Dur
(YTW)
Issues Day’s Perf. Index Value
Ratchet 0.00 % 0.00 % 0 0.00 0 -0.1696 % 2,534.7
FixedFloater 0.00 % 0.00 % 0 0.00 0 -0.1696 % 4,012.9
Floater 2.97 % 3.07 % 65,795 19.52 4 -0.1696 % 2,694.5
OpRet 4.02 % -1.48 % 105,291 0.08 1 -0.0392 % 2,748.7
SplitShare 4.25 % 3.83 % 61,342 3.77 5 -0.1213 % 3,186.8
Interest-Bearing 0.00 % 0.00 % 0 0.00 0 -0.0392 % 2,513.4
Perpetual-Premium 5.44 % -7.13 % 70,622 0.08 19 0.1090 % 2,482.9
Perpetual-Discount 5.13 % 5.03 % 104,450 15.40 16 0.0159 % 2,664.9
FixedReset 4.18 % 3.62 % 172,625 6.44 74 -0.2132 % 2,578.0
Deemed-Retractible 4.97 % -0.14 % 102,325 0.14 41 0.1200 % 2,598.3
FloatingReset 2.55 % -0.95 % 62,909 0.08 6 -0.0652 % 2,553.8
Performance Highlights
Issue Index Change Notes
ENB.PR.Y FixedReset -1.62 % YTW SCENARIO
Maturity Type : Limit Maturity
Maturity Date : 2044-11-06
Maturity Price : 22.65
Evaluated at bid price : 23.70
Bid-YTW : 4.15 %
PWF.PR.P FixedReset -1.54 % YTW SCENARIO
Maturity Type : Limit Maturity
Maturity Date : 2044-11-06
Maturity Price : 21.87
Evaluated at bid price : 22.40
Bid-YTW : 3.55 %
BAM.PF.B FixedReset -1.38 % YTW SCENARIO
Maturity Type : Limit Maturity
Maturity Date : 2044-11-06
Maturity Price : 23.23
Evaluated at bid price : 25.05
Bid-YTW : 4.09 %
BAM.PR.T FixedReset -1.04 % YTW SCENARIO
Maturity Type : Limit Maturity
Maturity Date : 2044-11-06
Maturity Price : 23.40
Evaluated at bid price : 24.74
Bid-YTW : 3.93 %
ELF.PR.F Perpetual-Discount 1.06 % YTW SCENARIO
Maturity Type : Limit Maturity
Maturity Date : 2044-11-06
Maturity Price : 24.61
Evaluated at bid price : 24.87
Bid-YTW : 5.37 %
POW.PR.G Perpetual-Premium 1.09 % YTW SCENARIO
Maturity Type : Call
Maturity Date : 2017-04-15
Maturity Price : 26.00
Evaluated at bid price : 26.84
Bid-YTW : 4.14 %
Volume Highlights
Issue Index Shares
Traded
Notes
IFC.PR.C FixedReset 164,705 RBC crossed 93,200 at 25.56; Nesbitt crossed 50,000 at the same price.
YTW SCENARIO
Maturity Type : Call
Maturity Date : 2016-09-30
Maturity Price : 25.00
Evaluated at bid price : 25.55
Bid-YTW : 3.25 %
NA.PR.W FixedReset 156,055 Recent new issue.
YTW SCENARIO
Maturity Type : Limit Maturity
Maturity Date : 2044-11-06
Maturity Price : 23.16
Evaluated at bid price : 25.06
Bid-YTW : 3.70 %
FTS.PR.M FixedReset 110,945 Scotia crossed blocks of 25,100 shares, 16,000 shares, 40,000 and 25,000, all at 25.70.
YTW SCENARIO
Maturity Type : Call
Maturity Date : 2019-12-01
Maturity Price : 25.00
Evaluated at bid price : 25.65
Bid-YTW : 3.67 %
BMO.PR.S FixedReset 110,782 Scotia crossed 100,000 at 25.51.
YTW SCENARIO
Maturity Type : Call
Maturity Date : 2019-05-25
Maturity Price : 25.00
Evaluated at bid price : 25.45
Bid-YTW : 3.53 %
RY.PR.I FixedReset 82,400 RBC crossed blocks of 50,000 and 25,100, both at 25.68.
YTW SCENARIO
Maturity Type : Call
Maturity Date : 2019-02-24
Maturity Price : 25.00
Evaluated at bid price : 25.67
Bid-YTW : 2.82 %
SLF.PR.D Deemed-Retractible 70,162 Desjardins crossed 10,000 at 23.00; RBC crossed 44,200 at the same price.
YTW SCENARIO
Maturity Type : Hard Maturity
Maturity Date : 2025-01-31
Maturity Price : 25.00
Evaluated at bid price : 22.87
Bid-YTW : 5.65 %
There were 30 other index-included issues trading in excess of 10,000 shares.
Wide Spread Highlights
Issue Index Quote Data and Yield Notes
MFC.PR.L FixedReset Quote: 25.08 – 25.40
Spot Rate : 0.3200
Average : 0.2094

YTW SCENARIO
Maturity Type : Hard Maturity
Maturity Date : 2025-01-31
Maturity Price : 25.00
Evaluated at bid price : 25.08
Bid-YTW : 3.84 %

BAM.PR.Z FixedReset Quote: 26.30 – 26.66
Spot Rate : 0.3600
Average : 0.2499

YTW SCENARIO
Maturity Type : Call
Maturity Date : 2017-12-31
Maturity Price : 25.00
Evaluated at bid price : 26.30
Bid-YTW : 3.23 %

TRP.PR.B FixedReset Quote: 18.91 – 19.26
Spot Rate : 0.3500
Average : 0.2399

YTW SCENARIO
Maturity Type : Limit Maturity
Maturity Date : 2044-11-06
Maturity Price : 18.91
Evaluated at bid price : 18.91
Bid-YTW : 3.81 %

PWF.PR.G Perpetual-Premium Quote: 25.50 – 25.98
Spot Rate : 0.4800
Average : 0.3755

YTW SCENARIO
Maturity Type : Call
Maturity Date : 2014-12-06
Maturity Price : 25.00
Evaluated at bid price : 25.50
Bid-YTW : -16.34 %

GWO.PR.I Deemed-Retractible Quote: 23.10 – 23.44
Spot Rate : 0.3400
Average : 0.2384

YTW SCENARIO
Maturity Type : Hard Maturity
Maturity Date : 2025-01-31
Maturity Price : 25.00
Evaluated at bid price : 23.10
Bid-YTW : 5.57 %

PWF.PR.O Perpetual-Premium Quote: 26.15 – 26.48
Spot Rate : 0.3300
Average : 0.2450

YTW SCENARIO
Maturity Type : Call
Maturity Date : 2014-12-06
Maturity Price : 26.00
Evaluated at bid price : 26.15
Bid-YTW : -0.33 %

VSN Downgraded to Pfd-3 by DBRS

Thursday, November 6th, 2014

DBRS has announced that it:

has today downgraded Veresen Inc.’s (Veresen or the Company) Issuer Rating and Senior Unsecured Notes rating to BBB from BBB (high) and its Preferred Shares rating to Pfd-3 from Pfd-3 (high), following the closing of Veresen’s acquisition of 50% convertible preferred interest in Ruby pipeline system (Ruby). Concurrently, the ratings have been removed from Under Review with Negative Implications, having been placed as such in September 2014. (Please refer to DBRS press release dated September 23, 2014, for details). The trend on the ratings has been changed to Stable.

The USD 1.425 billion acquisition, including transaction costs, was financed with CAD 920 million of Veresen common equity and CAD 727 million of bank debt. This was substantially in line with DBRS expectations, as noted in the previous press release. DBRS had previously noted that the acquisition will have a negative impact on the Company’s business risk profile and a moderately negative impact on its financial risk profile. Due to low average throughput utilization (55%, compared to 71% contracted), Ruby is exposed to re-contracting risk when the majority of contracts (approximately 65%) expire in 2021, and the pipeline’s capacity may not be re-contracted at current tolls, volumes or duration. This is largely a reflection of the weak natural gas pricing environment and competitive landscape. In addition, Company’s leverage is expected to be moderately higher and coverage ratios are expected to weaken due to the higher debt levels resulting from the acquisition.

The Review-Negative was previously reported on PrefBlog.

Veresen is the proud issuer of VSN.PR.A and VSN.PR.C, both FixedResets.

S&P affirmed its ratings of P-3(high) in September:

  • •We are affirming our ratings, including our ‘BBB’ long-term corporate credit rating, on Veresen Inc. following the announcement that it has acquired 50% of the Ruby pipeline through convertible preferred shares.
  • •The transaction adds contracted capacity and tenor to Veresen’s mix of pipeline assets; however, it also modestly decreases forecast financial metrics.
  • •The stable outlook reflects our expectation that the company will continue to focus on adding fee-for-service midstream and long-term contracted power generation.


The stable outlook reflects our expectation that Veresen will continue to focus on adding fee-for-service midstream and long-term contracted power generation. The outlook also reflects our assumption that the total equity component for financing the transaction includes the 15% overallotment, and that the dividend reinvestment program (DRIP) remains in place to reduce leverage over time. Although the transaction modestly improves contract tenor and diversification away from the Alliance pipeline, financial metrics are compressed and we expect to see debt reduction, likely through DRIPs, to maintain the outlook.

We could lower the ratings if AFFO-to-debt drops to the lower end within the “significant” range using the medial table. In addition, if the contract profile at Alliance after 2015 significantly increases the cash flow variability or business risk to Veresen, we could lower the ratings.

The uncertainty surrounding the Alliance pipeline recontracting is likely to constrain the ratings for the next two years. An upgrade is unlikely in that time without AFFO-to-debt staying above 23% and the contract profile improving at Alliance.

November 5, 2014

Wednesday, November 5th, 2014

OSFI honcho Jeremy Rudin spoke to a Senate committee today but didn’t actually say anything.

It was a mixed day for the Canadian preferred share market, with PerpetualDiscounts up 26bp, FixedResets gaining 10bp and DeemedRetractibles off 1bp. Volatility was average. Volume was low.

PerpetualDiscounts now yield 5.02%, equivalent to 6.53% interest at the standard equivalency factor of 1.3x. Long Corporates now yield about 4.2%, so the pre-tax, interest-equivalent spread (in this context, the Seniority Spread) is now about 235bp, a slight (and perhaps spurious) narrowing from the 240bp reported October 29.

HIMIPref™ Preferred Indices
These values reflect the December 2008 revision of the HIMIPref™ Indices

Values are provisional and are finalized monthly
Index Mean
Current
Yield
(at bid)
Median
YTW
Median
Average
Trading
Value
Median
Mod Dur
(YTW)
Issues Day’s Perf. Index Value
Ratchet 0.00 % 0.00 % 0 0.00 0 0.5830 % 2,539.0
FixedFloater 0.00 % 0.00 % 0 0.00 0 0.5830 % 4,019.7
Floater 2.97 % 3.06 % 65,533 19.55 4 0.5830 % 2,699.1
OpRet 4.02 % -2.09 % 100,348 0.08 1 0.0392 % 2,749.7
SplitShare 4.24 % 3.89 % 63,864 3.78 5 0.1285 % 3,190.7
Interest-Bearing 0.00 % 0.00 % 0 0.00 0 0.0392 % 2,514.3
Perpetual-Premium 5.45 % -5.88 % 70,296 0.09 19 0.1194 % 2,480.2
Perpetual-Discount 5.13 % 5.02 % 104,990 15.41 16 0.2604 % 2,664.5
FixedReset 4.17 % 3.61 % 167,815 4.54 74 0.0953 % 2,583.6
Deemed-Retractible 4.97 % 0.72 % 100,567 0.15 41 -0.0145 % 2,595.2
FloatingReset 2.55 % -2.37 % 63,251 0.08 6 0.0718 % 2,555.5
Performance Highlights
Issue Index Change Notes
GWO.PR.H Deemed-Retractible -1.02 % YTW SCENARIO
Maturity Type : Hard Maturity
Maturity Date : 2025-01-31
Maturity Price : 25.00
Evaluated at bid price : 24.31
Bid-YTW : 5.30 %
MFC.PR.B Deemed-Retractible -1.01 % YTW SCENARIO
Maturity Type : Hard Maturity
Maturity Date : 2025-01-31
Maturity Price : 25.00
Evaluated at bid price : 23.60
Bid-YTW : 5.48 %
FTS.PR.G FixedReset 1.28 % YTW SCENARIO
Maturity Type : Limit Maturity
Maturity Date : 2044-11-05
Maturity Price : 23.34
Evaluated at bid price : 25.23
Bid-YTW : 3.59 %
BAM.PR.B Floater 1.65 % YTW SCENARIO
Maturity Type : Limit Maturity
Maturity Date : 2044-11-05
Maturity Price : 17.26
Evaluated at bid price : 17.26
Bid-YTW : 3.06 %
Volume Highlights
Issue Index Shares
Traded
Notes
CU.PR.D Perpetual-Discount 243,658 Desjardins crossed 237,200 at 24.63.
YTW SCENARIO
Maturity Type : Limit Maturity
Maturity Date : 2044-11-05
Maturity Price : 24.21
Evaluated at bid price : 24.63
Bid-YTW : 4.96 %
NA.PR.W FixedReset 79,770 Recent new issue.
YTW SCENARIO
Maturity Type : Limit Maturity
Maturity Date : 2044-11-05
Maturity Price : 23.16
Evaluated at bid price : 25.06
Bid-YTW : 3.70 %
CM.PR.O FixedReset 54,250 TD crossed 50,000 at 25.45.
YTW SCENARIO
Maturity Type : Call
Maturity Date : 2019-07-31
Maturity Price : 25.00
Evaluated at bid price : 25.43
Bid-YTW : 3.54 %
HSE.PR.A FixedReset 51,511 Desjardins crossed 44,600 at 22.75.
YTW SCENARIO
Maturity Type : Limit Maturity
Maturity Date : 2044-11-05
Maturity Price : 22.32
Evaluated at bid price : 22.72
Bid-YTW : 3.71 %
CU.PR.E Perpetual-Discount 44,028 Nesbitt crossed 40,000 at 24.63.
YTW SCENARIO
Maturity Type : Limit Maturity
Maturity Date : 2044-11-05
Maturity Price : 24.17
Evaluated at bid price : 24.59
Bid-YTW : 4.97 %
TRP.PR.B FixedReset 33,269 YTW SCENARIO
Maturity Type : Limit Maturity
Maturity Date : 2044-11-05
Maturity Price : 18.90
Evaluated at bid price : 18.90
Bid-YTW : 3.81 %
There were 19 other index-included issues trading in excess of 10,000 shares.
Wide Spread Highlights
Issue Index Quote Data and Yield Notes
FTS.PR.K FixedReset Quote: 25.01 – 25.35
Spot Rate : 0.3400
Average : 0.1984

YTW SCENARIO
Maturity Type : Limit Maturity
Maturity Date : 2044-11-05
Maturity Price : 23.22
Evaluated at bid price : 25.01
Bid-YTW : 3.60 %

GWO.PR.H Deemed-Retractible Quote: 24.31 – 24.70
Spot Rate : 0.3900
Average : 0.2695

YTW SCENARIO
Maturity Type : Hard Maturity
Maturity Date : 2025-01-31
Maturity Price : 25.00
Evaluated at bid price : 24.31
Bid-YTW : 5.30 %

MFC.PR.B Deemed-Retractible Quote: 23.60 – 23.96
Spot Rate : 0.3600
Average : 0.2417

YTW SCENARIO
Maturity Type : Hard Maturity
Maturity Date : 2025-01-31
Maturity Price : 25.00
Evaluated at bid price : 23.60
Bid-YTW : 5.48 %

BAM.PR.R FixedReset Quote: 25.80 – 26.10
Spot Rate : 0.3000
Average : 0.1837

YTW SCENARIO
Maturity Type : Call
Maturity Date : 2016-06-30
Maturity Price : 25.00
Evaluated at bid price : 25.80
Bid-YTW : 3.75 %

PVS.PR.C SplitShare Quote: 25.91 – 26.80
Spot Rate : 0.8900
Average : 0.7809

YTW SCENARIO
Maturity Type : Hard Maturity
Maturity Date : 2017-12-10
Maturity Price : 25.00
Evaluated at bid price : 25.91
Bid-YTW : 3.89 %

TRP.PR.C FixedReset Quote: 21.84 – 22.13
Spot Rate : 0.2900
Average : 0.1842

YTW SCENARIO
Maturity Type : Limit Maturity
Maturity Date : 2044-11-05
Maturity Price : 21.49
Evaluated at bid price : 21.84
Bid-YTW : 3.59 %

IAG.PR.E To Be Redeemed

Wednesday, November 5th, 2014

Industrial Alliance Insurance and Financial Services Inc. has announced:

that it has the intention to redeem, on December 31, 2014, all of its Non-Cumulative Class A Preferred Shares Series E (the “Series E Preferred Shares”) then outstanding. The redemption price will be $26.00 for each Series E Preferred Share less any tax required to be deducted and withheld by Industrial Alliance. There are 4,000,000 Series E Preferred Shares outstanding as of today. A formal notice and instructions for the redemption of the Series E Preferred Shares will be sent to all shareholders in accordance with the rights, privileges, restrictions and conditions attached to the Series E Preferred Shares.

Separately from the redemption price, the final quarterly dividend of $0.3750 per Series E Preferred Share will be paid in the usual manner on December 31, 2014 to shareholders of record on November 28, 2014. After the Series E Preferred Shares are redeemed, holders of Series E Preferred Shares will cease to be entitled to distributions of dividends and will not be entitled to exercise any rights as holders other than to receive the redemption price and the final quarterly dividend described above.

Note that this redemption is at $26.00, a premium to the issue price of $25, which means that for tax purposes holders will be treated as if their $26.00 is comprised of a sale at $25.00 and a deemed dividend of $1.00; this can have important tax consequences, particularly for those who have accumulated capital losses for tax purposes. In many cases it will be advisable for holders to sell prior to redemption (at redemption price less a few pennies so the purchaser can make a little money, but plus the final dividend value if sold before the ex-dividend date). Please consult your personal tax advisor.

IAG.PR.E is a 6.00% Straight Perpetual (considered to be a DeemedRetractible since it’s issued by an insurer) which commenced trading 2009-10-15 after being announced 2009-10-6.

November 4, 2014

Tuesday, November 4th, 2014

The Parakeet has considered the problem of youth unemployment and come up with the ideal solution: work for free!

How bad are things in Canada’s job market? Bank of Canada Governor Stephen Poloz says bad enough for young people to consider working for free.

Adult children stuck in their parents’ basements because they can’t find adequate employment should take unpaid work to bolster résumés as they wait for the recovery to take hold, Poloz said Monday in Toronto.

The Bank of Canada estimates about 200,000 young people want to work or work more, and Poloz said they may be scarred by prolonged unemployment that prevents them from moving out on their own. He said he’s been asked for advice on how young people can find work.

“Having something unpaid on your CV is very worth it, because that’s the one thing you can do to counteract this scarring effect,” Poloz told reporters was his advice to discouraged youth.

Going back to school for something useful is not an option, apparently. As a sometime employer, I can’t say volunteer work impresses me very much. It’s very difficult to judge the quality, for one thing: no volunteer agency is ever going to fire their volunteers, or give them bad references. And my big question is … was that really the best thing you could think of? Not school, not working at Timmy’s, nothing?

I might make exceptions to this general rule for closely related and idealistic work. If I was hiring a nurse, for instance, going to Liberia for a year to treat Ebola patients or deliver babies would not be a negative. But not necessarily a lot of credit because around here, nurses don’t deliver babies; I need a nurse to treat my paper cuts, which can get pretty vicious sometimes.

Anyway, the parakeet’s getting a pretty rough ride in the G&M comments.

There’s good news about the US deficit:

Robust economic growth has helped push the U.S. budget deficit down to the lowest level since 2008, marking the sharpest turnaround in the government’s fiscal position in at least 46 years.

The shortfall of $483.4 billion in the 12 months ended Sept. 30 was 2.8 percent of the nation’s gross domestic product of $17.2 trillion over the same period, according to data compiled by Bloomberg using Commerce Department figures. The figure peaked at 10.1 percent of GDP in December 2009.

That’s quite the drop!

Whoopsy! BNS disclosed some nasty 14Q4 charges:

Scotiabank (TSX: BNS) (NYSE: BNS) today announced that it expects to record certain charges in its fiscal 2014 fourth quarter earnings, aggregating to a total of approximately $451 million pre-tax, or $341 million after tax. Diluted earnings per share are expected to be impacted by approximately $0.28. These items will also impact the Bank’s Common Equity Tier 1 capital ratio by approximately 10 basis points. The charges fall into two broad categories: (1) changes in estimates and additional credit provisions; and (2) restructuring charges.

DBRS comments:

Some of the charges are consistent with DBRS’s opinion that Scotiabank’s exposure in emerging markets and corporate lending is higher compared to its Canadian bank peers; as a result, DBRS views BNS’s credit risk as the highest among the big five banks, although it remains strong overall as the Bank is also the most geographically diverse. DBRS does not expect the restructuring efforts to negatively impact the Bank’s operations in any material way. In Canada, the efforts are expected to improve customer service and efficiency of non-customer-facing functions. In International Banking, Scotiabank indicates they are attempting to right-size the branch networks in various countries in light of the economic realities.

Brookfield’s aggressive approach to expansion has cost Brookfield Renewable Energy Partners L.P. it’s S&P ‘Positive’outlook:

  • •We are revising our outlook on Brookfield Renewable Energy Partners L.P. (BREP) to stable from positive.
  • •The outlook revision reflects our assessment of the amount of debt being maintained at the parent level in relation to parent-only cash flow that the partnership is generating.
  • •We are also affirming our ratings on BREP and subsidiaries Brookfield Renewable Power Preferred Equity Inc. and BRP Finance ULC, including our ‘BBB’ long-term corporate credit rating on BREP.


At the same time Standard & Poor’s affirmed its ratings on BREP and subsidiaries Brookfield Renewable Power Preferred Equity Inc. and BRP Finance ULC, including its ‘BBB’ long-term corporate credit rating on BREP.

The outlook revision reflects our view of the company’s ability to generate strong remittable cash flows from its holdings and its increased level of holding company (holdco) recourse debt. The company has articulated a policy of maintaining relatively low levels of leverage at the holdco level with leverage at the holdco used opportunistically for acquisitions with equity as market conditions allow. However, during the course of the year, the company has made a number of acquisitions that, although partially funded with new equity issuance, maintained a higher level of debt at the holdco. This has resulted in lower credit metrics.

The stable outlook reflects our expectation that BREP will continue to increase its parent-only cash flow while maintaining modest amounts of debt at the holding company as well as maintaining the highly contracted and well-diversified portfolio of generation assets.

We could raise the ratings if we believe that parent-only cash flow to debt will continue at or above 30% assuming the current quality of cash flow score of ‘4’.

We could lower the rating if the partnership is unable to maintain parent-only cash flow to debt above 23% or if there is deterioration in the quality of cash flow score. This could result from acquisitions financed with substantially higher levels of holding-company debt or a material change in the partnership’s contractual profile.

It was another red-hot day for the Canadian preferred share market, with PerpetualDiscounts winning 57bp, FixedResets gaining 16bp and DeemedRetractibles up 21bp. Volatility was suitably elevated, with the highlights showing not a single loser, and CGI.PR.D making a monkey out of me by leading the charts with a gain of over 2%, shortly after I opined that it was near the top of its range, so maybe I should consider working for a bank as a volunteer. Volume was on the low side of average.

HIMIPref™ Preferred Indices
These values reflect the December 2008 revision of the HIMIPref™ Indices

Values are provisional and are finalized monthly
Index Mean
Current
Yield
(at bid)
Median
YTW
Median
Average
Trading
Value
Median
Mod Dur
(YTW)
Issues Day’s Perf. Index Value
Ratchet 0.00 % 0.00 % 0 0.00 0 0.0569 % 2,524.3
FixedFloater 0.00 % 0.00 % 0 0.00 0 0.0569 % 3,996.4
Floater 2.99 % 3.10 % 64,272 19.46 4 0.0569 % 2,683.5
OpRet 4.02 % -1.75 % 101,562 0.08 1 0.0000 % 2,748.7
SplitShare 4.25 % 3.83 % 66,490 3.78 5 0.5803 % 3,186.6
Interest-Bearing 0.00 % 0.00 % 0 0.00 0 0.0000 % 2,513.4
Perpetual-Premium 5.45 % -5.99 % 69,486 0.09 19 0.1835 % 2,477.3
Perpetual-Discount 5.13 % 5.06 % 105,992 15.28 16 0.5743 % 2,657.6
FixedReset 4.18 % 3.62 % 167,821 4.59 74 0.1581 % 2,581.1
Deemed-Retractible 4.97 % 0.65 % 101,356 0.16 41 0.2123 % 2,595.6
FloatingReset 2.55 % -1.90 % 65,636 0.08 6 -0.0391 % 2,553.6
Performance Highlights
Issue Index Change Notes
BAM.PR.Z FixedReset 1.04 % YTW SCENARIO
Maturity Type : Call
Maturity Date : 2017-12-31
Maturity Price : 25.00
Evaluated at bid price : 26.35
Bid-YTW : 3.16 %
GWO.PR.I Deemed-Retractible 1.08 % YTW SCENARIO
Maturity Type : Hard Maturity
Maturity Date : 2025-01-31
Maturity Price : 25.00
Evaluated at bid price : 23.36
Bid-YTW : 5.43 %
ELF.PR.G Perpetual-Discount 1.27 % YTW SCENARIO
Maturity Type : Limit Maturity
Maturity Date : 2044-11-04
Maturity Price : 22.05
Evaluated at bid price : 22.40
Bid-YTW : 5.33 %
PWF.PR.S Perpetual-Discount 1.46 % YTW SCENARIO
Maturity Type : Limit Maturity
Maturity Date : 2044-11-04
Maturity Price : 23.96
Evaluated at bid price : 24.35
Bid-YTW : 4.94 %
ELF.PR.F Perpetual-Discount 1.64 % YTW SCENARIO
Maturity Type : Limit Maturity
Maturity Date : 2044-11-04
Maturity Price : 24.55
Evaluated at bid price : 24.80
Bid-YTW : 5.38 %
CGI.PR.D SplitShare 2.04 % YTW SCENARIO
Maturity Type : Soft Maturity
Maturity Date : 2023-06-14
Maturity Price : 25.00
Evaluated at bid price : 26.02
Bid-YTW : 3.29 %
Volume Highlights
Issue Index Shares
Traded
Notes
IFC.PR.C FixedReset 108,689 RBC crossed two blocks of 50,000 each, both at 25.54.
YTW SCENARIO
Maturity Type : Call
Maturity Date : 2016-09-30
Maturity Price : 25.00
Evaluated at bid price : 25.55
Bid-YTW : 3.24 %
ENB.PR.Y FixedReset 73,265 Scotia crossed 50,000 at 24.05.
YTW SCENARIO
Maturity Type : Limit Maturity
Maturity Date : 2044-11-04
Maturity Price : 22.79
Evaluated at bid price : 24.00
Bid-YTW : 4.08 %
ENB.PR.F FixedReset 69,913 RBC crossed 50,000 at 24.85.
YTW SCENARIO
Maturity Type : Limit Maturity
Maturity Date : 2044-11-04
Maturity Price : 23.24
Evaluated at bid price : 24.84
Bid-YTW : 4.02 %
ENB.PR.T FixedReset 52,520 RBC crossed 50,000 at 24.44.
YTW SCENARIO
Maturity Type : Limit Maturity
Maturity Date : 2044-11-04
Maturity Price : 22.99
Evaluated at bid price : 24.45
Bid-YTW : 4.08 %
BNS.PR.Z FixedReset 44,386 RBC crossed 39,900 at 24.78.
YTW SCENARIO
Maturity Type : Hard Maturity
Maturity Date : 2022-01-31
Maturity Price : 25.00
Evaluated at bid price : 24.72
Bid-YTW : 3.22 %
FTS.PR.M FixedReset 36,668 YTW SCENARIO
Maturity Type : Call
Maturity Date : 2019-12-01
Maturity Price : 25.00
Evaluated at bid price : 25.51
Bid-YTW : 3.79 %
There were 27 other index-included issues trading in excess of 10,000 shares.
Wide Spread Highlights
Issue Index Quote Data and Yield Notes
MFC.PR.G FixedReset Quote: 26.10 – 26.70
Spot Rate : 0.6000
Average : 0.3775

YTW SCENARIO
Maturity Type : Call
Maturity Date : 2016-12-19
Maturity Price : 25.00
Evaluated at bid price : 26.10
Bid-YTW : 2.54 %

PVS.PR.C SplitShare Quote: 25.95 – 26.80
Spot Rate : 0.8500
Average : 0.6613

YTW SCENARIO
Maturity Type : Hard Maturity
Maturity Date : 2017-12-10
Maturity Price : 25.00
Evaluated at bid price : 25.95
Bid-YTW : 3.83 %

NEW.PR.D SplitShare Quote: 32.65 – 33.58
Spot Rate : 0.9300
Average : 0.7640

YTW SCENARIO
Maturity Type : Call
Maturity Date : 2015-06-26
Maturity Price : 32.07
Evaluated at bid price : 32.65
Bid-YTW : 2.03 %

MFC.PR.K FixedReset Quote: 25.20 – 25.61
Spot Rate : 0.4100
Average : 0.2467

YTW SCENARIO
Maturity Type : Call
Maturity Date : 2018-09-19
Maturity Price : 25.00
Evaluated at bid price : 25.20
Bid-YTW : 3.73 %

PWF.PR.A Floater Quote: 19.30 – 20.00
Spot Rate : 0.7000
Average : 0.5384

YTW SCENARIO
Maturity Type : Limit Maturity
Maturity Date : 2044-11-04
Maturity Price : 19.30
Evaluated at bid price : 19.30
Bid-YTW : 2.71 %

PWF.PR.G Perpetual-Premium Quote: 25.60 – 25.95
Spot Rate : 0.3500
Average : 0.2181

YTW SCENARIO
Maturity Type : Call
Maturity Date : 2014-12-04
Maturity Price : 25.00
Evaluated at bid price : 25.60
Bid-YTW : -21.02 %

November 3, 2014

Monday, November 3rd, 2014

Lots of demand for Treasuries:

Even with the end of unprecedented bond purchases from the Federal Reserve, demand for U.S. Treasuries looks as strong as ever.

Investors submitted bids for $5.54 trillion of government debt at auctions this year, or 3 times the amount sold, data compiled by Bloomberg show. The bid-to-cover ratio is higher than the 2.87 last year, when the Fed purchased more Treasuries than at any time since the central bank began quantitative easing in 2008, and has been exceeded only twice on record.

Bill Gross advocates loosening fiscal policy, as well as monetary:

Such is the dilemma facing central bankers (and supposedly fiscal authorities) in 2014 and beyond: How to create inflation. They’ve made a damn fine attempt at it – have they not? Four trillion dollars in the U.S., two trillion U.S. dollar equivalents in Japan, and a trillion U.S. dollars coming from the ECB’s Draghi in the eurozone. Not working like it used to, the trillions seem to seep through the sandy loam of investment and innovation straight into the cement mixer of the marketplace. Prices go up, but not the right prices. Alibaba’s stock goes from $68 on opening day to $92 in the first minute, but wages simply sit there for years on end. One economy (the financial one) thrives while the other economy (the real one) withers.

Perhaps sooner rather than later, investors must recognize that modern day inflation, while a necessary condition for survival, is not a sufficient condition for increasing wealth at a rate necessary to satisfy future liabilities associated with education, health care, and a satisfactory retirement. The real economy needs money printing, yes, but money spending more so, and that must come from the fiscal side – from the dreaded government side – where deficits are anathema and balanced budgets are increasingly in vogue. Until then, Grant’s deflation remains a growing possibility – not the kind that creates prosperity but the kind that’s the trouble for prosperity.

I can tell you one group that is all in favour of FX trading hysteria:

Legal expense at JPMorgan in the [quarterly] period was $1.01 billion, tied “in large part” to the currency investigations, Chief Financial Officer Marianne Lake said on Oct. 14.

Loblaw Companies, proud issuer of L.PR.A, has been confirmed by DBRS as Pfd-3:

The confirmations reflect the closing of the acquisition of Shoppers as well as acceptable operating performance in a difficult competitive environment in the core food retail business. In addition, the rating action reflects DBRS’s expectation that the Company will continue with its deleveraging plan set at the time of the Shoppers acquisition, which should result in credit metrics considered acceptable for the current rating by the end of 2015. Loblaw’s ratings continue to be supported by its strong business profile, featuring industry-leading size, scale and market positions in retail and pharmacy across Canada. The ratings incorporate the intense competition in the food retail industry in Canada and the expected decline in financial leverage in the near to medium term, subsequent to the acquisition of Shoppers.

George Weston Limited, proud issuer of WN.PR.A, WN.PR.C, WN.PR.D and WN.PR.E, has been confirmed at Pfd-3 by DBRS:

The confirmations reflect Weston’s stable balance-sheet debt levels despite pressure on the Weston Foods bakery business from higher commodity costs, and the confirmation of the ratings of Loblaw Companies Limited (Loblaw; see separate press release). Weston’s ratings continue to be based on its strong brands, efficient operations and its ownership interest in Loblaw. The ratings also reflect the Weston Foods segment’s exposure to volatile input costs and the mature nature of the bakery industry.

Weston’s financial profile is expected to remain relatively stable going forward based on the Company’s ownership interest in Loblaw, its cash on hand and its stable balance-sheet debt levels. DBRS believes that Weston will continue to use cash on hand and free cash flow generated to invest in growth and/or increase returns to shareholders over the longer term. Weston is likely to remain relatively conservative in the medium term particularly while Loblaw’s leverage remains high resulting from the acquisition of Shoppers Drug Mart Corporation. In the medium term, Weston’s ownership interest in Loblaw could return to above the 50% level as Loblaw is likely to use free cash flow to complete share repurchases once Loblaw completes its deleveraging plan. Over the longer-term DBRS notes that a positive rating action at Loblaw would not necessarily result in a corresponding rating action to Weston.

The Canadian preferred share market was on fire today, with PerpetualDiscount winning 54bp and both FixedResets and DeemedRetractibles up 18bp. Volatility was suitably high. Volume was low.

HIMIPref™ Preferred Indices
These values reflect the December 2008 revision of the HIMIPref™ Indices

Values are provisional and are finalized monthly
Index Mean
Current
Yield
(at bid)
Median
YTW
Median
Average
Trading
Value
Median
Mod Dur
(YTW)
Issues Day’s Perf. Index Value
Ratchet 0.00 % 0.00 % 0 0.00 0 0.3426 % 2,522.8
FixedFloater 0.00 % 0.00 % 0 0.00 0 0.3426 % 3,994.1
Floater 2.99 % 3.11 % 63,496 19.44 4 0.3426 % 2,681.9
OpRet 4.02 % -1.88 % 102,785 0.08 1 0.1965 % 2,748.7
SplitShare 4.27 % 3.89 % 69,226 3.78 5 0.0922 % 3,168.2
Interest-Bearing 0.00 % 0.00 % 0 0.00 0 0.1965 % 2,513.4
Perpetual-Premium 5.46 % -3.75 % 69,519 0.08 19 0.2460 % 2,472.7
Perpetual-Discount 5.16 % 5.08 % 101,808 15.26 16 0.5389 % 2,642.4
FixedReset 4.18 % 3.61 % 167,734 6.46 74 0.1775 % 2,577.0
Deemed-Retractible 4.98 % 1.58 % 99,933 0.16 41 0.1830 % 2,590.1
FloatingReset 2.55 % -4.71 % 67,848 0.08 6 0.1110 % 2,554.6
Performance Highlights
Issue Index Change Notes
TRP.PR.B FixedReset -1.22 % YTW SCENARIO
Maturity Type : Limit Maturity
Maturity Date : 2044-11-03
Maturity Price : 18.69
Evaluated at bid price : 18.69
Bid-YTW : 3.86 %
PWF.PR.R Perpetual-Premium 1.00 % YTW SCENARIO
Maturity Type : Call
Maturity Date : 2021-04-30
Maturity Price : 25.00
Evaluated at bid price : 26.16
Bid-YTW : 4.70 %
BNS.PR.Z FixedReset 1.06 % YTW SCENARIO
Maturity Type : Hard Maturity
Maturity Date : 2022-01-31
Maturity Price : 25.00
Evaluated at bid price : 24.75
Bid-YTW : 3.20 %
PWF.PR.L Perpetual-Discount 1.08 % YTW SCENARIO
Maturity Type : Call
Maturity Date : 2015-10-31
Maturity Price : 25.00
Evaluated at bid price : 25.20
Bid-YTW : 4.34 %
BAM.PF.C Perpetual-Discount 1.15 % YTW SCENARIO
Maturity Type : Limit Maturity
Maturity Date : 2044-11-03
Maturity Price : 21.63
Evaluated at bid price : 21.96
Bid-YTW : 5.58 %
PVS.PR.D SplitShare 1.20 % YTW SCENARIO
Maturity Type : Hard Maturity
Maturity Date : 2021-10-08
Maturity Price : 25.00
Evaluated at bid price : 24.50
Bid-YTW : 4.99 %
BAM.PF.D Perpetual-Discount 1.37 % YTW SCENARIO
Maturity Type : Limit Maturity
Maturity Date : 2044-11-03
Maturity Price : 21.87
Evaluated at bid price : 22.20
Bid-YTW : 5.57 %
MFC.PR.C Deemed-Retractible 1.46 % YTW SCENARIO
Maturity Type : Hard Maturity
Maturity Date : 2025-01-31
Maturity Price : 25.00
Evaluated at bid price : 23.00
Bid-YTW : 5.64 %
MFC.PR.F FixedReset 1.54 % YTW SCENARIO
Maturity Type : Hard Maturity
Maturity Date : 2025-01-31
Maturity Price : 25.00
Evaluated at bid price : 23.10
Bid-YTW : 4.16 %
Volume Highlights
Issue Index Shares
Traded
Notes
GWO.PR.P Deemed-Retractible 115,317 RBC crossed 106,200 at 26.05.
YTW SCENARIO
Maturity Type : Call
Maturity Date : 2020-03-31
Maturity Price : 25.25
Evaluated at bid price : 26.11
Bid-YTW : 4.76 %
TRP.PR.C FixedReset 39,908 Nesbitt crossed 34,400 at 21.60.
YTW SCENARIO
Maturity Type : Limit Maturity
Maturity Date : 2044-11-03
Maturity Price : 21.35
Evaluated at bid price : 21.65
Bid-YTW : 3.63 %
NA.PR.W FixedReset 38,050 Recent new issue.
YTW SCENARIO
Maturity Type : Limit Maturity
Maturity Date : 2044-11-03
Maturity Price : 23.15
Evaluated at bid price : 25.02
Bid-YTW : 3.71 %
ENB.PR.F FixedReset 32,282 Scotia crossed 25,000 at 24.85.
YTW SCENARIO
Maturity Type : Limit Maturity
Maturity Date : 2044-11-03
Maturity Price : 23.24
Evaluated at bid price : 24.85
Bid-YTW : 4.01 %
TD.PF.A FixedReset 31,531 YTW SCENARIO
Maturity Type : Call
Maturity Date : 2019-10-31
Maturity Price : 25.00
Evaluated at bid price : 25.36
Bid-YTW : 3.61 %
CM.PR.E Perpetual-Premium 24,380 YTW SCENARIO
Maturity Type : Call
Maturity Date : 2014-12-03
Maturity Price : 25.00
Evaluated at bid price : 25.24
Bid-YTW : -5.23 %
There were 21 other index-included issues trading in excess of 10,000 shares.
Wide Spread Highlights
Issue Index Quote Data and Yield Notes
TRP.PR.E FixedReset Quote: 25.32 – 26.98
Spot Rate : 1.6600
Average : 0.8947

YTW SCENARIO
Maturity Type : Limit Maturity
Maturity Date : 2044-11-03
Maturity Price : 23.26
Evaluated at bid price : 25.32
Bid-YTW : 3.80 %

CU.PR.G Perpetual-Discount Quote: 22.45 – 23.00
Spot Rate : 0.5500
Average : 0.3262

YTW SCENARIO
Maturity Type : Limit Maturity
Maturity Date : 2044-11-03
Maturity Price : 22.15
Evaluated at bid price : 22.45
Bid-YTW : 5.08 %

NEW.PR.D SplitShare Quote: 32.53 – 33.25
Spot Rate : 0.7200
Average : 0.5820

YTW SCENARIO
Maturity Type : Call
Maturity Date : 2015-06-26
Maturity Price : 32.07
Evaluated at bid price : 32.53
Bid-YTW : 2.61 %

GWO.PR.M Deemed-Retractible Quote: 26.56 – 26.88
Spot Rate : 0.3200
Average : 0.2155

YTW SCENARIO
Maturity Type : Call
Maturity Date : 2015-03-31
Maturity Price : 26.00
Evaluated at bid price : 26.56
Bid-YTW : 1.58 %

GWO.PR.N FixedReset Quote: 21.51 – 21.86
Spot Rate : 0.3500
Average : 0.2490

YTW SCENARIO
Maturity Type : Hard Maturity
Maturity Date : 2025-01-31
Maturity Price : 25.00
Evaluated at bid price : 21.51
Bid-YTW : 4.75 %

TRP.PR.B FixedReset Quote: 18.69 – 18.90
Spot Rate : 0.2100
Average : 0.1292

YTW SCENARIO
Maturity Type : Limit Maturity
Maturity Date : 2044-11-03
Maturity Price : 18.69
Evaluated at bid price : 18.69
Bid-YTW : 3.86 %

BAF Preferred Share Exchange Into BCE Completed

Monday, November 3rd, 2014

BCE Inc. has finally announced:

As a result of the amalgamation of Bell Aliant Preferred Equity Inc. (TSX: BAF) (Prefco), which was approved by preferred shareholders on October 31, 2014 and became effective November 1, 2014, Prefco became a wholly owned subsidiary of Bell Aliant.

Bell Aliant common shares were de-listed from the Toronto Stock Exchange (TSX) on October 31, 2014 and the Bell Aliant preferred shares will be delisted from the TSX at the close of trading today.

Naturally, it would have been far too much work to confirm the consideration given in exchange for the BAF preferreds, so after an annoying search through the website we find:

BCE’s preferred share offer expired at 5:00 pm (Eastern Time) on September 19, 2014. As all conditions of BCE’s preferred share offer have been satisfied, the BCE preferred shares exchanged for tendered Bell Aliant preferred shares were issued on September 24, 2014 and commenced trading on the Toronto Stock Exchange at the open of trading on the next day.
On October 3, 2014, BCE announced that the company has entered into an agreement with Bell Aliant Preferred Equity Inc. (TSX: BAF) (Prefco) to effect an amalgamation of Prefco with a newly incorporated, wholly owned subsidiary of BCE. Upon implementation:

  • holders of Prefco preferred shares (other than shareholders who properly exercise their right of dissent in respect of the amalgamation) will receive for their shares the same consideration as was paid by BCE for preferred shares pursuant to the preferred share offer; and
  • Prefco will become a wholly owned subsidiary of BCE.

A special meeting of the Prefco preferred shareholders will be held on October 31, 2014 at 9:30 am (Atlantic Time) to consider the amalgamation. BCE intends to vote all of the preferred shares that it owned as of September 30, 2014, the record date for the meeting, in favour of the amalgamation, which will be sufficient to approve the amalgamation and complete the privatization of Prefco.

The notice of meeting, accompanying management information circular and related meeting material, which contain full details of the amalgamation, was mailed to Prefco preferred shareholders early in October. The meeting material is also available on SEDAR at www.sedar.com and on EDGAR at www.sec.gov.

Because the jerk who approved this press release is a moron, this STILL doesn’t give the details of the consideration, so we reach back into the files to find the following table:

:

BCE / BAF Preferred Share Exchange
BCE Ticker Description BAF Ticker
BCE.PR.M FixedReset
4.85%+209
BAF.PR.A
BCE.PR.O FixedReset
4.55%+309
BAF.PR.C
BCE.PR.Q FixedReset
4.25%+264
BAF.PR.E

Golly, republishing that table was a lot of work! I think I’ll take a few vacation weeks and spend my bonus. On the bright side, the BCE preferred share web page has finally been updated and, even better, there is confirmation from DBRS:

DBRS has today discontinued Bell Aliant Preferred Equity Inc.’s (Bell Aliant) preferred share ratings following their delisting as part of Bell Aliant Inc.’s privatization. This rating action removes Bell Aliant’s preferred shares from Under Review with Positive Implications.

On July 23, 2014, BCE Inc. (BCE) announced it would privatize its Bell Aliant Inc. affiliate by acquiring the interest of public minority shareholders for consideration of approximately $3.95 billion. DBRS subsequently placed Bell Aliant’s preferred shares Under Review with Positive Implications based on the stronger credit profile of BCE/Bell Canada. The transaction closed on October 31, 2014.

As part of BCE’s tender offer to acquire the minority interest in Bell Aliant Inc., BCE exchanged all of the issued and outstanding Series A Preferred Shares, Series C Preferred Shares and Series E Preferred Shares at Bell Aliant Preferred Equity Inc. on the basis of (a) one BCE Series AM Preferred Share for each Series A Preferred Share; (b) one BCE Series AO Preferred Share for each Series C Preferred Share; and (c) one BCE Series AQ Preferred Share for each Series E Preferred Share. Bell Aliant’s preferred shares were delisted from the TSX at the close of trading on November 3, 2014.

The Implied Volatility calculation actually looks pretty good:

ImpVol_BCE_141103
Click for Big

MAPF Performance: October, 2014

Sunday, November 2nd, 2014

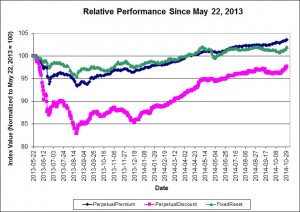
The fund outperformed slightly in October
relPerf_141031
Click for Big

relYield_141031Click for Big

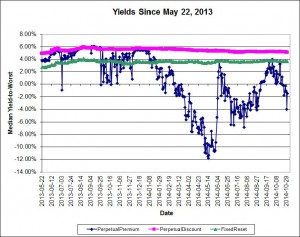
I continue to believe that the decline in the preferred share market remains overdone; the following table shows the increase in yields since May 22, 2013, of some fixed income sectors:

Yield Changes
May 22, 2013
to
October 31, 2014
Sector Yield
May 22
2013
Yield
October 31
2014
Change
Five-Year Canadas 1.38% 1.54% +16bp
Long Canadas 2.57% 2.59% +2bp
Long Corporates 4.15% 4.2% +5bp
FixedResets
Investment Grade
(Interest Equivalent)
3.51% 4.71% +120bp
Perpetual-Discounts
Investment Grade
(Interest Equivalent)
6.34% 6.62% +28bp
The change in yield of PerpetualDiscounts is understated due a massive influx of issues from the PerpetualPremium sub-index over the period, which improved credit quality. When the four issues that comprised the PerpetualDiscount sub-index as of May 22, 2013 are evaluated as of October 31, 2014, the interest-equivalent yield is 7.23% and thus the change is +89bp.

ZPR, is an ETF comprised of FixedResets and Floating Rate issues and a very high proportion of junk issues, returned +%, +% and +% over the past one-, three- and twelve-month periods, respectively (according to the fund’s data), versus returns for the TXPL index of +0.06%, +0.01% and +5.67% respectively. The fund has been able to attract assets of about $1,095-million since inception in November 2012; AUM increased by $21-million in October; given an index return of +0.06% an increase of less than $1-million was expected, indicating that money is still flowing into the fund. I feel that the flows into and out of this fund are very important in determining the performance of its constituents.

TXPR had returns over one- and three-months of +0.51% and +0.57%, respectively with CPD performance within expectations.

Returns for the HIMIPref™ investment grade sub-indices for October were as follows:

HIMIPref™ Indices
Performance to October 30, 2014
Sub-Index 1-Month 3-month
Ratchet -6.19% N/A
FixFloat N/A N/A
Floater -3.56% -0.87%
OpRet +0.51% +0.97%
SplitShare +0.12% +1.37%
Interest N/A N/A
PerpetualPremium +0.93% +1.42%
PerpetualDiscount +1.48% +1.62%
FixedReset +0.65% +0.51%
DeemedRetractible +0.93% +1.17%
FloatingReset +0.42% +1.47%

Malachite Aggressive Preferred Fund’s Net Asset Value per Unit as of the close October 31, 2014, was $10.5270.

Returns to October 31, 2014
Period MAPF BMO-CM “50” Index TXPR
Total Return
CPD – according to Blackrock
One Month +0.64% +0.51% +0.51% N/A
Three Months +0.89% +0.38% +0.57% N/A
One Year +9.50% +4.48% +6.08% +5.61%
Two Years (annualized) +4.00% +2.38% +2.34% N/A
Three Years (annualized) +6.34% +3.65% +3.53% +3.03%
Four Years (annualized) +5.34% +4.34% +3.76% N/A
Five Years (annualized) +8.34% +6.25% +5.37% +4.73%
Six Years (annualized) +16.52% +8.09% +7.08%  
Seven Years (annualized) +13.06% +4.93% +3.98%  
Eight Years (annualized) +10.91% +3.64%    
Nine Years (annualized) +10.39% +3.80%    
Ten Years (annualized) +9.99% +3.82%    
Eleven Years (annualized) +10.47% +3.98%    
Twelve Years (annualized) +11.72% +4.26%    
Thirteen Years (annualized) +10.67% +4.20%    
MAPF returns assume reinvestment of distributions, and are shown after expenses but before fees.
CPD Returns are for the NAV and are after all fees and expenses.
* CPD does not directly report its two- or four-year returns.
Figures for National Bank Preferred Equity Income Fund (formerly Omega Preferred Equity) (which are after all fees and expenses) for 1-, 3- and 12-months are +0.60%, +0.93% and +6.05%, respectively, according to Morningstar after all fees & expenses. Three year performance is +3.94%; five year is +5.76%
Figures for Jov Leon Frazer Preferred Equity Fund Class I Units (which are after all fees and expenses) for 1-, 3- and 12-months are -0.08%, -0.38% and +2.48% respectively, according to Morningstar. Three Year performance is +1.05%; five-year is +2.88%
Figures for Manulife Preferred Income Fund (formerly AIC Preferred Income Fund) (which are after all fees and expenses) for 1-, 3- and 12-months are -%, +% & +%, respectively. Three Year performance is +%; five-year is +%
Figures for Horizons AlphaPro Preferred Share ETF (which are after all fees and expenses) for 1-, 3- and 12-months are +0.48%, +0.66% & +5.86%, respectively. Three year performance is +4.42%
Figures for National Bank Preferred Equity Fund (formerly Altamira Preferred Equity Fund) are +0.37%, +0.43% and +4.62% for one-, three- and twelve months, respectively.
The figure for BMO S&P/TSX Laddered Preferred Share Index ETF is =0.01%, -0.23% and +5.03% for one-, three- and twelve-months, respectively.
Figures for NexGen Canadian Preferred Share Tax Managed Fund (Dividend Tax Credit Class, the best performing) are +%, +% and +% for one-, three- and twelve-months, respectively.
Figures for BMO Preferred Share Fund are +0.69% and +3.62% for the past three- and twelve-months, respectively.

MAPF returns assume reinvestment of dividends, and are shown after expenses but before fees. Past performance is not a guarantee of future performance. You can lose money investing in Malachite Aggressive Preferred Fund or any other fund. For more information, see the fund’s main page. The fund is available either directly from Hymas Investment Management or through a brokerage account at Odlum Brown Limited.

A problem that has bedevilled the market over the past two years has been the OSFI decision not to grandfather Straight Perpetuals as Tier 1 bank capital, and their continued foot-dragging regarding a decision on insurer Straight Perpetuals has segmented the market to the point where trading has become much more difficult. The fund occasionally finds an attractive opportunity to trade between GWO issues, which have a good range of annual coupons (but in which trading is now hampered by the fact that the low-coupon issues are trading near par and are callable at par in the near term), but is “stuck” in the MFC and SLF issues, which have a much narrower range of coupon, while the IAG DeemedRetractibles are quite illiquid. Until the market became so grossly segmented, this was not so much of a problem – but now banks are not available to swap into (because they are so expensive) and non-regulated companies are likewise deprecated (because they are not DeemedRetractibles; they should not participate in the increase in value that will follow the OSFI decision I anticipate and, in addition, are analyzed as perpetuals). The fund’s portfolio is, in effect ‘locked in’ to the MFC & SLF issues due to projected gains from a future OSFI decision, to the detriment of trading gains particularly in May, 2013, when the three lowest-coupon SLF DeemedRetractibles (SLF.PR.C, SLF.PR.D and SLF.PR.E) were the worst performing DeemedRetractibles in the sub-index, and in June, 2013, when the insurance-issued DeemedRetractibles behaved like PerpetualDiscounts in a sharply negative market.

However, it will be noted, as discussed in the August report on Portfolio Composition that the month saw some swaps from the low-coupon SLF Straights to a low-spread SLF FixedReset … so there are some opportunities to trade, although they don’t happen often! There were similar swaps executed in June and July.

In October, insurance DeemedRetractibles outperformed bank DeemedRetractibles:
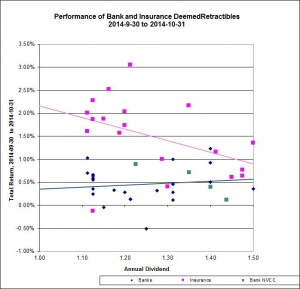
DRPerf_141031
Click for Big

… and were about equal to Unregulated Straight Perpetuals.
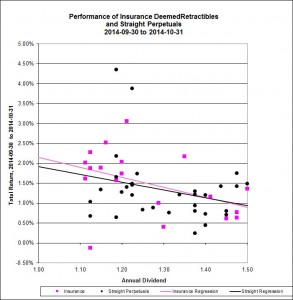
StraightPerf_141031
Click for Big

Of the regressions shown in the above two charts, the Adjusted Correlation of the Bank DeemedRetractible performance is slightly negative, Straight Perpetuals come in at 4% and Insurance DeemedRetractibles are at 14%.

A lingering effect of the downdraft of 2013 has been the return of measurable Implied Volatility (all Implied Volatility calculations use bids from October 31):
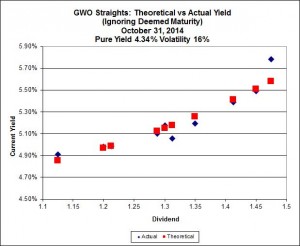
ImpVol_GWO_141031
Click for Big

ImpVol_PWF_141031
Click for Big

However, while the fit for PWF is good and the Implied Volatility is high, there are many local minima for the spread:
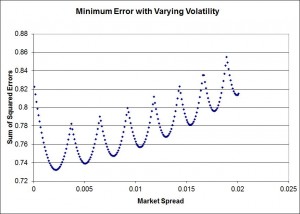
ImpVol_PWF_141031_fit_varVol
Click for Big

ImpVol_PWF_141031_fit_varSpread
Click for Big

Implied Volatility of
Two Series of Straight Perpetuals
October 31, 2014
Issuer Pure Yield Implied Volatility
GWO 4.34% (-0.35) 16% (+2)
PWF 0.22% (-0.79) 40% (+3)
Bracketted figures are changes since September month-end

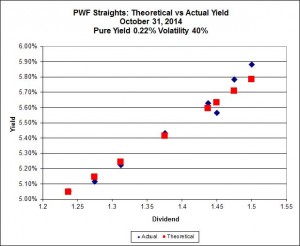
It is disconcerting to see the difference between GWO and PWF; if anything, we would expect the implied volatility for GWO to be higher, given that the DeemedRetraction – not yet given significant credence by the market – implies a directionality in prices. On the other hand, the PWF issues are mostly trading above par, which in practice tends to add directionality although this makes no sense. The GWO data with the best fit derived for PWF is distinguishable from the best fit; the best fit has a lower Sum of Squared Errors (1.44 vs. 2.94):
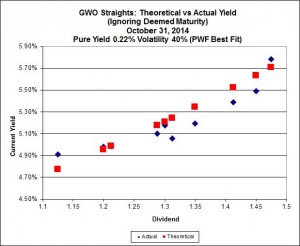
ImpVol_GWO_141031_PWFfit
Click for Big

In the September, 2013, edition of PrefLetter, I extended the theory of Implied Volatility to FixedResets – relating the option feature of the Issue Reset Spreads to a theoretical non-callable Market Spread.
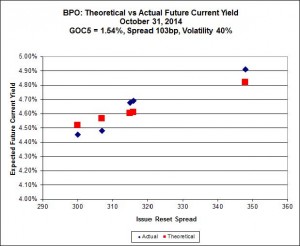
ImpVol_BPO_141031
Click for Big

ImpVol_FFH_141031
Click for Big

Implied Volatility of
Two Series of FixedResets
August 29, 2014
Issuer Market Reset Spread
(Non-Callable)
Implied Volatility
BPO 103bp (+2) 40% (0)
FFH 316bp (-5) 8% (-1)
Bracketted figures are changes since September month-end

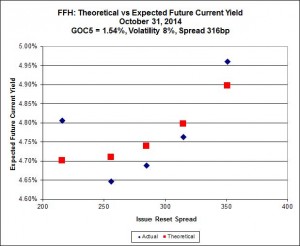
These are very interesting results: The BPO issues are trading as if calls are a certainty, while FFH issues are trading as if calls are much less likely; this is probably due to the market’s over-reacting to the fact that all of the BPO issues are trading above par, while only one of the five FFH issues shares that happy status. The FFH series continues to be perplexing, this time with the four lower-coupon issues showing virtually no implied volatility – with the highest coupon issue (FFH.PR.K) being well off the mark … all I can think of is that the market has decided that FFH.PR.K, with an Issue Reset Spread of 351bp, is sure to be called in 2017, while the other four (highest spread is FFH.PR.C, +315) are not at all likely to be called. Note that FFH.PR.C will have its first Reset Date on 2014-12-31 and it would appear, given its bid of 24.62, that the market expects a reset rather than a call for redemption.

The Implied Volatility calculation for the TRP FixedResets is most interesting:
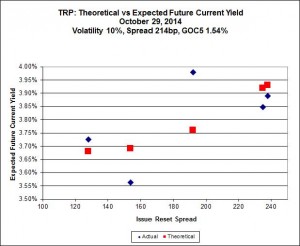
ImpVol_TRP_141031Click for Big

According to this calculation, TRP.PR.A is $1.26 cheap to theory, being bid at 21.74 compared to a theoretical price of 23.00. A portion of this difference is due to the approximations that have gone into the calculation, which assumes that all issues have three years to their call date and, critically, are all paying their long-term dividend rate right now. In an environment in which, given a GOC5 yield of 1.54%, virtually all dividend rates are expected to drop on reset, the time to reset and the degree of difference in the interim is important.

We can make some approximate adjustments to the theoretical prices:

Issue Current Rate Issue Reset Spread Next Reset Date Expected Future Rate Total Gross Difference
TRP.PR.A $1.15 192bp 2014-12-31 $0.865 $0.07
TRP.PR.B $1.00 128bp 2015-6-30 $0.705 $0.22
TRP.PR.C $1.10 154bp 2016-1-30 $0.77 $0.33
TRP.PR.D $1.00 238bp 2019-4-30 $0.98 $0.09
TRP.PR.E $1.0625 235bp <2019-10-30 $0.9725 $0.47

So a more precise calculation could be performed by subtracting $0.07 from the actual bid of TRP.PR.A, since the calculation otherwise assumes the last dividend payment before reset will be $0.865/4 instead of $1.15/4; if we assume that the market is accounting for this, then subtraction of the excess from the market price will give a first-order approximation of what the market is actually paying for the expected future dividend stream (with the difference left undiscounted! That’s just another complication!).

However, making these adjustments doesn’t change the situation much, which is why I usually can’t be bothered:
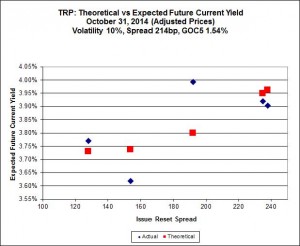
ImpVol_TRP_141031_adjusted
Click for Big

And, with these adjustments, we still find that TRP.PR.A is cheap to theory, with an adjusted actual price of 21.67 compared to a theoretical price of $22.77 – so the adjusted calculation shows it being $1.10 cheap to theory, compared to the unadjusted calculation’s figure of $1.26 cheap to theory.

I suspect that the market is simply over-reacting to an expected change in dividends that is both significant and imminent. It will be most interesting to learn, as more data becomes accumulated, whether this is always the case, for junk FixedResets as well as investment-grade, for expected increases as well as decreases.

Those of you who have been paying attention will remember that in a “normal” market (which we have not seen in well over a year) the slope of this line is related to the implied volatility of yields in Black-Scholes theory, as discussed in the January, 2010, edition of PrefLetter. As has been previously noted, very high levels of Implied Volatility (in the 40% range, at which point the calculation may be considered virtually meaningless) imply a very strong expectation of directionality in future prices – i.e, an expectation that all issues will be redeemed at par.

It is significant that the preferred share market knows no moderation. I suggest that a good baseline estimate for Volatility over a three year period is 15% but the observed figure is generally higher in a rising market and lower in a declining one … with, of course, a period of adjustment in between, which I suspect we are currently experiencing.

Sometimes everything works … sometimes it’s 50-50 … sometimes nothing works. The fund seeks to earn incremental return by selling liquidity (that is, taking the other side of trades that other market participants are strongly motivated to execute), which can also be referred to as ‘trading noise’ – although for quite some time, noise trading has taken a distant second place to the sectoral play on insurance DeemedRetractibles; something that dismays me, particularly given that the market does not yet agree with me regarding the insurance issues! There were a lot of strongly motivated market participants during the Panic of 2007, generating a lot of noise! Unfortunately, the conditions of the Panic may never be repeated in my lifetime … but the fund will simply attempt to make trades when swaps seem profitable, without worrying about the level of monthly turnover.

There’s plenty of room for new money left in the fund. I have shown in PrefLetter that market pricing for FixedResets is very often irrational and I have lots of confidence – backed up by my bond portfolio management experience in the markets for Canadas and Treasuries, and equity trading on the NYSE & TSX – that there is enough demand for liquidity in any market to make the effort of providing it worthwhile (although the definition of “worthwhile” in terms of basis points of outperformance changes considerably from market to market!) I will continue to exert utmost efforts to outperform but it should be borne in mind that there will almost inevitably be periods of underperformance in the future.

The yields available on high quality preferred shares remain elevated, which is reflected in the current estimate of sustainable income.

Calculation of MAPF Sustainable Income Per Unit
Month NAVPU Portfolio
Average
YTW
Leverage
Divisor
Securities
Average
YTW
Capital
Gains
Multiplier
Sustainable
Income
per
current
Unit
June, 2007 9.3114 5.16% 1.03 5.01% 1.3240 0.3524
September 9.1489 5.35% 0.98 5.46% 1.3240 0.3773
December, 2007 9.0070 5.53% 0.942 5.87% 1.3240 0.3993
March, 2008 8.8512 6.17% 1.047 5.89% 1.3240 0.3938
June 8.3419 6.034% 0.952 6.338% 1.3240 $0.3993
September 8.1886 7.108% 0.969 7.335% 1.3240 $0.4537
December, 2008 8.0464 9.24% 1.008 9.166% 1.3240 $0.5571
March 2009 $8.8317 8.60% 0.995 8.802% 1.3240 $0.5872
June 10.9846 7.05% 0.999 7.057% 1.3240 $0.5855
September 12.3462 6.03% 0.998 6.042% 1.3240 $0.5634
December 2009 10.5662 5.74% 0.981 5.851% 1.1141 $0.5549
March 2010 10.2497 6.03% 0.992 6.079% 1.1141 $0.5593
June 10.5770 5.96% 0.996 5.984% 1.1141 $0.5681
September 11.3901 5.43% 0.980 5.540% 1.1141 $0.5664
December 2010 10.7659 5.37% 0.993 5.408% 1.0298 $0.5654
March, 2011 11.0560 6.00% 0.994 5.964% 1.0298 $0.6403
June 11.1194 5.87% 1.018 5.976% 1.0298 $0.6453
September 10.2709 6.10%
Note
1.001 6.106% 1.0298 $0.6090
December, 2011 10.0793 5.63%
Note
1.031 5.805% 1.0000 $0.5851
March, 2012 10.3944 5.13%
Note
0.996 5.109% 1.0000 $0.5310
June 10.2151 5.32%
Note
1.012 5.384% 1.0000 $0.5500
September 10.6703 4.61%
Note
0.997 4.624% 1.0000 $0.4934
December, 2012 10.8307 4.24% 0.989 4.287% 1.0000 $0.4643
March, 2013 10.9033 3.87% 0.996 3.886% 1.0000 $0.4237
June 10.3261 4.81% 0.998 4.80% 1.0000 $0.4957
September 10.0296 5.62% 0.996 5.643% 1.0000 $0.5660
December, 2013 9.8717 6.02% 1.008 5.972% 1.0000 $0.5895
March, 2014 10.2233 5.55% 0.998 5.561% 1.0000 $0.5685
June 10.5877 5.09% 0.998 5.100% 1.0000 $0.5395
September 10.4601 5.28% 0.997 5.296% 1.0000 $0.5540
October, 2014 10.5270 5.27% 0.997 5.286% 1.0000 $0.5565
NAVPU is shown after quarterly distributions of dividend income and annual distribution of capital gains.
Portfolio YTW includes cash (or margin borrowing), with an assumed interest rate of 0.00%
The Leverage Divisor indicates the level of cash in the account: if the portfolio is 1% in cash, the Leverage Divisor will be 0.99
Securities YTW divides “Portfolio YTW” by the “Leverage Divisor” to show the average YTW on the securities held; this assumes that the cash is invested in (or raised from) all securities held, in proportion to their holdings.
The Capital Gains Multiplier adjusts for the effects of Capital Gains Dividends. On 2009-12-31, there was a capital gains distribution of $1.989262 which is assumed for this purpose to have been reinvested at the final price of $10.5662. Thus, a holder of one unit pre-distribution would have held 1.1883 units post-distribution; the CG Multiplier reflects this to make the time-series comparable. Note that Dividend Distributions are not assumed to be reinvested.
Sustainable Income is the resultant estimate of the fund’s dividend income per current unit, before fees and expenses. Note that a “current unit” includes reinvestment of prior capital gains; a unitholder would have had the calculated sustainable income with only, say, 0.9 units in the past which, with reinvestment of capital gains, would become 1.0 current units.
DeemedRetractibles are comprised of all Straight Perpetuals (both PerpetualDiscount and PerpetualPremium) issued by BMO, BNS, CM, ELF, GWO, HSB, IAG, MFC, NA, RY, SLF and TD, which are not exchangable into common at the option of the company (definition refined in May, 2011). These issues are analyzed as if their prospectuses included a requirement to redeem at par on or prior to 2022-1-31 (banks) or 2025-1-31 (insurers and insurance holding companies), in addition to the call schedule explicitly defined. See OSFI Does Not Grandfather Extant Tier 1 Capital, CM.PR.D, CM.PR.E, CM.PR.G: Seeking NVCC Status and the January, February, March and June, 2011, editions of PrefLetter for the rationale behind this analysis.
Yields for September, 2011, to January, 2012, were calculated by imposing a cap of 10% on the yields of YLO issues held, in order to avoid their extremely high calculated yields distorting the calculation and to reflect the uncertainty in the marketplace that these yields will be realized. From February to September 2012, yields on these issues have been set to zero. All YLO issues held were sold in October 2012.

Significant positions were held in DeemedRetractible, SplitShare and FixedReset issues on October 31; all of these currently have their yields calculated with the presumption that they will be called by the issuers at par prior to 2022-1-31 (banks) or 2025-1-31 (insurers and insurance holding companies) or on a different date (SplitShares) This presents another complication in the calculation of sustainable yield, which also assumes that redemption proceeds will be reinvested at the same rate.

I no longer show calculations that assume the conversion of the entire portfolio into PerpetualDiscounts, as the fund has only a small position in these issues.

I will also note that the sustainable yield calculated above is not directly comparable with any yield calculation currently reported by any other preferred share fund as far as I am aware. The Sustainable Yield depends on:
i) Calculating Yield-to-Worst for each instrument and using this yield for reporting purposes;
ii) Using the contemporary value of Five-Year Canadas (set at 1.49% for the October 31 calculation) to estimate dividends after reset for FixedResets.

Most funds report Current Yield. For instance, ZPR reports a “Dividend Yield” of 4.5% as of August 29, 2014, but this is the Current Yield, a meaningless number. The Current Yield of MAPF was 4.89% as of August 29, but I will neither report that with any degree of prominence nor take any great pleasure in the fact that it’s a little higher than the ZPR number. It’s meaningless; to discuss it in the context of portfolio reporting is misleading.

However, BMO has taken a significant step forward in that they are no longer reporting the “Portfolio Yield” directly on their website; the information is taken from the “Enhanced Fund Profile” which is available only as a PDF link. CPD doesn’t report this metric on the CPD fact sheet or on their website. I may have one less thing to mock the fundcos about!

It should be noted that the concept of this Sustainable Income calculation was developed when the fund’s holdings were overwhelmingly PerpetualDiscounts – see, for instance, the bottom of the market in November 2008. It is easy to understand that for a PerpetualDiscount, the technique of multiplying yield by price will indeed result in the coupon – a PerpetualDiscount paying $1 annually will show a Sustainable Income of $1, regardless of whether the price is $24 or $17.

Things are not quite so neat when maturity dates and maturity prices that are different from the current price are thrown into the mix. If we take a notional Straight Perpetual paying $5 annually, the price is $100 when the yield is 5% (all this ignores option effects). As the yield increases to 6%, the price declines to 83.33; and 83.33 x 6% is the same $5. Good enough.

But a ten year bond, priced at 100 when the yield is equal to its coupon of 5%, will decline in price to 92.56; and 92.56 x 6% is 5.55; thus, the calculated Sustainable Income has increased as the price has declined as shown in the graph:
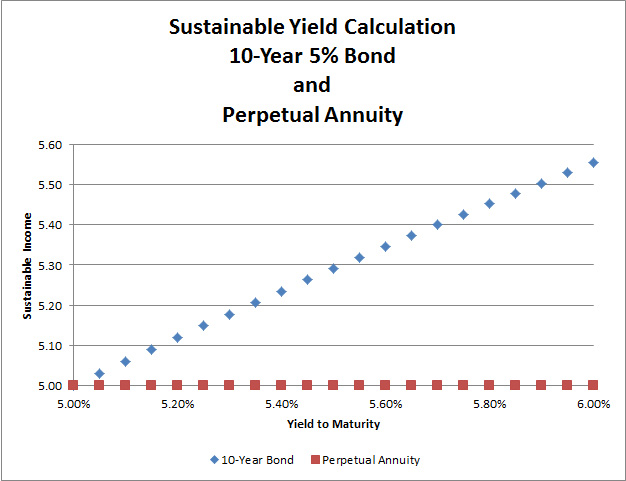

Click for Big

The difference is because the bond’s yield calculation includes the amortization of the discount; therefore, so does the Sustainable Income estimate.

Different assumptions lead to different results from the calculation, but the overall positive trend is apparent. I’m very pleased with the long-term results! It will be noted that if there was no trading in the portfolio, one would expect the sustainable yield to be constant (before fees and expenses). The success of the fund’s trading is showing up in

  • the very good performance against the index
  • the long term increases in sustainable income per unit

As has been noted, the fund has maintained a credit quality equal to or better than the index; outperformance has generally been due to exploitation of trading anomalies.

Again, there are no predictions for the future! The fund will continue to trade between issues in an attempt to exploit market gaps in liquidity, in an effort to outperform the index and keep the sustainable income per unit – however calculated! – growing.
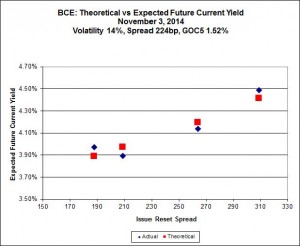
MAPF Portfolio Composition: October 2014

Sunday, November 2nd, 2014

Turnover slowed in October to about 5%.

There is extreme segmentation in the marketplace, with OSFI’s NVCC rule changes in February 2011 having had the effect of splitting the formerly relatively homogeneous Straight Perpetual class of preferreds into three parts:

  • Unaffected Straight Perpetuals
  • DeemedRetractibles explicitly subject to the rules (banks)
  • DeemedRetractibles considered by me, but not (yet!) by the market, to be likely to be explicitly subject to the rules in the future (insurers and insurance holding companies)

This segmentation, and the extreme valuation differences between the segments, has cut down markedly on the opportunities for trading. Another trend that hasn’t helped was the migration of PerpetualDiscounts into PerpetualPremiums (due to price increases) in early 2013 – many of the PerpetualPremiums had negative Yields-to-Worst and those that don’t aren’t particularly thrilling; speaking very generally, PerpetualPremiums are to be avoided, not traded! While market weakness since the peak of the PerpetualDiscount subindex in May, 2013, has mitigated the situation somewhat, the population of PerpetualDiscounts is still exceeded by that of PerpetualPremiums – most of which are trading at a negative Yield-to-Worst.

To make this more clear, it used to be that there were 70-odd Straight Perpetuals and I was more or less indifferent as to which ones I owned (subject, of course, to issuer concentration concerns and other risk management factors). Thus, if any one of these 70 were to go down in price by – say – $0.25, I would quite often have something in inventory that I’d be willing to swap for it. The segmentation means that I am no longer indifferent; in addition to checking the valuation of a potential buy to other Straights, I also have to check its peer group. This cuts down on the potential for trading.

There is no real hope that this situation will be corrected in the near-term. OSFI has indicated that the long-promised “Draft Definition of Capital” for insurers will not be issued “for public consultation in late 2012 or early 2013”, as they fear that it might encourage speculation in the marketplace. It is not clear why OSFI is so afraid of informed speculation, since the constant speculation in the marketplace is currently less informed than it would be with a little bit of regulatory clarity.

As a result of this delay, I have extended the Deemed Maturity date for insurers and insurance holding companies by three years (to 2025-1-31), in the expectation that when OSFI finally does provide clarity, they will allow the same degree of lead-in time for these companies as they did for banks. This had a major effect on the durations of preferred shares subject to the change but, fortunately, not much on their calculated yields as most of these issues were either trading near par when the change was made or were trading at sufficient premium that a par call was expected on economic grounds. However, with the declines in the market over the past nine months, the expected capital gain on redemption of the insurance-issued DeemedRetractibles has become an important component of the calculated yield.

Due to further footdragging by OSFI, I will be extending the DeemedMaturity date for insurance issues by another two years in the near future.

Sectoral distribution of the MAPF portfolio on October 31 was as follows:

MAPF Sectoral Analysis 2014-10-31
HIMI Indices Sector Weighting YTW ModDur
Ratchet 0% N/A N/A
FixFloat 0% N/A N/A
Floater 0% N/A N/A
OpRet 0% N/A N/A
SplitShare 2.1%(-3.0) 3.55% 7.32
Interest Rearing 0% N/A N/A
PerpetualPremium 0% N/A N/A
PerpetualDiscount 20.3% (+3.9) 5.33% 14.90
Fixed-Reset 23.0% (-0.4) 4.47% 10.10
Deemed-Retractible 44.4% (-0.1) 5.64% 8.00
Scraps (Various) 10.0% (-0.2) 5.80% 10.93
Cash 0.3% (0) 0.00% 0.00
Total 100% 5.27% 10.14
Totals and changes will not add precisely due to rounding. Bracketted figures represent change from September month-end. Cash is included in totals with duration and yield both equal to zero.
DeemedRetractibles are comprised of all Straight Perpetuals (both PerpetualDiscount and PerpetualPremium) issued by BMO, BNS, CM, ELF, GWO, HSB, IAG, MFC, NA, RY, SLF and TD, which are not exchangable into common at the option of the company. These issues are analyzed as if their prospectuses included a requirement to redeem at par on or prior to 2022-1-31 (banks) or 2025-1-3 (insurers and insurance holding companies), in addition to the call schedule explicitly defined. See OSFI Does Not Grandfather Extant Tier 1 Capital, CM.PR.D, CM.PR.E, CM.PR.G: NVCC Status Confirmed and the January, February, March and June, 2011, editions of PrefLetter for the rationale behind this analysis. (all recent editions have a short summary of the argument included in the “DeemedRetractible” section)

Note that the estimate for the time this will become effective for insurers and insurance holding companies was extended by three years in April 2013, due to the delays in OSFI’s providing clarity on the issue.

The “total” reflects the un-leveraged total portfolio (i.e., cash is included in the portfolio calculations and is deemed to have a duration and yield of 0.00.). MAPF will often have relatively large cash balances, both credit and debit, to facilitate trading. Figures presented in the table have been rounded to the indicated precision.

There was a shift during the month from SplitShares (selling CGI.PR.D, mostly in the range of 25.25-30) into PerpetualDiscounts (CU.PR.F and CU.PR.G, in the range of 21.20-27). While CGI.PR.D has shown surprising strength since the sales, closing the month at a bid of 25.52, I find it difficult to believe they will increase any more, given that this bid implies a yield to maturity of 3.55%. The trade was a little worse than break-even at month-end, given bids for CU.PR.F and CU.PR.G of 22.40 and 22.48, respectively, but by no worse than normal transaction costs.

Credit distribution is:

MAPF Credit Analysis 2014-10-31
DBRS Rating Weighting
Pfd-1 0 (0)
Pfd-1(low) 25.0% (-3.0)
Pfd-2(high) 50.9% (+2.8)
Pfd-2 0%
Pfd-2(low) 13.8% (+0.4)
Pfd-3(high) 0.8% (+0.1)
Pfd-3 4.5% (+0.8)
Pfd-3(low) 3.6% (0)
Pfd-4(high) 0.7% (0)
Pfd-4 0%
Pfd-4(low) 0% (-0.9)
Pfd-5(high) 0% (0)
Pfd-5 0.5% (-0.1)
Cash 0.3% (0)
Totals will not add precisely due to rounding. Bracketted figures represent change from September month-end.
The fund holds a position in AZP.PR.B, which is rated P-5 by S&P and is unrated by DBRS

Liquidity Distribution is:

MAPF Liquidity Analysis 2014-10-31
Average Daily Trading Weighting
<$50,000 13.4% (-2.9)
$50,000 – $100,000 4.7% (-0.1)
$100,000 – $200,000 79.2% (-16.0)
$200,000 – $300,000 2.5% (-11.8)
>$300,000 0% (-1.1)
Cash 0.3% (-1.3)
Totals will not add precisely due to rounding. Bracketted figures represent change from September month-end.

MAPF is, of course, Malachite Aggressive Preferred Fund, a “unit trust” managed by Hymas Investment Management Inc. Further information and links to performance, audited financials and subscription information are available the fund’s web page. The fund may be purchased either directly from Hymas Investment Management or through a brokerage account at Odlum Brown Limited. A “unit trust” is like a regular mutual fund, but is sold by offering memorandum rather than prospectus. This is cheaper, but means subscription is restricted to “accredited investors” (as defined by the Ontario Securities Commission) or those who subscribe for $150,000+. Fund past performances are not a guarantee of future performance. You can lose money investing in MAPF or any other fund.

A similar portfolio composition analysis has been performed on the Claymore Preferred Share ETF (symbol CPD) (and other funds) as of August 31, 2012, and published in the October (mainly methodology), November (most funds), and December (ZPR) 2012, PrefLetter. While direct comparisons are difficult due to the introduction of the DeemedRetractible class of preferred share (see above) it is fair to say:

  • MAPF credit quality is better
  • MAPF liquidity is a bit lower
  • MAPF Yield is higher
  • Weightings
    • MAPF is much more exposed to DeemedRetractibles
    • MAPF is much less exposed to Operating Retractibles
    • MAPF is much more exposed to SplitShares
    • MAPF is less exposed to FixFloat / Floater / Ratchet
    • MAPF weighting in FixedResets is much lower