Here’s bit of an update on the persecution of Navinder Singh Sarao:
Sarao’s lawyer, James Lewis, disclosed the existence of a worldwide freezing order on his client’s assets that precludes him from raising the 5 million-pound ($7.6 million) bail.
Sarao has been “languishing on remand unable to meet” the bail conditions, and it’s “impossible to supply the security,” because of the freezing order, Lewis said. He also unsuccessfully applied to have a blanket ban on Internet use amended to only restrict him from trading, arguing a complete prohibition was “manifestly disproportionate.”
Sarao has been in custody since April 21, when he was arrested at the house he shares with his parents near Heathrow airport. He is being held at Wandsworth prison in London while fighting extradition to the U.S.
Roscoe rejected a request to release Sarao solely on a 50,000 pound-security put up by his parents, saying the bail amount had to satisfy her that he isn’t a flight risk.
Yep, that’s the way to do it! Set bail to a ludicrously high amount, then freeze the guy’s assets so he can’t possibly put up the money! As noted on May 1, the most recent penalty for spoofing was a sixty day trading suspension. But Sarao’s offence was blatant? Yeah, right, that’s why it took five years to find it, and why it got no mention whatsoever in the SEC report.
Selective enforcement is an affront to justice, and the anti-spoofing laws are ridiculous and unenforceable in the first place.
Fitch Ratings thinks the Canadian economy is vulnerable to condos:
There are more than 80,000 condo units under construction across Ontario, most of them in the Greater Toronto Area. That’s 50 per cent higher than just four years ago, although the number of new housing starts has fallen from its peak in 2012, Fitch said. In the face of so much supply, condo prices have remained flat across the province.
Therein lies the problem, according to Fitch.
“As a large number of units come on line, prices may soften, which could reverberate throughout the Canadian economy,” Fitch director Stefan Hilts wrote. “Lower prices would reduce the incentives to build further units, which could hit employment in the construction sector that has been buoyed by continuing price growth. This in turn could lead to more significant downside exposure.”
Yellen is trying to talk down the market (without saying “irrational exuberance”):
Federal Reserve Chair Janet Yellen, surveying the financial landscape for signs of bubbles after more than six years of near-zero rates, warned that both stocks and bonds are richly valued.
“I would highlight that equity-market valuations at this point generally are quite high,” Yellen said in Washington on Wednesday in response to a question at a forum on finance. “Now, they’re not so high when you compare the returns on equities to the returns on safe assets like bonds, which are also very low, but there are potential dangers there.”
Yellen said bond yields “could see a sharp jump” when the Fed raises its benchmark interest rate. Most Fed officials predict that will happen this year for the first time since 2006.
She highlighted the term premium:
“Long-term interest rates are at very low levels, and that would appear to embody low term premiums, which can move, and can move very rapidly,” Yellen said after a speech in Washington. “We need to be attentive, and are to the possibility that when the Fed decides it’s time to begin raising rates, these term premiums could move up, and we could see a sharp jump in long-term rates.”
And the “global bond rout” has spread to Japan:
Japan’s government bonds joined a worldwide rout in sovereign debt as investors in Tokyo returned from a three-day national holiday.
…
The yield on the 10-year bond jumped seven basis points to 0.43 percent as of 8:52 a.m. in Tokyo from May 1, according to Japan Bond Trading Co., the nation’s largest inter-dealer debt broker. The price of the 0.4 percent debt due March 2025 fell 0.665 yen to 99.716. A basis point is 0.01 percentage point.
Meanwhile in the real economy (remember that?) productivity is falling:
Productivity over the past six months fell by the most in more than two decades, leading to increases in U.S. labor costs that threaten corporate profits.
The measure of employee output per hour decreased at a 1.9 percent annualized rate after a revised 2.1 percent drop in the prior three months, a Labor Department report showed Wednesday in Washington. The decline on average over the past two quarters was the biggest since the first six months of 1993. Expenses per worker increased more than projected at the start of the year.
A lack of business investment in new technology may mean productivity will continue to languish and limit the economic expansion’s potential. Rising labor costs without offsetting increases in efficiency would also hurt business earnings, and in turn restrain the hiring that would propel consumer spending.
But it’s an ill wind that doesn’t blow the banks any good:
The chart watchers in the stock market would like to draw your attention to notable recent moves by some large U.S. banks. JPMorgan Chase & Co.’s shares, for example, on Monday reached the highest level in 15 years. Goldman Sachs Group Inc. touched the highest price since 2008 last month and the SPDR S&P Bank ETF reached a 13-month high this week.
One obvious reason for the recent strength is a strong earnings season. The 24 companies in the KBW Bank Index posted profit growth of 8.8 percent and beat analysts’ estimates by almost 10 percent. Another reason, however, is a bit more slippery: the recent spike higher in interest rates on longer-term Treasuries. The subsequent steepening of the yield curve, it stands to reason, should be good for banks because they borrow at short-term rates and lend at long-term rates.
The sell-side old boys’ club in the States has approved an increase in tick size for smaller company shares, as a way of chipping away against hedge-fund friendly maker-taker fees:
The U.S. Securities and Exchange Commission approved a two-year program designed to test ways to boost investors’ interest in smaller stocks.
The trading experiment, championed by small-business advocates and opposed by big investors such as Fidelity Investments and D.E. Shaw & Co., will widen the minimum price at which stocks for small companies are quoted on exchanges, the SEC said Wednesday in a statement. The program would reward brokers for making markets in less-liquid stocks by widening the amount they earn when buying and selling shares.
Exchanges must start the pilot program by May 6, 2016, the SEC said. It will apply to shares of 1,400 companies with market values under $3 billion and average daily trading volume of less than 1 million shares, the SEC said.
…
Asset managers such as Fidelity opposed the program because they’re concerned it will raise transaction costs and probably won’t foster more initial public offerings.
Naturally, it did not occur to anybody at the SEC or the Dodd-Frank crowd in congress to do something about the ridiculous cost of going public and being a public company.
It was a mixed day for the Canadian preferred share market, with PerpetualDiscounts up 22bp, FixedResets off 14bp and DeemedRetractibles gaining 4bp. The Performance Highlights table is dominated by losing FixedResets. Volume was average.
PerpetualDiscounts now yield 5.02%, equivalent to 6.53% interest at the standard equivalency factor of 1.3x. Long corporates now yield about 4.05% so the pre-tax interest-equivalent spread (in this context, the “Seniority Spread”) is not now about 250bp, a very sharp narrowing from the 295bp reported April 22.
For as long as the FixedReset market is so violently unsettled, I’ll keep publishing updates of the more interesting and meaningful series of FixedResets’ Implied Volatilities. This doesn’t include Enbridge because although Enbridge has a large number of issues outstanding, all of which are quite liquid, the range of Issue Reset Spreads is too small for decent conclusions. The low is 212bp (ENB.PR.H; second-lowest is ENB.PR.D at 237bp) and the high is a mere 268 for ENB.PF.G.
Remember that all rich /cheap assessments are:
» based on Implied Volatility Theory only
» are relative only to other FixedResets from the same issuer
» assume constant GOC-5 yield
» assume constant Implied Volatility
» assume constant spread
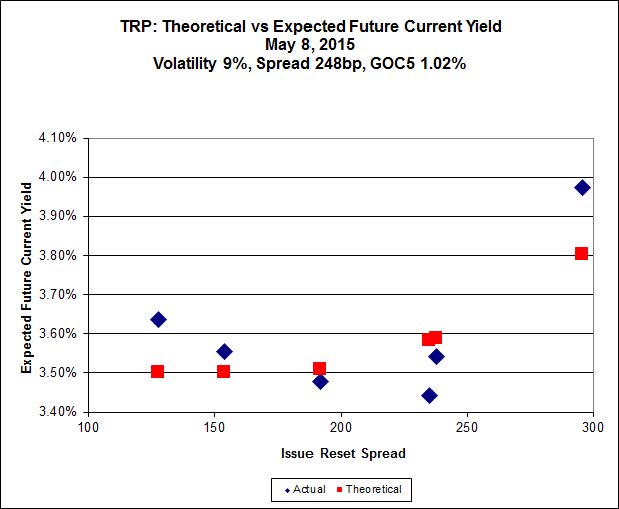
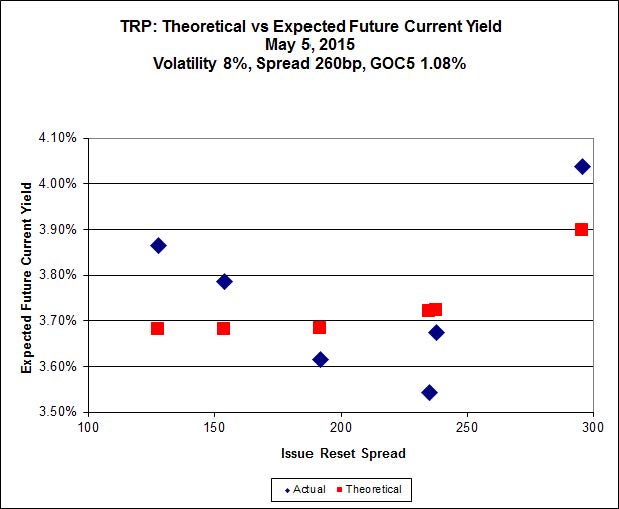
Here’s TRP:
 Click for Big
TRP.PR.E, which resets 2019-10-30 at +235, is bid at 24.19 to be $1.17 rich, while TRP.PR.B, resetting 2015-6-30 at +128, is $0.91 cheap at its bid price of 25.01.
 Click for Big
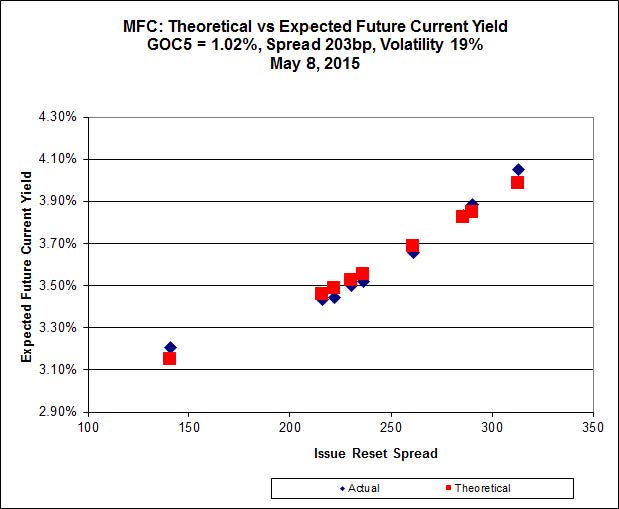
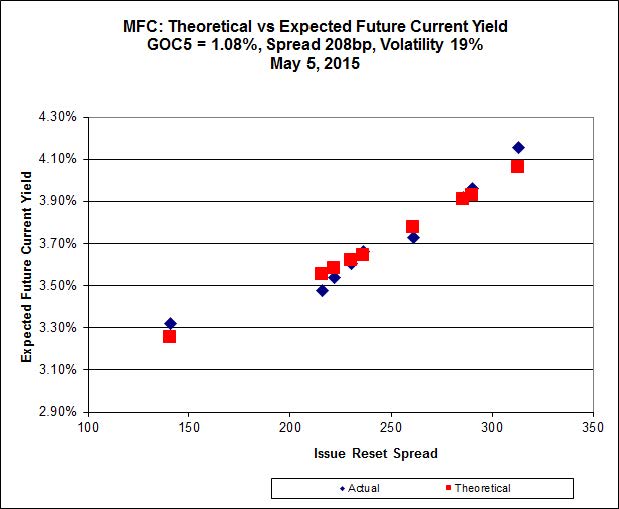
Another excellent fit, but the numbers are perplexing. Implied Volatility for MFC continues to be a conundrum. It is still too high if we consider that NVCC rules will never apply to these issues; it is still too low if we consider them to be NVCC non-compliant issues (and therefore with Deemed Maturities in the call schedule).
Most expensive is MFC.PR.K, resetting at +222 on 2018-9-19, bid at 23.33 to be $0.30 rich, while MFC.PR.H, resetting at +313bp on 2017-3-19, is bid at 25.35 to be $0.55 cheap.
 Click for Big
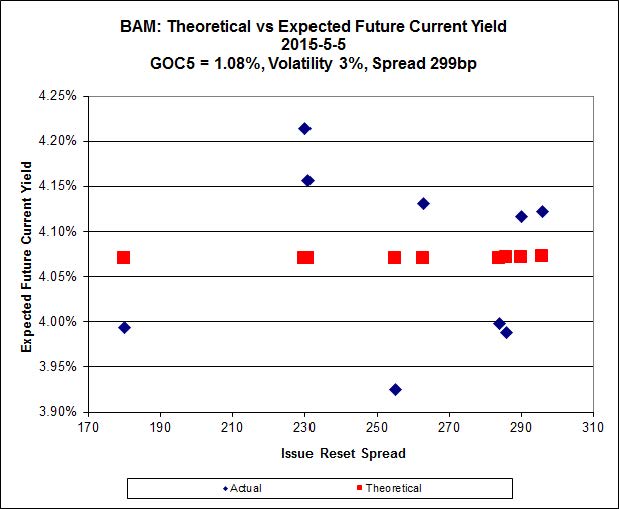
The cheapest issue relative to its peers is BAM.PR.R, resetting at +230bp on 2016-6-30, bid at 20.18 to be $0.53 cheap. BAM.PF.E, resetting at +255bp 2020-3-31 is bid at 22.72 and appears to be $0.50 rich.
 Click for Big
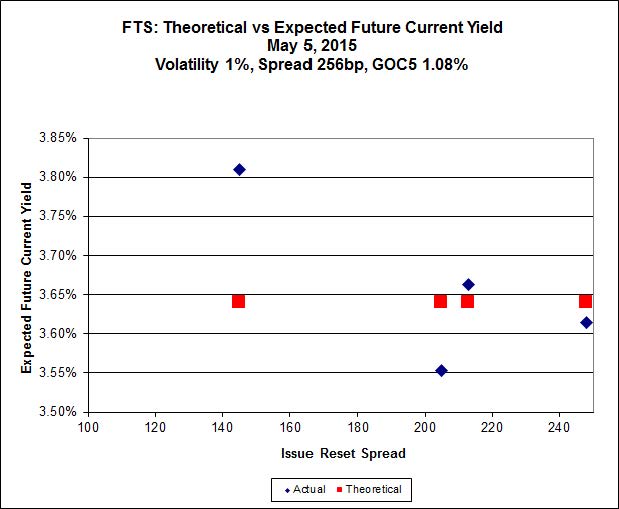
FTS.PR.H, with a spread of +145bp, and bid at 16.60, looks $0.83 cheap and resets 2015-6-1. FTS.PR.K, with a spread of +205bp and resetting 2019-3-1, is bid at 21.90 and is $0.41 rich.
 Click for Big
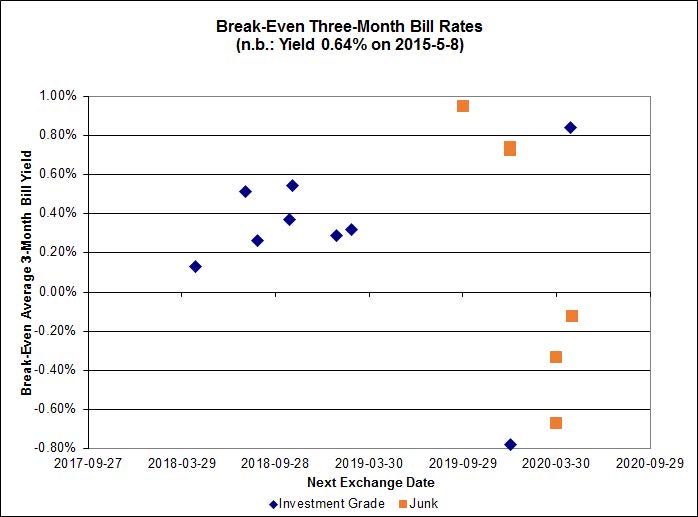
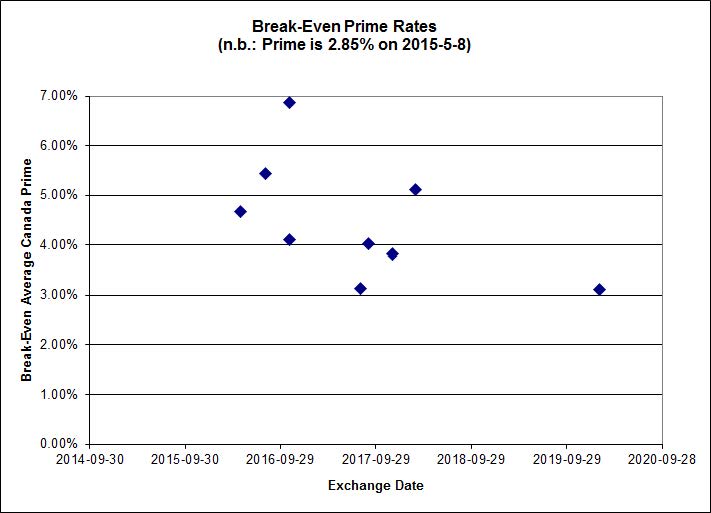
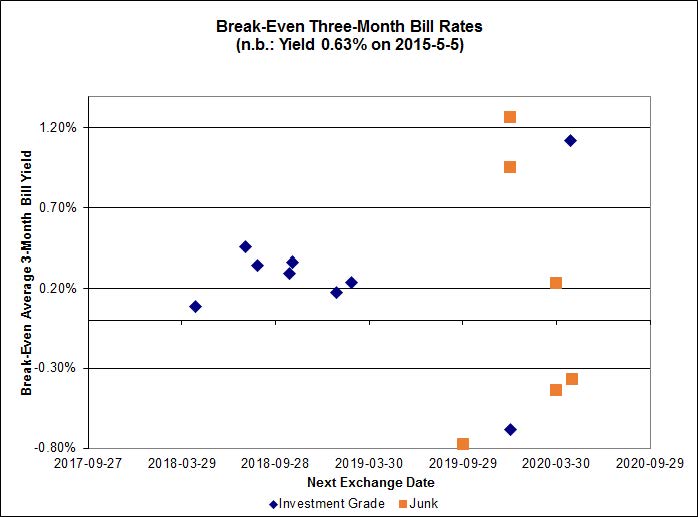
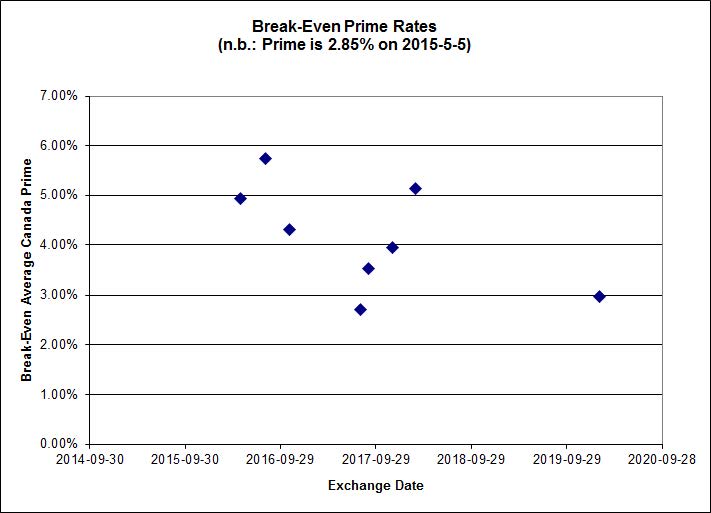
Investment-grade pairs now predict an average over the next five years of about 0.30%, but TRP.PR.A / TRP.PR.F is an outlier at -0.73% and BNS.PR.Y / BNS.PR.D is at +0.96%. On the junk side, the DC.PR.B / DC.PR.D pair is at -0.78% while FFH.PR.C / FFH.PR.D is at +1.22%.
 Click for Big
Shall we just say that this exhibits a high level of confidence in the continued rapacity of Canadian banks?
HIMIPref™ Preferred Indices
These values reflect the December 2008 revision of the HIMIPref™ Indices
Values are provisional and are finalized monthly |
| Index |
Mean
Current
Yield
(at bid) |
Median
YTW |
Median
Average
Trading
Value |
Median
Mod Dur
(YTW) |
Issues |
Day’s Perf. |
Index Value |
| Ratchet |
0.00 % |
0.00 % |
0 |
0.00 |
0 |
0.5320 % |
2,338.2 |
| FixedFloater |
0.00 % |
0.00 % |
0 |
0.00 |
0 |
0.5320 % |
4,088.2 |
| Floater |
3.11 % |
3.19 % |
53,826 |
19.23 |
4 |
0.5320 % |
2,485.7 |
| OpRet |
4.42 % |
-1.10 % |
36,036 |
0.15 |
2 |
0.0000 % |
2,767.0 |
| SplitShare |
4.56 % |
4.70 % |
64,901 |
3.36 |
3 |
-0.1729 % |
3,230.2 |
| Interest-Bearing |
0.00 % |
0.00 % |
0 |
0.00 |
0 |
0.0000 % |
2,530.1 |
| Perpetual-Premium |
5.45 % |
1.07 % |
68,493 |
0.08 |
18 |
0.0153 % |
2,521.6 |
| Perpetual-Discount |
5.04 % |
5.02 % |
122,804 |
15.44 |
15 |
0.2231 % |
2,788.3 |
| FixedReset |
4.42 % |
3.92 % |
279,074 |
16.11 |
86 |
-0.1417 % |
2,398.5 |
| Deemed-Retractible |
4.92 % |
3.08 % |
114,001 |
0.55 |
36 |
0.0443 % |
2,651.1 |
| FloatingReset |
2.61 % |
2.99 % |
66,459 |
6.20 |
7 |
0.0611 % |
2,322.9 |
| Performance Highlights |
| Issue |
Index |
Change |
Notes |
| CIU.PR.C |
FixedReset |
-6.47 % |
YTW SCENARIO
Maturity Type : Limit Maturity
Maturity Date : 2045-05-06
Maturity Price : 15.90
Evaluated at bid price : 15.90
Bid-YTW : 3.94 % |
| SLF.PR.G |
FixedReset |
-1.93 % |
YTW SCENARIO
Maturity Type : Hard Maturity
Maturity Date : 2025-01-31
Maturity Price : 25.00
Evaluated at bid price : 17.80
Bid-YTW : 6.61 % |
| BAM.PF.E |
FixedReset |
-1.73 % |
YTW SCENARIO
Maturity Type : Limit Maturity
Maturity Date : 2045-05-06
Maturity Price : 22.12
Evaluated at bid price : 22.72
Bid-YTW : 4.21 % |
| TD.PF.B |
FixedReset |
-1.53 % |
YTW SCENARIO
Maturity Type : Limit Maturity
Maturity Date : 2045-05-06
Maturity Price : 22.77
Evaluated at bid price : 23.86
Bid-YTW : 3.54 % |
| MFC.PR.L |
FixedReset |
-1.24 % |
YTW SCENARIO
Maturity Type : Hard Maturity
Maturity Date : 2025-01-31
Maturity Price : 25.00
Evaluated at bid price : 23.01
Bid-YTW : 4.65 % |
| IFC.PR.A |
FixedReset |
-1.22 % |
YTW SCENARIO
Maturity Type : Hard Maturity
Maturity Date : 2025-01-31
Maturity Price : 25.00
Evaluated at bid price : 20.25
Bid-YTW : 5.90 % |
| TD.PF.C |
FixedReset |
-1.08 % |
YTW SCENARIO
Maturity Type : Limit Maturity
Maturity Date : 2045-05-06
Maturity Price : 22.71
Evaluated at bid price : 23.81
Bid-YTW : 3.53 % |
| TRP.PR.C |
FixedReset |
-1.04 % |
YTW SCENARIO
Maturity Type : Limit Maturity
Maturity Date : 2045-05-06
Maturity Price : 17.12
Evaluated at bid price : 17.12
Bid-YTW : 3.92 % |
| BAM.PF.A |
FixedReset |
-1.03 % |
YTW SCENARIO
Maturity Type : Limit Maturity
Maturity Date : 2045-05-06
Maturity Price : 22.88
Evaluated at bid price : 23.92
Bid-YTW : 4.23 % |
| VNR.PR.A |
FixedReset |
-1.03 % |
YTW SCENARIO
Maturity Type : Limit Maturity
Maturity Date : 2045-05-06
Maturity Price : 23.07
Evaluated at bid price : 24.00
Bid-YTW : 4.08 % |
| HSE.PR.E |
FixedReset |
1.03 % |
YTW SCENARIO
Maturity Type : Call
Maturity Date : 2020-03-31
Maturity Price : 25.00
Evaluated at bid price : 25.62
Bid-YTW : 4.11 % |
| FTS.PR.J |
Perpetual-Discount |
1.07 % |
YTW SCENARIO
Maturity Type : Limit Maturity
Maturity Date : 2045-05-06
Maturity Price : 24.08
Evaluated at bid price : 24.50
Bid-YTW : 4.91 % |
| BAM.PR.K |
Floater |
1.31 % |
YTW SCENARIO
Maturity Type : Limit Maturity
Maturity Date : 2045-05-06
Maturity Price : 15.50
Evaluated at bid price : 15.50
Bid-YTW : 3.24 % |
| MFC.PR.F |
FixedReset |
1.33 % |
YTW SCENARIO
Maturity Type : Hard Maturity
Maturity Date : 2025-01-31
Maturity Price : 25.00
Evaluated at bid price : 19.00
Bid-YTW : 6.10 % |
| ENB.PR.B |
FixedReset |
1.45 % |
YTW SCENARIO
Maturity Type : Limit Maturity
Maturity Date : 2045-05-06
Maturity Price : 19.56
Evaluated at bid price : 19.56
Bid-YTW : 4.60 % |
| ENB.PF.G |
FixedReset |
1.49 % |
YTW SCENARIO
Maturity Type : Limit Maturity
Maturity Date : 2045-05-06
Maturity Price : 21.92
Evaluated at bid price : 22.44
Bid-YTW : 4.42 % |
| CU.PR.E |
Perpetual-Discount |
1.52 % |
YTW SCENARIO
Maturity Type : Limit Maturity
Maturity Date : 2045-05-06
Maturity Price : 24.31
Evaluated at bid price : 24.77
Bid-YTW : 4.93 % |
| SLF.PR.H |
FixedReset |
1.81 % |
YTW SCENARIO
Maturity Type : Hard Maturity
Maturity Date : 2025-01-31
Maturity Price : 25.00
Evaluated at bid price : 22.50
Bid-YTW : 4.71 % |
| Volume Highlights |
| Issue |
Index |
Shares
Traded |
Notes |
| RY.PR.Z |
FixedReset |
86,137 |
RBC crossed 69,000 at 24.10.
YTW SCENARIO
Maturity Type : Limit Maturity
Maturity Date : 2045-05-06
Maturity Price : 22.93
Evaluated at bid price : 24.18
Bid-YTW : 3.45 % |
| TD.PF.C |
FixedReset |
81,580 |
RBC sold 15,700 to TD at 23.82, then crossed 44,200 at 23.80.
YTW SCENARIO
Maturity Type : Limit Maturity
Maturity Date : 2045-05-06
Maturity Price : 22.71
Evaluated at bid price : 23.81
Bid-YTW : 3.53 % |
| RY.PR.J |
FixedReset |
77,339 |
RBC crossed 46,000 at 24.89.
YTW SCENARIO
Maturity Type : Limit Maturity
Maturity Date : 2045-05-06
Maturity Price : 23.11
Evaluated at bid price : 24.86
Bid-YTW : 3.66 % |
| NA.PR.S |
FixedReset |
55,180 |
RBC crossed 43,100 at 24.60.
YTW SCENARIO
Maturity Type : Limit Maturity
Maturity Date : 2045-05-06
Maturity Price : 23.10
Evaluated at bid price : 24.60
Bid-YTW : 3.55 % |
| CM.PR.Q |
FixedReset |
46,600 |
RBC crossed 42,500 at 24.85.
YTW SCENARIO
Maturity Type : Limit Maturity
Maturity Date : 2045-05-06
Maturity Price : 23.10
Evaluated at bid price : 24.86
Bid-YTW : 3.74 % |
| GWO.PR.R |
Deemed-Retractible |
43,388 |
Scotia bought 10,000 from National at 24.90.
YTW SCENARIO
Maturity Type : Hard Maturity
Maturity Date : 2025-01-31
Maturity Price : 25.00
Evaluated at bid price : 24.93
Bid-YTW : 4.92 % |
| There were 30 other index-included issues trading in excess of 10,000 shares. |
| Wide Spread Highlights |
| Issue |
Index |
Quote Data and Yield Notes |
| CIU.PR.C |
FixedReset |
Quote: 15.90 – 17.49
Spot Rate : 1.5900
Average : 1.2387
YTW SCENARIO
Maturity Type : Limit Maturity
Maturity Date : 2045-05-06
Maturity Price : 15.90
Evaluated at bid price : 15.90
Bid-YTW : 3.94 % |
| BNS.PR.Y |
FixedReset |
Quote: 22.69 – 23.25
Spot Rate : 0.5600
Average : 0.3622
YTW SCENARIO
Maturity Type : Hard Maturity
Maturity Date : 2022-01-31
Maturity Price : 25.00
Evaluated at bid price : 22.69
Bid-YTW : 3.44 % |
| BAM.PF.E |
FixedReset |
Quote: 22.72 – 23.20
Spot Rate : 0.4800
Average : 0.3082
YTW SCENARIO
Maturity Type : Limit Maturity
Maturity Date : 2045-05-06
Maturity Price : 22.12
Evaluated at bid price : 22.72
Bid-YTW : 4.21 % |
| TD.PF.B |
FixedReset |
Quote: 23.86 – 24.25
Spot Rate : 0.3900
Average : 0.2414
YTW SCENARIO
Maturity Type : Limit Maturity
Maturity Date : 2045-05-06
Maturity Price : 22.77
Evaluated at bid price : 23.86
Bid-YTW : 3.54 % |
| BAM.PF.F |
FixedReset |
Quote: 24.51 – 24.85
Spot Rate : 0.3400
Average : 0.2019
YTW SCENARIO
Maturity Type : Limit Maturity
Maturity Date : 2045-05-06
Maturity Price : 23.03
Evaluated at bid price : 24.51
Bid-YTW : 4.09 % |
| MFC.PR.N |
FixedReset |
Quote: 23.45 – 23.75
Spot Rate : 0.3000
Average : 0.1993
YTW SCENARIO
Maturity Type : Hard Maturity
Maturity Date : 2025-01-31
Maturity Price : 25.00
Evaluated at bid price : 23.45
Bid-YTW : 4.48 % |