John Williams of the San Francisco Fed is sounding very hawkish:
John Williams, president of the Federal Reserve Bank of San Francisco, said the central bank is likely to raise interest rates this year as the economy reaches full employment, though he’s troubled by low inflation.
“I still believe this will be the year for liftoff,” Williams, a voting member of the policy-setting Federal Open Market Committee, said in a speech Friday in San Francisco. Although he’s awaiting more evidence inflation is moving up toward the Fed’s goal, “I see a safer course in starting sooner and proceeding more gradually.”
…
Williams said the U.S. will probably hit his 5.2 percent estimate for the natural rate of unemployment later this year. As of May, the jobless rate stood at 5.5 percent, down from 10 percent in 2009.“We’re making good progress across most measures of the labor market,” he said. “Now that wage growth is starting to take off across multiple measures, it further confirms that the labor market is nearly healed.”
Employers added 280,000 positions in May, the most in five months. Average hourly earnings accelerated to a 2.3 percent year-over-year pace, the fastest since August 2013.
What’s more, Williams said economic growth in the first quarter of 2015 probably wasn’t as weak as official figures, which showed a 0.7 percent contraction, suggest.
“On closer inspection, the numbers weren’t nearly as bad as they appeared,” Williams said, citing San Francisco Fed research suggesting that the economy may have expanded at a 1.5 percent annual pace in the first three months of the year.
There is some wailing that robo-advisors might be programmed to sell the sponsor’s products:
But some might believe Power’s new alliance with Wealthsimple, as well as the entry by other large financial companies into the robo-adviser space, raises the spectre of a potentially revolutionary platform being slowly co-opted by those more interested in just selling their own products.
“That’s not necessarily bad, but it raises a bit of an issue,” said Mark Yamada, chief executive at Pur Investing Inc., a financial planner in Toronto. “Here we have an innovation that held great promise in providing investments at low cost to different generations of investors and it’s quickly being gobbled up by product folks who are looking for a new and different distribution channel.”
Battle lines on this front are already drawn in the U.S. where financial giants such as Charles Schwab Corp. and The Vanguard Group Inc. have recently jumped into the automated advice space to the chagrin of pure-play robo-advisers such as WealthFront Inc. and Betterment LLC.
WealthFront’s chief executive Adam Nash has been particularly critical of Schwab’s Intelligent Portfolios, which use proprietary ETFs as well as other companies’ funds, for not acting in the best interests of clients.
Greece had a bad week last week:
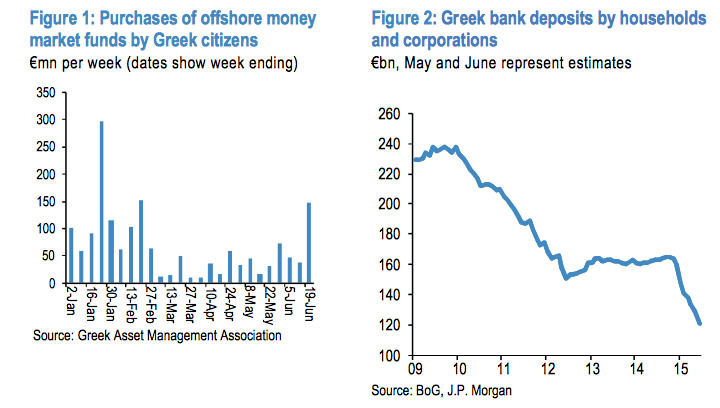
Failure to reach an agreement between Greek and European Union leaders last week spelled bad news for the banking system of the Hellenic Republic. Talk of capital controls is heating up, and with it the amount of money being pulled from Greece appears to be accelerating.
JPMorgan analysts led by Nikolaos Panigirtzoglou estimate that Greek banks lost about 6 billion euros in the week ending June 19. That takes total deposit outflows from Greece to about 44 billion euros since the beginning of the year. The analysts use Greeks’ purchases of offshore money market funds as a proxy to generate early estimates of those numbers.
Click for Big
Hard on the heels of my post regarding liquidity implications of the OSC report The Canadian Fixed Income Market: 2014 comes some cheery news about the liquidity of the Canadian market relative to those of other sovereigns:
How — or whether — investors can trade without having prices move against them has become a major worry as bonds globally tanked in the past few months. As a result, liquidity, or the lack of it, is skewing markets in new and surprising ways.
Spain, for instance, must pay more to borrow money than Italy for 30 years, even though Spain is considered safer by credit raters. Why? The Italian bond market is twice as big as the Spanish one — and, therefore, more liquid.
The same thing is happening around the world. Bonds in smaller, less-traded markets like Finland, Singapore and Canada are starting to fall out of favor. And with the Federal Reserve preparing to raise U.S. interest rates, investors want to know they can sell in a hurry if debt markets turn volatile.
“Liquidity is our number-one criteria in country selection,” said Olivier de Larouziere, the head of European interest rates in Paris at Natixis Asset Management, which oversees about $367 billion.
…
Some investors aren’t waiting to find out. In Spain, where a slump in repurchase agreements and trading of bills sent government-debt turnover in April to lows not seen since at least 2012, they’re starting to demand a bigger premium to own the securities, data compiled by Bloomberg show.Yields on 10-year Spanish bonds reached 2.54 percent on June 16, and rose to the highest versus Italian securities since the end of 2013. For much of the past year, the relationship was reversed as investors preferred Spain.
Part of the shift has to do with the rising cost of trading as liquidity dries up. The difference in yields for buyers and sellers of Spain’s 10-year notes — known as the bid-ask spread — is almost double that in Italy, the data show.
…
“Highly rated, small bond markets can become relatively illiquid,” said Chris Wightman, a London-based money manager at Wells Fargo Asset Management, which oversees about $493 billion. “Providing liquidity for our underlying clients is a paramount investment criteria for us.”
…
That hasn’t stopped some investors such as Canada’s Mawer Investment Management from looking toward bigger, more-liquid bond markets as a way to diversify. The Calgary-based firm, which oversees $24 billion, started its first foreign bond fund last week and will invest in the U.S., the U.K. and Europe.“We recognize that other larger markets are more liquid than the Canadian bond market, which does naturally make Canada more vulnerable,” said James Redpath, a fund manager at Mawer.
Meanwhile, some managers are preparing for lift-off by indulging in market timing:
TCW Group Inc. is taking the possibility of a bond-market selloff seriously.
So seriously that the Los Angeles-based money manager, which oversees almost $140 billion of U.S. debt, has been accumulating more and more cash in its credit funds, with the proportion rising to the highest since the 2008 crisis.
“We never realize what the tipping point is until after it happens,” said Jerry Cudzil, TCW Group’s head of U.S. credit trading. “We’re as defensive as we’ve been since pre-crisis.”
TCW isn’t alone: Bond funds are holding about 8 percent of their assets as cash-like securities, the highest proportion since at least 1999, according to FTN Financial, citing Investment Company Institute data.
And still other managers are upset because now credit analysis means looking at four pieces of paper rather than three:
Institutional investors are rewriting their old rules so they can buy bonds assigned credit ratings by a broader variety of firms, according to Kroll Bond Rating Agency Inc. and Morningstar Inc.
Over the past year, more than 30 investment firms have eased internal guidelines that limited them to bonds rated by at least one or two of the top three graders: Moody’s Investors Service, Standard & Poor’s and Fitch Ratings, said Kim Diamond, Kroll’s head of structured finance.
The loosening comes as some of the biggest bond buyers vocalize frustration that the so-called Big Three ratings firms are being hired less, resulting in fewer bond offerings from which they can choose.
…
Underwriters seeking maximum investor participation in bonds also have become frustrated with the “antiquated” restrictions, Deutsche Bank analyst Ashley Hooper wrote in a May report on the market for commercial mortgage-backed securities. Ratings competition has heated up substantially in that market as well this year.
But what of the systemic importance of individual money managers?:
Pimco’s ability to cope with a stampede of investor withdrawals after Bill Gross’s departure gives credence to arguments that mutual funds don’t threaten the broader financial system, the chairman of a global group of market regulators said Monday.
The lack of market turmoil when Pacific Investment Management Co. and the famed bond investor parted ways last year also shows regulators should refrain from treating asset managers like big banks, said Greg Medcraft, chairman of the International Organization of Securities Commissions. While a run on deposits can trigger insolvency for lenders, mutual funds are prepared to deal with surges in redemptions, he said.
“Pimco being able to wind back its positions quickly in a matter of days, it was a pretty damn good test of the liquidity of markets,” Medcraft said.
The world’s biggest money managers won a reprieve last week from being labeled systemically important, which can bring tough oversight and capital rules, when IOSCO said it would instead focus on studying broad “activities” of the asset-management industry. Medcraft said market watchdogs will be “more assertive” in pushing back on claims mutual funds should face strict rules written by bank regulators.
…
“We’re no longer the poor cousin” of the banking regulators who predominate at the FSB, Medcraft said. “I’ve already asked for more say and we’re getting more members” on the board, he said.
While I support the end result, the rationale seems very facile to me. It’s reasonably safe to assume that most of the $27.5-billion in October 2014 redemptions were reinvested in funds or other vehicles with a similar mandate; to the extent that that hypothesis is true, most of Pimco’s selling pressure will have been offset by other managers’ buying pressure. However, the final paragraph makes it clear that this is just another turf-battle for influence between regulators.
But all this talk of bond liquidity is a distraction from the real liquidity and valuation sink-hole:
The push to attract new institutional investors is ramping up at Manulife Financial Corp., as the insurer brings on new leaders to fuel the five-year expansion plan for its private markets business.
Manulife said Monday that it appointed three senior managers to newly created roles, a response to some early success the asset management group has seen since being formed in late 2013.
Manulife’s growing private markets group was created to attract new institutional investment in several target areas, including commercial real estate equity, commercial mortgage lending, and private placements. This built on Manulife’s existing Hancock Natural Resource Group, a trio of farmland, timber and renewable energy investments, as well as private equity and oil and gas investment arms. Manulife Asset Management Private Markets had $98-billion in assets as of the end of March, including assets managed for the company’s general fund.
It was yet another poor day for the Canadian preferred share market, with PerpetualDiscounts down 17bp, FixedResets losing 30bp and DeemedRetractibles off 13bp. The lengthy Performance Highlights table is, unsurprisingly, dominated by losers. Volume was below average.
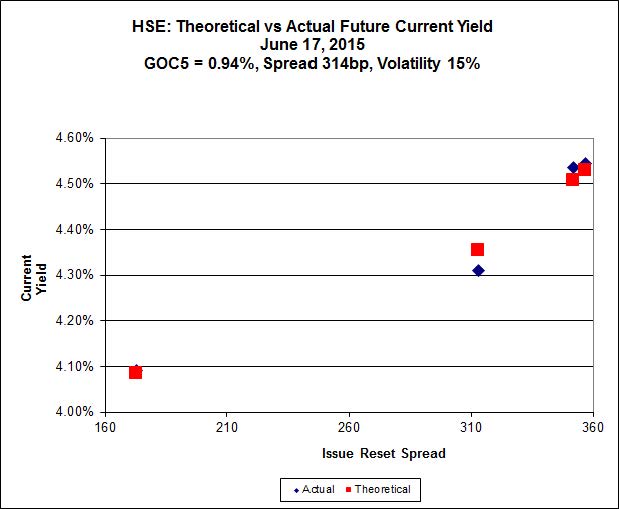
For as long as the FixedReset market is so violently unsettled, I’ll keep publishing updates of the more interesting and meaningful series of FixedResets’ Implied Volatilities. This doesn’t include Enbridge because although Enbridge has a large number of issues outstanding, all of which are quite liquid, the range of Issue Reset Spreads is too small for decent conclusions. The low is 212bp (ENB.PR.H; second-lowest is ENB.PR.D at 237bp) and the high is a mere 268 for ENB.PF.G.
Remember that all rich /cheap assessments are:
» based on Implied Volatility Theory only
» are relative only to other FixedResets from the same issuer
» assume constant GOC-5 yield
» assume constant Implied Volatility
» assume constant spread
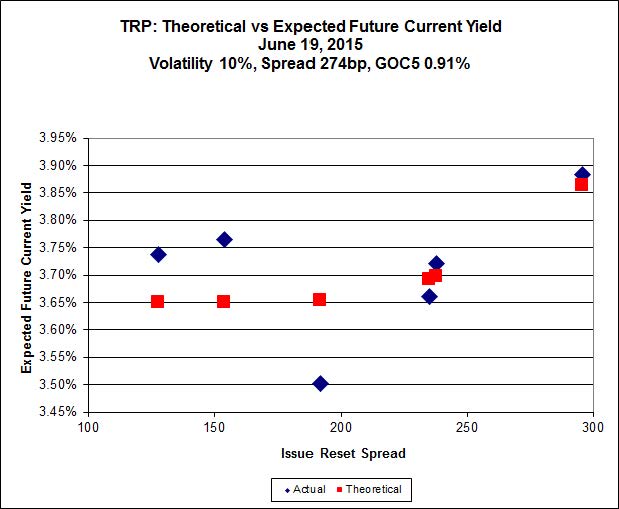
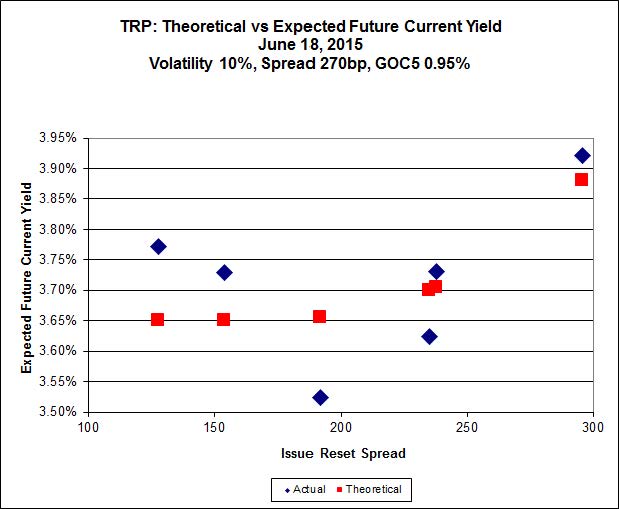
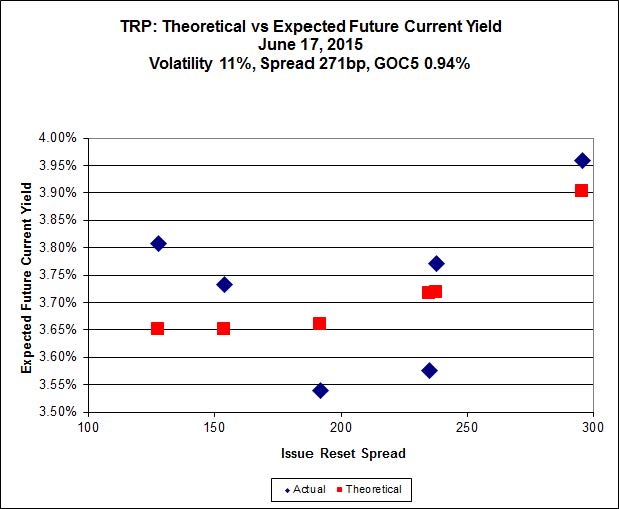
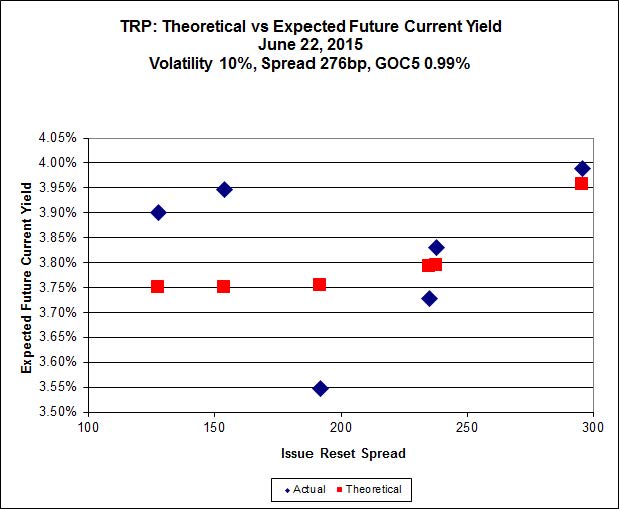
Here’s TRP:
Click for Big
TRP.PR.A, which resets 2019-12-31 at +192, is bid at 20.51 to be $1.13 rich, while TRP.PR.C, resetting 2016-1-30 at +154, is $0.84 cheap at its bid price of 16.03.
Click for Big
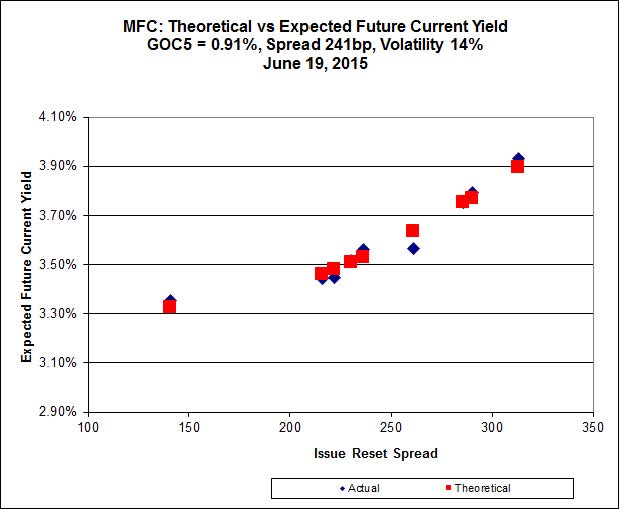
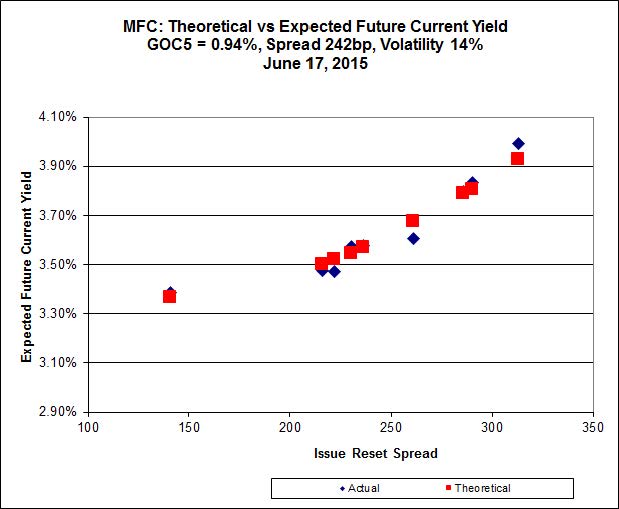
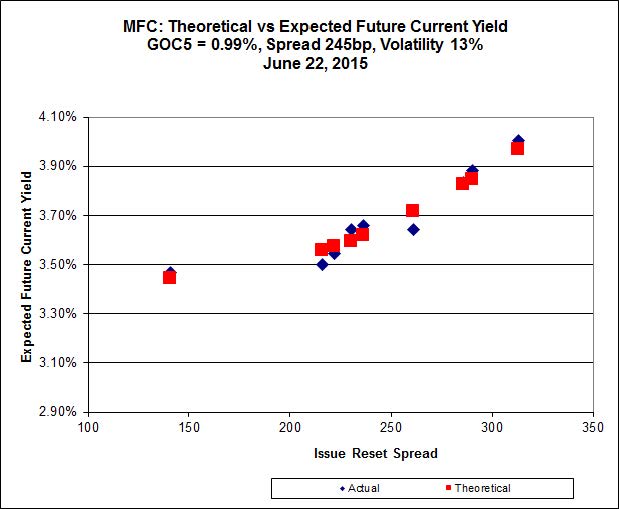
Another excellent fit, but the numbers are perplexing. Implied Volatility for MFC continues to be a conundrum. It is still too high if we consider that NVCC rules will never apply to these issues; it is still too low if we consider them to be NVCC non-compliant issues (and therefore with Deemed Maturities in the call schedule). The lowest spread issue, MFC.PR.F, is again noticeably off the line defined by the higher-spread issues.
Most expensive is MFC.PR.J, resetting at +261bp on 2018-3-19, bid at 24.71 to be $0.50 rich, while MFC.PR.N, resetting at +230bp on 2020-3-19, is bid at 22.57 to be $0.31 cheap.

Click for Big
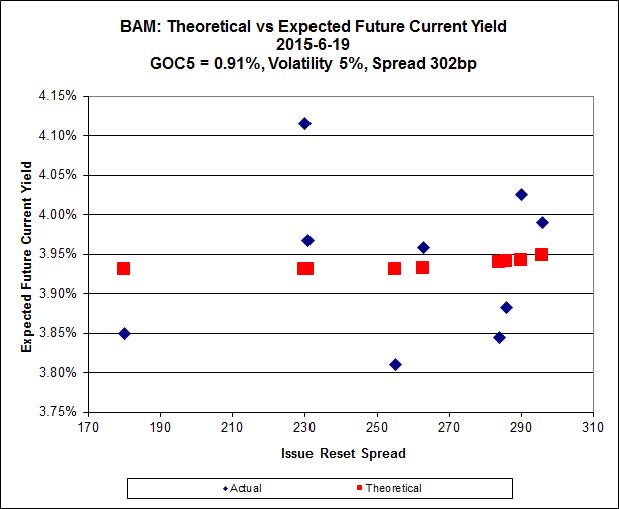
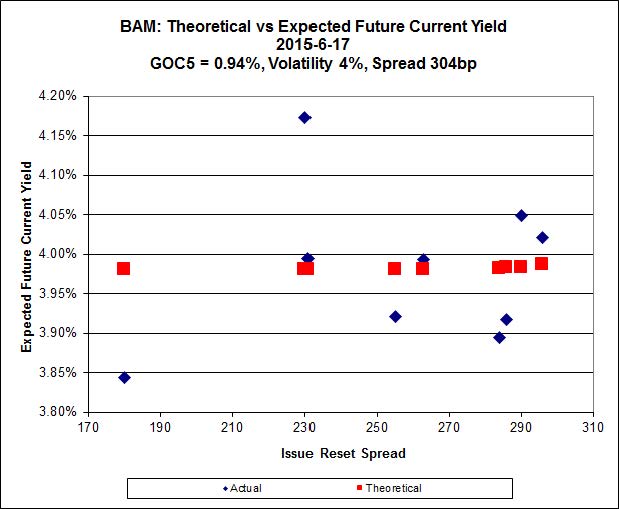
The cheapest issue relative to its peers is BAM.PR.R, resetting at +230bp on 2016-6-30, bid at 19.15 to be $1.06 cheap. BAM.PF.E, resetting at +255bp 2020-3-31 is bid at 22.45 and appears to be $0.71 rich.
Click for Big
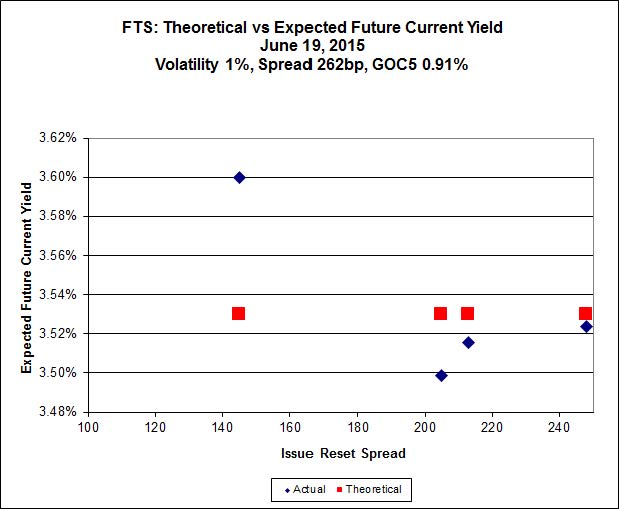
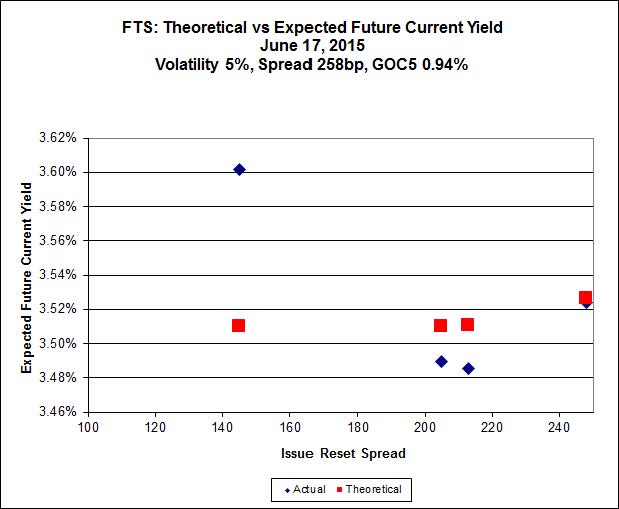
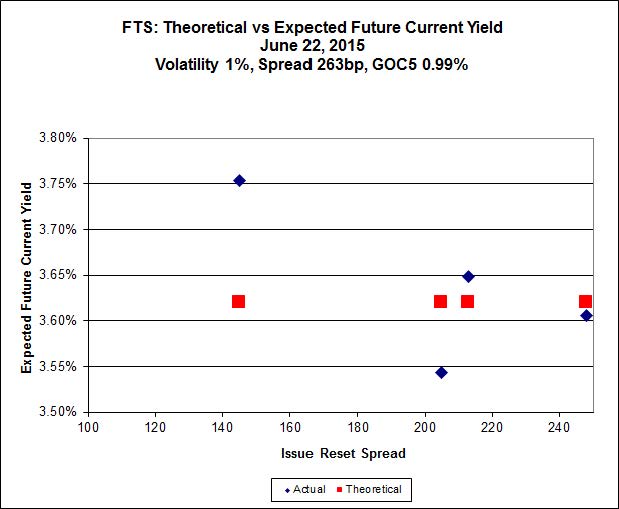
FTS.PR.H, with a spread of +145bp, and bid at 16.25, looks $0.60 cheap and resets 2020-6-1. FTS.PR.K, with a spread of +205bp and resetting 2019-3-1, is bid at 21.45 and is $0.46 rich.

Click for Big
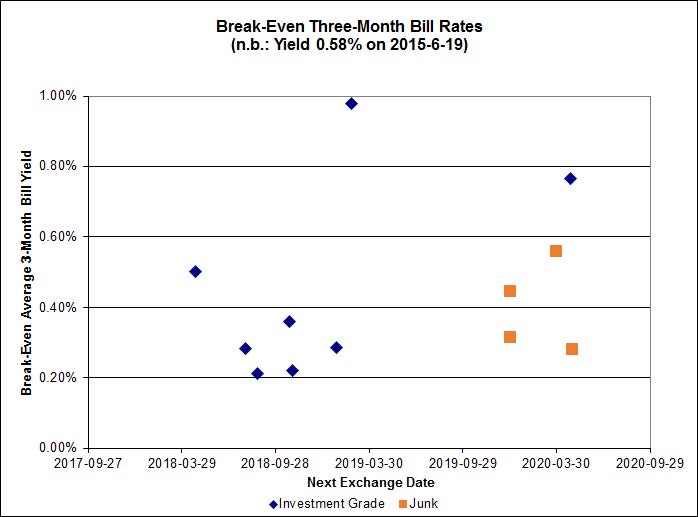
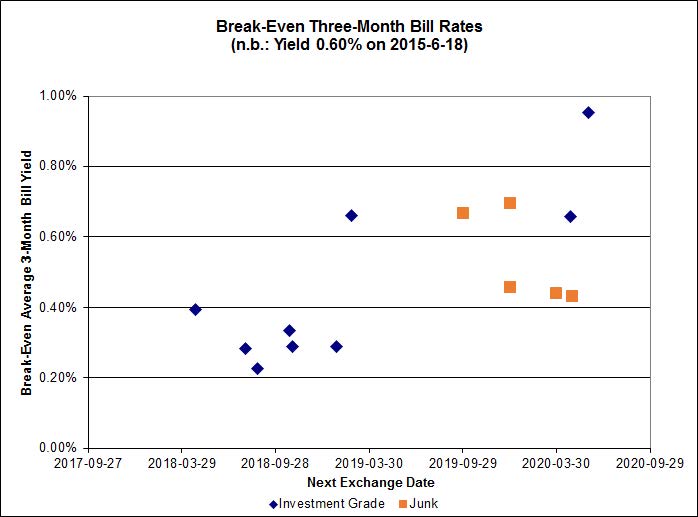
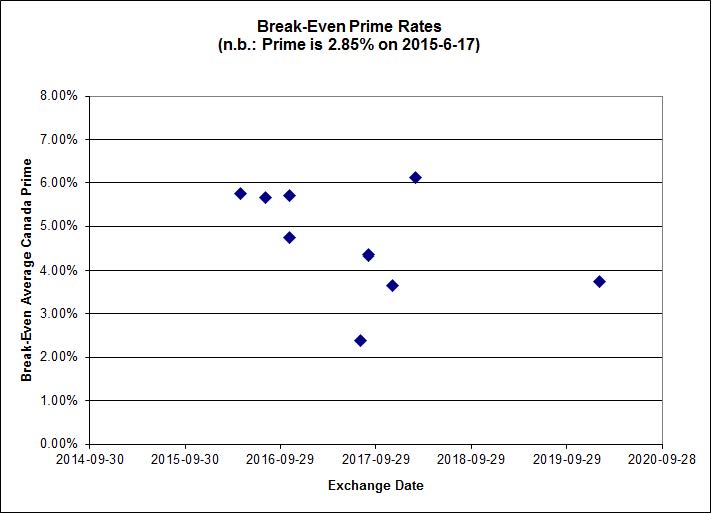
Investment-grade pairs predict an average three-month bill yield over the next five-odd years of about 0.45%, including the outliers TRP.PR.A / TRP.PR.F at -0.65% and FTS.PR.H / FTS.PR.I at +1.34%. On the junk side there are three outliers: FFH.PR.E / FFH.PR.F at -0.91%; DC.PR.B / DC.PR.D at -0.30%; and BRF.PR.A / BRF.PR.B at -0.47%.
Click for Big
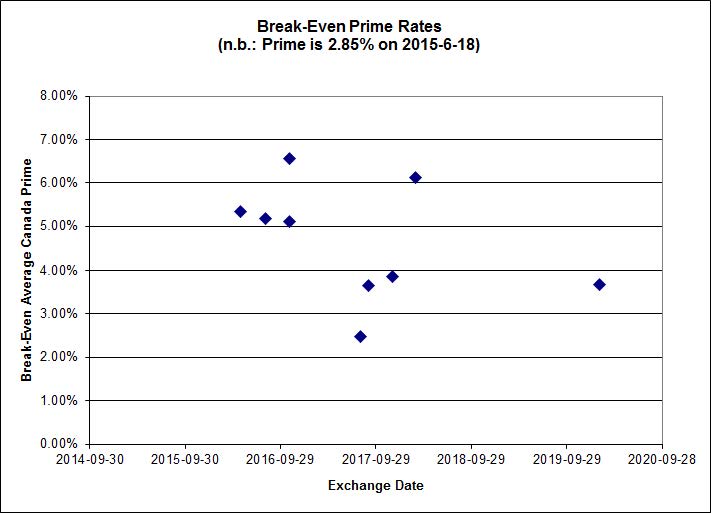
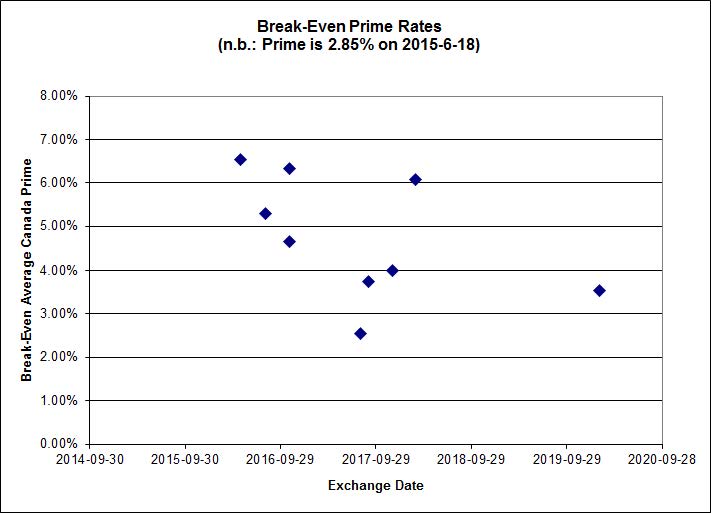
Shall we just say that this exhibits a high level of confidence in the continued rapacity of Canadian banks?
| HIMIPref™ Preferred Indices These values reflect the December 2008 revision of the HIMIPref™ Indices Values are provisional and are finalized monthly |
|||||||
| Index | Mean Current Yield (at bid) |
Median YTW |
Median Average Trading Value |
Median Mod Dur (YTW) |
Issues | Day’s Perf. | Index Value |
| Ratchet | 0.00 % | 0.00 % | 0 | 0.00 | 0 | 0.4700 % | 2,212.7 |
| FixedFloater | 0.00 % | 0.00 % | 0 | 0.00 | 0 | 0.4700 % | 3,868.9 |
| Floater | 3.50 % | 3.52 % | 64,151 | 18.48 | 3 | 0.4700 % | 2,352.3 |
| OpRet | 4.78 % | -10.62 % | 24,020 | 0.08 | 1 | 0.1562 % | 2,785.6 |
| SplitShare | 4.58 % | 4.79 % | 67,768 | 3.27 | 3 | 0.4563 % | 3,258.9 |
| Interest-Bearing | 0.00 % | 0.00 % | 0 | 0.00 | 0 | 0.1562 % | 2,547.2 |
| Perpetual-Premium | 5.46 % | 3.80 % | 62,100 | 0.51 | 19 | 0.0685 % | 2,519.8 |
| Perpetual-Discount | 5.20 % | 5.14 % | 114,238 | 15.18 | 15 | -0.1672 % | 2,703.6 |
| FixedReset | 4.55 % | 3.85 % | 239,127 | 16.23 | 88 | -0.3046 % | 2,330.3 |
| Deemed-Retractible | 5.02 % | 3.28 % | 110,743 | 0.76 | 34 | -0.1325 % | 2,617.5 |
| FloatingReset | 2.48 % | 2.94 % | 55,564 | 6.10 | 9 | -0.0638 % | 2,339.6 |
| Performance Highlights | |||
| Issue | Index | Change | Notes |
| IFC.PR.A | FixedReset | -1.97 % | YTW SCENARIO Maturity Type : Hard Maturity Maturity Date : 2025-01-31 Maturity Price : 25.00 Evaluated at bid price : 19.36 Bid-YTW : 6.38 % |
| CM.PR.O | FixedReset | -1.92 % | YTW SCENARIO Maturity Type : Limit Maturity Maturity Date : 2045-06-22 Maturity Price : 22.33 Evaluated at bid price : 23.00 Bid-YTW : 3.72 % |
| ENB.PR.B | FixedReset | -1.82 % | YTW SCENARIO Maturity Type : Limit Maturity Maturity Date : 2045-06-22 Maturity Price : 17.30 Evaluated at bid price : 17.30 Bid-YTW : 5.03 % |
| BAM.PR.R | FixedReset | -1.79 % | YTW SCENARIO Maturity Type : Limit Maturity Maturity Date : 2045-06-22 Maturity Price : 19.15 Evaluated at bid price : 19.15 Bid-YTW : 4.43 % |
| ENB.PR.Y | FixedReset | -1.64 % | YTW SCENARIO Maturity Type : Limit Maturity Maturity Date : 2045-06-22 Maturity Price : 17.96 Evaluated at bid price : 17.96 Bid-YTW : 4.93 % |
| TRP.PR.C | FixedReset | -1.48 % | YTW SCENARIO Maturity Type : Limit Maturity Maturity Date : 2045-06-22 Maturity Price : 16.03 Evaluated at bid price : 16.03 Bid-YTW : 4.07 % |
| BAM.PR.N | Perpetual-Discount | -1.42 % | YTW SCENARIO Maturity Type : Limit Maturity Maturity Date : 2045-06-22 Maturity Price : 20.82 Evaluated at bid price : 20.82 Bid-YTW : 5.73 % |
| BAM.PF.B | FixedReset | -1.39 % | YTW SCENARIO Maturity Type : Limit Maturity Maturity Date : 2045-06-22 Maturity Price : 21.73 Evaluated at bid price : 22.05 Bid-YTW : 4.22 % |
| IAG.PR.A | Deemed-Retractible | -1.27 % | YTW SCENARIO Maturity Type : Hard Maturity Maturity Date : 2025-01-31 Maturity Price : 25.00 Evaluated at bid price : 22.61 Bid-YTW : 5.94 % |
| MFC.PR.C | Deemed-Retractible | -1.24 % | YTW SCENARIO Maturity Type : Hard Maturity Maturity Date : 2025-01-31 Maturity Price : 25.00 Evaluated at bid price : 22.22 Bid-YTW : 6.08 % |
| BAM.PF.C | Perpetual-Discount | -1.21 % | YTW SCENARIO Maturity Type : Limit Maturity Maturity Date : 2045-06-22 Maturity Price : 21.15 Evaluated at bid price : 21.15 Bid-YTW : 5.76 % |
| ENB.PR.T | FixedReset | -1.15 % | YTW SCENARIO Maturity Type : Limit Maturity Maturity Date : 2045-06-22 Maturity Price : 18.09 Evaluated at bid price : 18.09 Bid-YTW : 5.02 % |
| ENB.PR.D | FixedReset | -1.14 % | YTW SCENARIO Maturity Type : Limit Maturity Maturity Date : 2045-06-22 Maturity Price : 17.41 Evaluated at bid price : 17.41 Bid-YTW : 5.00 % |
| FTS.PR.G | FixedReset | -1.11 % | YTW SCENARIO Maturity Type : Limit Maturity Maturity Date : 2045-06-22 Maturity Price : 21.38 Evaluated at bid price : 21.38 Bid-YTW : 3.81 % |
| BAM.PF.E | FixedReset | -1.10 % | YTW SCENARIO Maturity Type : Limit Maturity Maturity Date : 2045-06-22 Maturity Price : 21.95 Evaluated at bid price : 22.45 Bid-YTW : 4.16 % |
| MFC.PR.N | FixedReset | -1.10 % | YTW SCENARIO Maturity Type : Hard Maturity Maturity Date : 2025-01-31 Maturity Price : 25.00 Evaluated at bid price : 22.57 Bid-YTW : 4.86 % |
| CM.PR.P | FixedReset | -1.09 % | YTW SCENARIO Maturity Type : Limit Maturity Maturity Date : 2045-06-22 Maturity Price : 22.10 Evaluated at bid price : 22.67 Bid-YTW : 3.69 % |
| BMO.PR.S | FixedReset | -1.06 % | YTW SCENARIO Maturity Type : Limit Maturity Maturity Date : 2045-06-22 Maturity Price : 22.52 Evaluated at bid price : 23.30 Bid-YTW : 3.66 % |
| NA.PR.S | FixedReset | -1.06 % | YTW SCENARIO Maturity Type : Limit Maturity Maturity Date : 2045-06-22 Maturity Price : 23.00 Evaluated at bid price : 24.30 Bid-YTW : 3.55 % |
| ENB.PR.H | FixedReset | -1.06 % | YTW SCENARIO Maturity Type : Limit Maturity Maturity Date : 2045-06-22 Maturity Price : 16.86 Evaluated at bid price : 16.86 Bid-YTW : 4.88 % |
| TD.PF.B | FixedReset | -1.03 % | YTW SCENARIO Maturity Type : Limit Maturity Maturity Date : 2045-06-22 Maturity Price : 22.33 Evaluated at bid price : 23.00 Bid-YTW : 3.65 % |
| GWO.PR.I | Deemed-Retractible | 1.15 % | YTW SCENARIO Maturity Type : Hard Maturity Maturity Date : 2025-01-31 Maturity Price : 25.00 Evaluated at bid price : 22.80 Bid-YTW : 5.72 % |
| IFC.PR.C | FixedReset | 1.32 % | YTW SCENARIO Maturity Type : Hard Maturity Maturity Date : 2025-01-31 Maturity Price : 25.00 Evaluated at bid price : 23.00 Bid-YTW : 4.77 % |
| FTS.PR.K | FixedReset | 1.42 % | YTW SCENARIO Maturity Type : Limit Maturity Maturity Date : 2045-06-22 Maturity Price : 21.45 Evaluated at bid price : 21.45 Bid-YTW : 3.77 % |
| TRP.PR.A | FixedReset | 1.53 % | YTW SCENARIO Maturity Type : Limit Maturity Maturity Date : 2045-06-22 Maturity Price : 20.51 Evaluated at bid price : 20.51 Bid-YTW : 3.65 % |
| BAM.PR.K | Floater | 1.81 % | YTW SCENARIO Maturity Type : Limit Maturity Maturity Date : 2045-06-22 Maturity Price : 14.10 Evaluated at bid price : 14.10 Bid-YTW : 3.53 % |
| CIU.PR.C | FixedReset | 1.92 % | YTW SCENARIO Maturity Type : Limit Maturity Maturity Date : 2045-06-22 Maturity Price : 16.45 Evaluated at bid price : 16.45 Bid-YTW : 3.68 % |
| Volume Highlights | |||
| Issue | Index | Shares Traded |
Notes |
| ENB.PR.T | FixedReset | 256,410 | Nesbitt crossed 242,000 at 18.15. Nice ticket! YTW SCENARIO Maturity Type : Limit Maturity Maturity Date : 2045-06-22 Maturity Price : 18.09 Evaluated at bid price : 18.09 Bid-YTW : 5.02 % |
| NA.PR.S | FixedReset | 156,393 | Desjardins crossed 150,000 at 24.43. YTW SCENARIO Maturity Type : Limit Maturity Maturity Date : 2045-06-22 Maturity Price : 23.00 Evaluated at bid price : 24.30 Bid-YTW : 3.55 % |
| BNS.PR.Z | FixedReset | 135,296 | Scotia sold 24,500 to RBC at 23.75, then crossed 100,000 at 23.65. YTW SCENARIO Maturity Type : Hard Maturity Maturity Date : 2022-01-31 Maturity Price : 25.00 Evaluated at bid price : 23.64 Bid-YTW : 3.49 % |
| RY.PR.I | FixedReset | 111,845 | TD crossed 100,000 at 25.23. YTW SCENARIO Maturity Type : Hard Maturity Maturity Date : 2022-01-31 Maturity Price : 25.00 Evaluated at bid price : 25.22 Bid-YTW : 3.17 % |
| CIU.PR.C | FixedReset | 71,810 | TD crossed 70,400 at 16.15. Friday’s closing quote was 16.14-50, so this was not necessarily as big a price concession on this illiquid issue as one might think from today’s bid. YTW SCENARIO Maturity Type : Limit Maturity Maturity Date : 2045-06-22 Maturity Price : 16.45 Evaluated at bid price : 16.45 Bid-YTW : 3.68 % |
| BNS.PR.A | FloatingReset | 38,625 | TD crossed 34,800 at 24.75. YTW SCENARIO Maturity Type : Hard Maturity Maturity Date : 2022-01-31 Maturity Price : 25.00 Evaluated at bid price : 24.65 Bid-YTW : 2.94 % |
| There were 24 other index-included issues trading in excess of 10,000 shares. | |||
| Wide Spread Highlights | ||
| Issue | Index | Quote Data and Yield Notes |
| BAM.PR.K | Floater | Quote: 14.10 – 14.96 Spot Rate : 0.8600 Average : 0.6148 YTW SCENARIO |
| TD.PF.B | FixedReset | Quote: 23.00 – 23.48 Spot Rate : 0.4800 Average : 0.3167 YTW SCENARIO |
| IAG.PR.A | Deemed-Retractible | Quote: 22.61 – 23.24 Spot Rate : 0.6300 Average : 0.4979 YTW SCENARIO |
| CM.PR.O | FixedReset | Quote: 23.00 – 23.45 Spot Rate : 0.4500 Average : 0.3184 YTW SCENARIO |
| FTS.PR.J | Perpetual-Discount | Quote: 23.51 – 24.10 Spot Rate : 0.5900 Average : 0.4638 YTW SCENARIO |
| IFC.PR.A | FixedReset | Quote: 19.36 – 19.90 Spot Rate : 0.5400 Average : 0.4150 YTW SCENARIO |