Assiduous Readers will remember covered bonds – issues that are guaranteed both by the issuing bank and by a mortgage pool. This results in high ratings – for instance Royal Bank’s covered bonds are rated AAA by DBRS. So … having sovereign-style credit ratings leads to sovereign-style prices:
The first non-government issuer just got paid to borrow in euros.
Berlin Hyp AG sold 500 million euros ($550 million) of three-year covered bonds priced to yield minus 0.162 percent on Tuesday, according to data compiled by Bloomberg. The sale followed the euro area’s first zero-coupon covered bond, sold last month by another German issuer, Landesbank Hessen-Thueringen Girozentrale.
…
In the secondary market, almost 70 percent of German covered bonds have yields of less than zero, according to HSBC data tracking issues of at least 500 million euros. Issuers have extended maturities in the last month to avoid selling bonds with negative yields, said Matthias Melms, an analyst at NordLB.“There seems too little concern that the market has become more and more distorted or even impaired,” said Bernd Volk, head of European covered and agency bond research at Deutsche Bank AG.
Berlin Hyp is majority-owned by Germany’s savings banks, which are supported by the nation’s states and municipalities.
Assiduous Reader AP writes in with a link to a piece about robot (and drone!) law:
OK, let’s say there’s no hack, but a self-driving car still crashes. What’s the driver’s responsibility?
On the self-driving cars that are being tested right now, the carmakers want the driver paying attention—and right now, they’re not doing it. They’re playing cards. That’s a little scary. And even if driver is well-intentioned, sitting there alert, it’s hard to stay alert for a long drive if you have nothing to do. This is the problem of “unintentional inattention,” and it goes well beyond cars.
Imagine you’ve got robot mall cops. There’s eight of them running around the mall and one guy in a room someplace looking at eight TV screens. He’s bored out of his mind, falling asleep. Then something happens, and it’s his fault because he’s asleep at the switch. Sometimes this is called the “human in the loop” problem. Autonomy seems dangerous, so you put a human in the loop. But that person’s job is very passive. It’s tough to do, and it may be a low-wage, low-status job. Then you blame the person who fails to monitor, even though the system sets them up for the fall. That’s not a good design, but I don’t know what the answer is.
It was a poor day for the Canadian preferred share market, with PerpetualDiscounts off 25bp, FixedResets losing 101bp and DeemedRetractibles down 80b. The Performance Highlights table is predictably lengthy. Volume was well above average.
For as long as the FixedReset market is so violently unsettled, I’ll keep publishing updates of the more interesting and meaningful series of FixedResets’ Implied Volatilities. This doesn’t include Enbridge because although Enbridge has a large number of issues outstanding, all of which are quite liquid, the range of Issue Reset Spreads is too small for decent conclusions. The low is 212bp (ENB.PR.H; second-lowest is ENB.PR.D at 237bp) and the high is a mere 268 for ENB.PF.G.
Remember that all rich /cheap assessments are:
» based on Implied Volatility Theory only
» are relative only to other FixedResets from the same issuer
» assume constant GOC-5 yield
» assume constant Implied Volatility
» assume constant spread
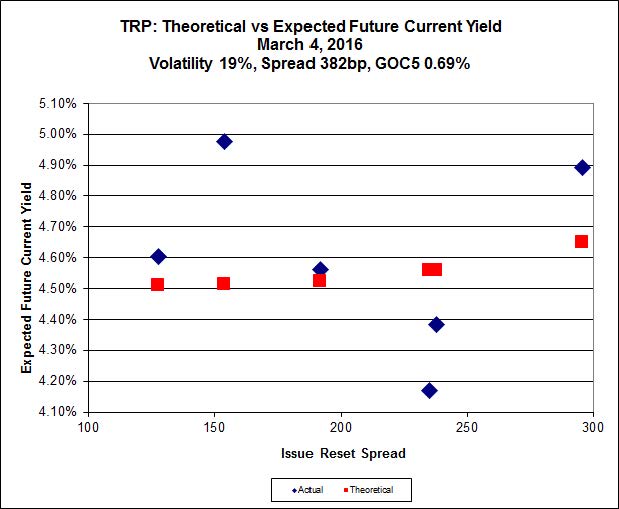
Here’s TRP:

Click for Big
TRP.PR.E, which resets 2019-10-30 at +235, is bid at 18.00 to be $1.54 rich, while TRP.PR.C, resetting 2021-1-30 at +296, is $1.11 cheap at its bid price of 11.07.

Click for Big
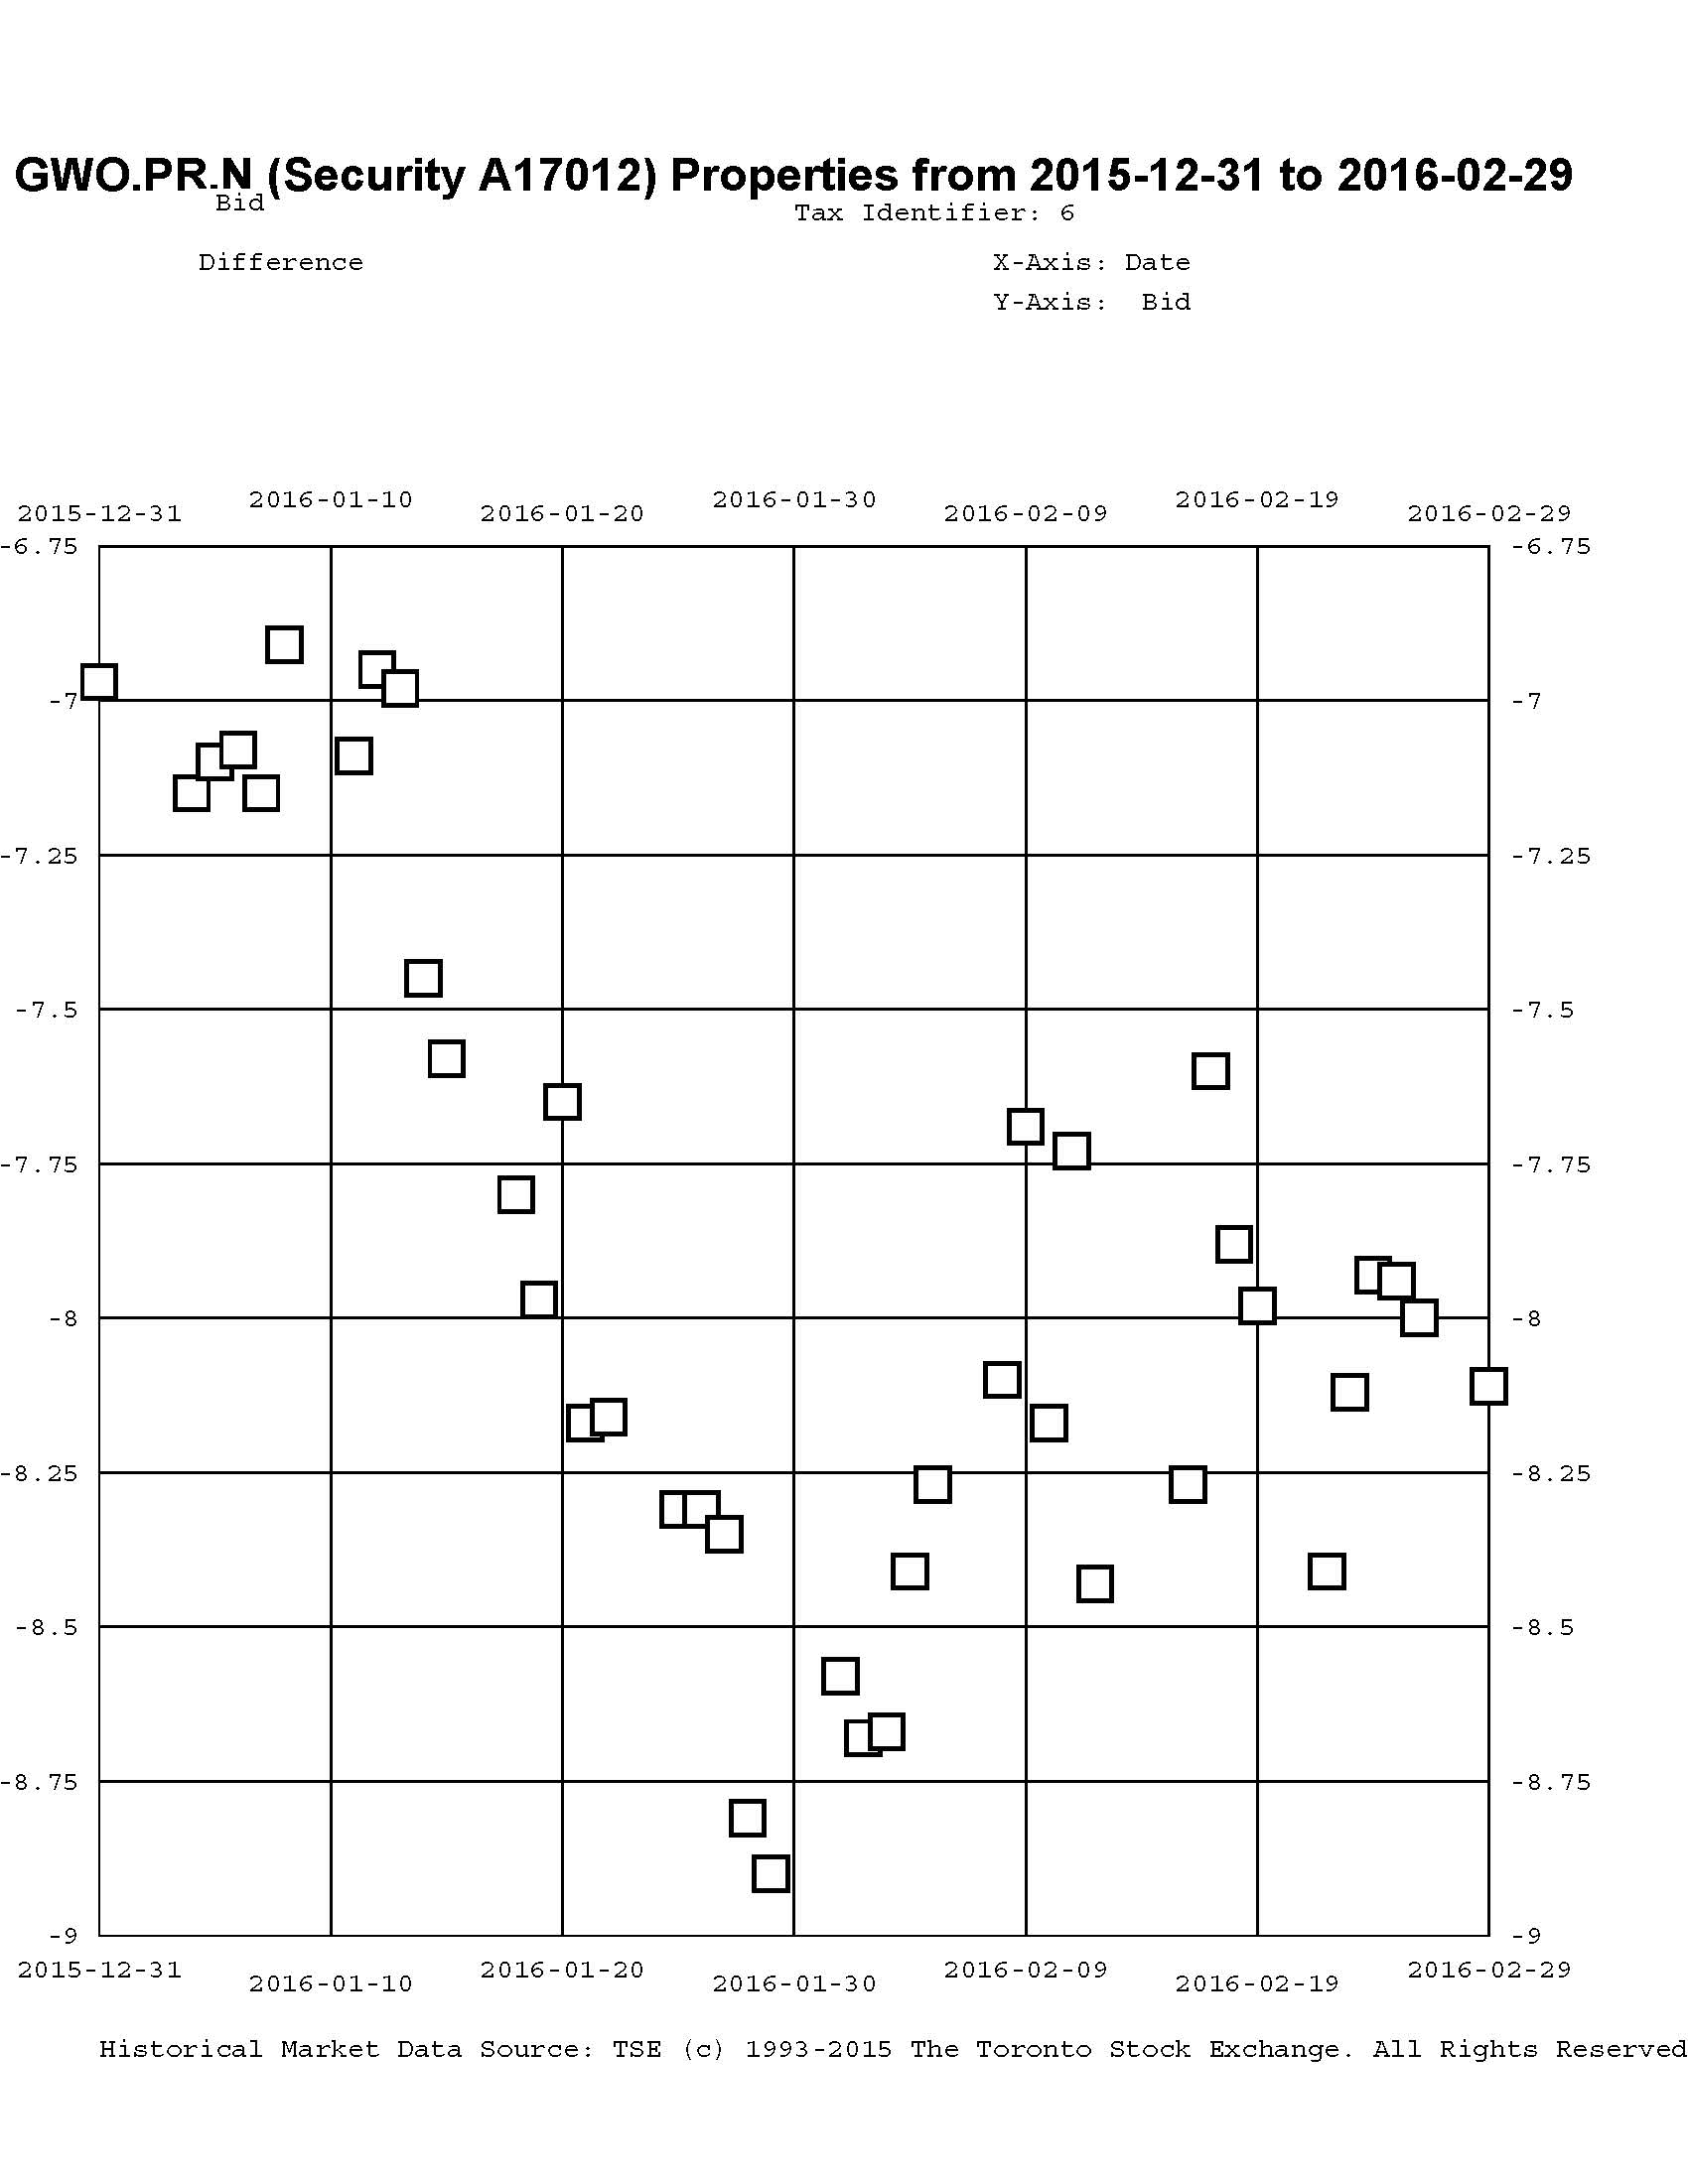
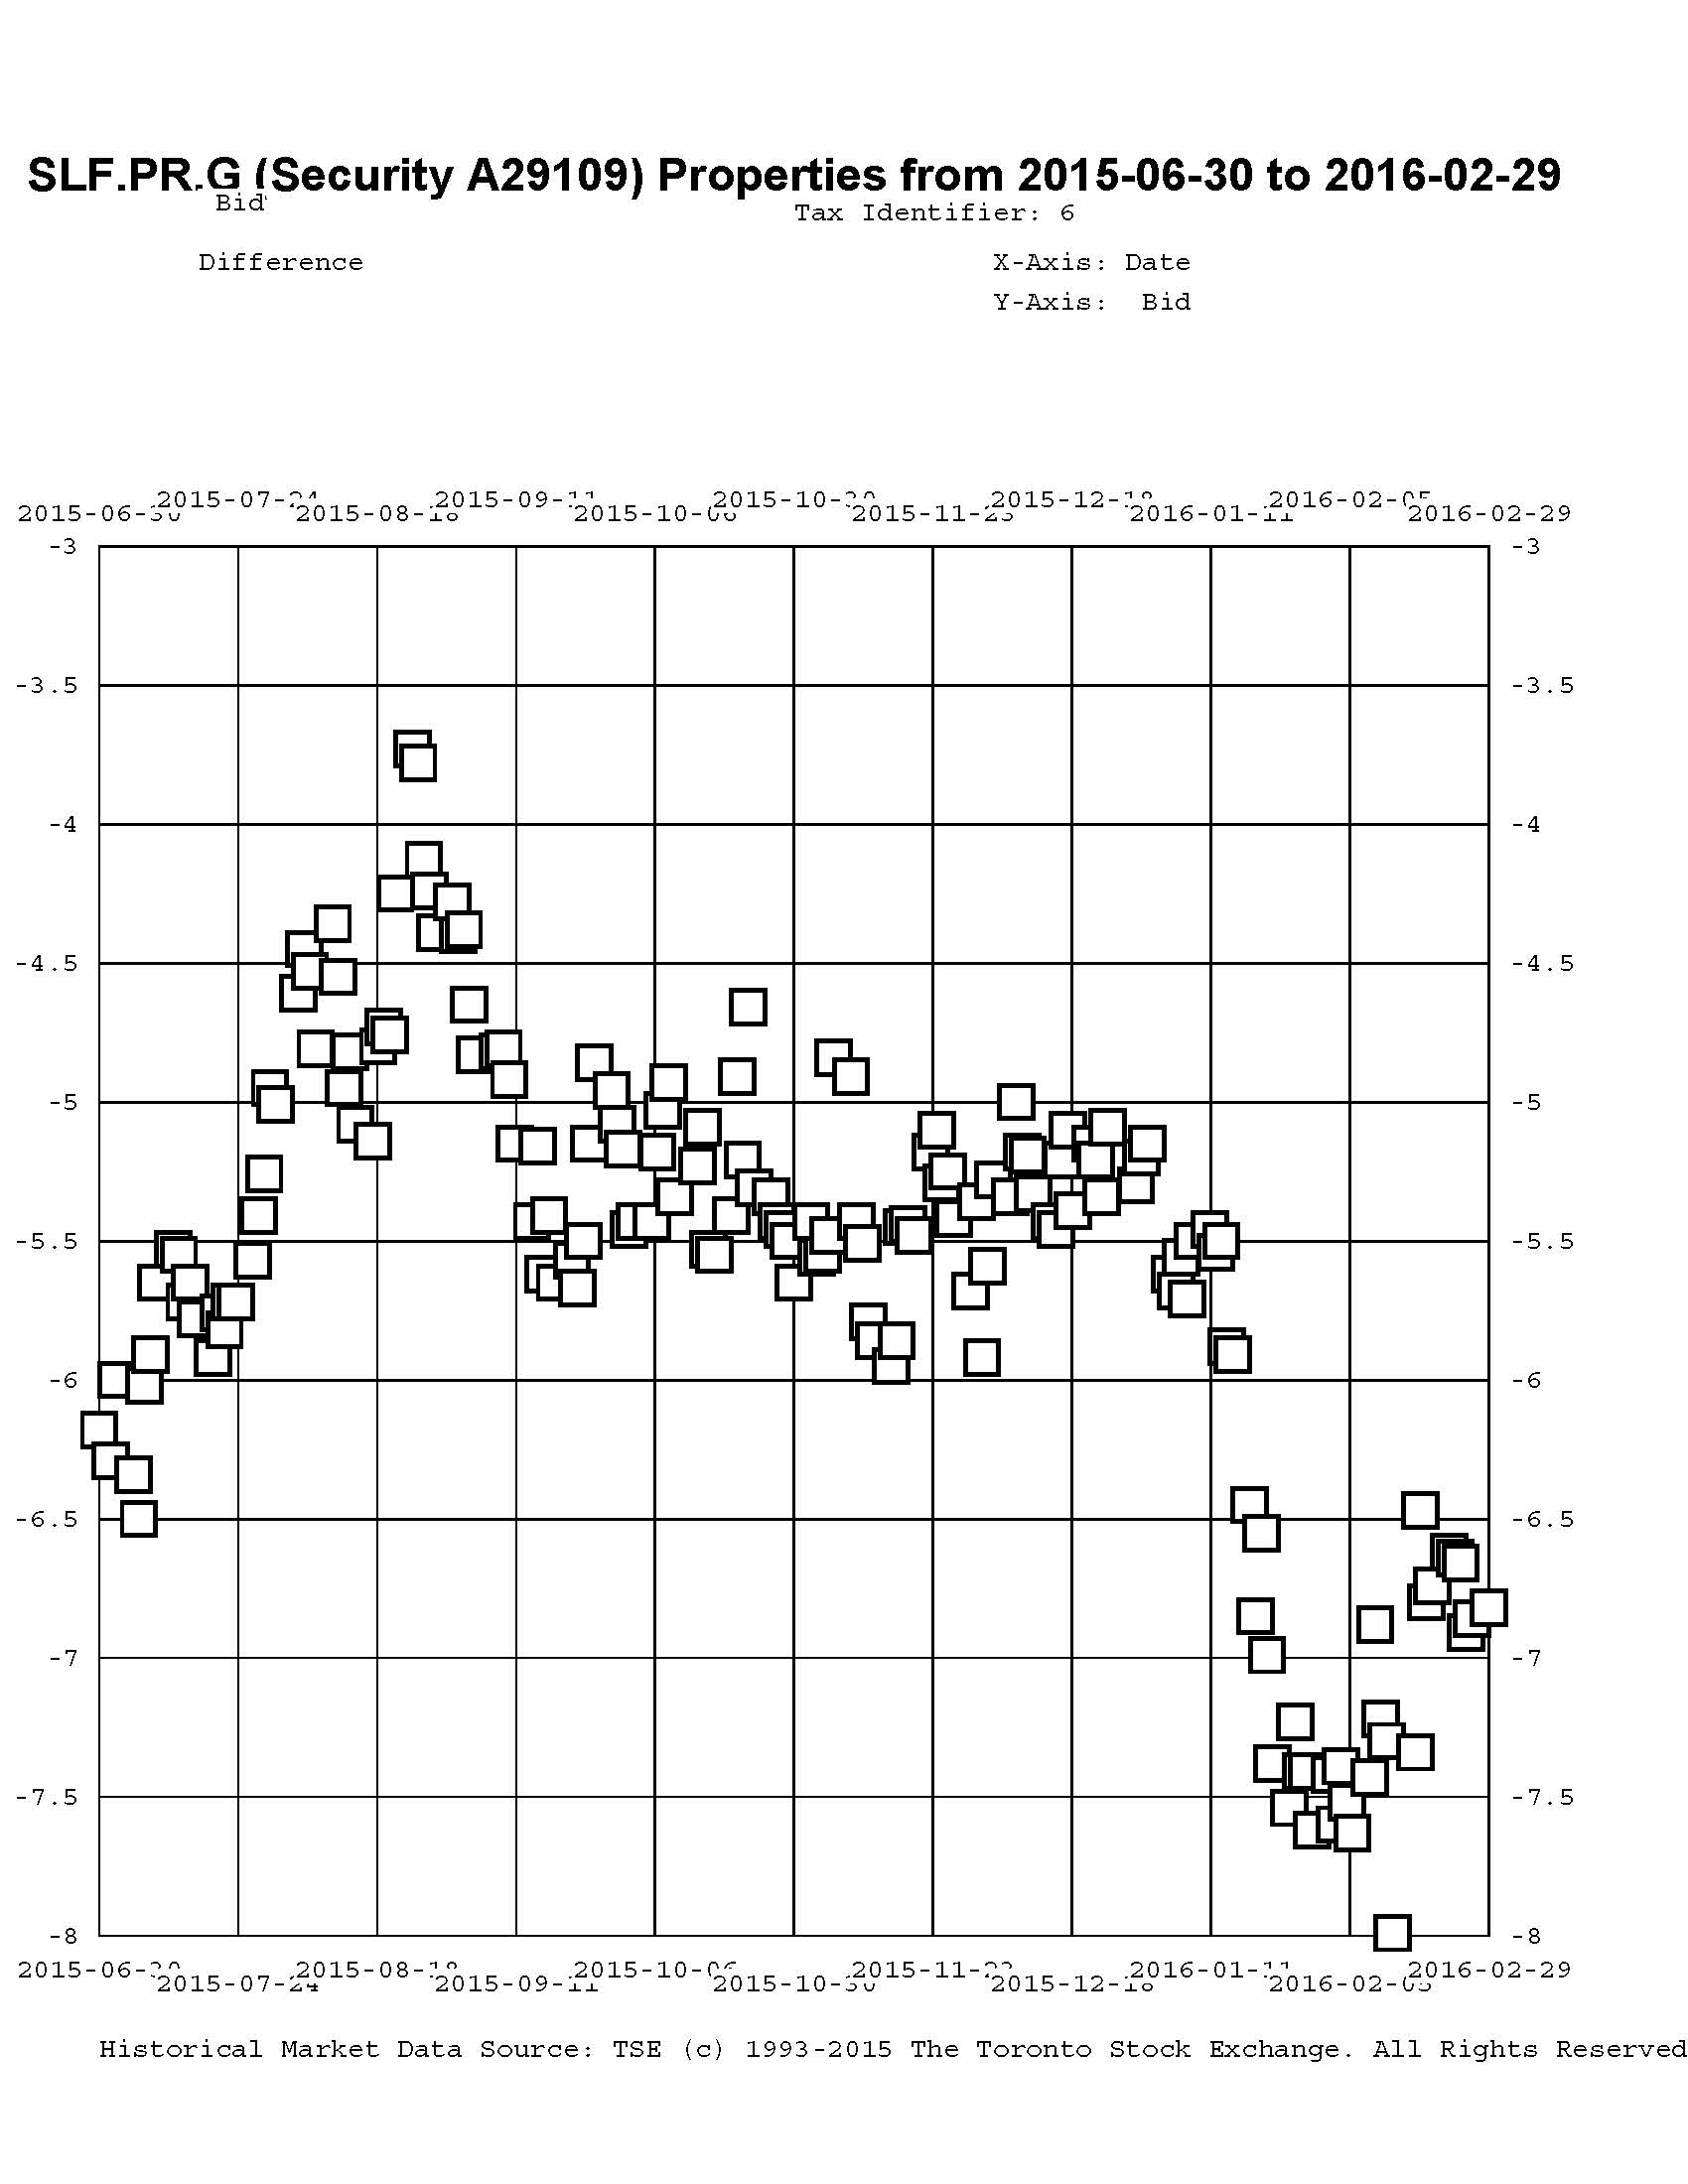
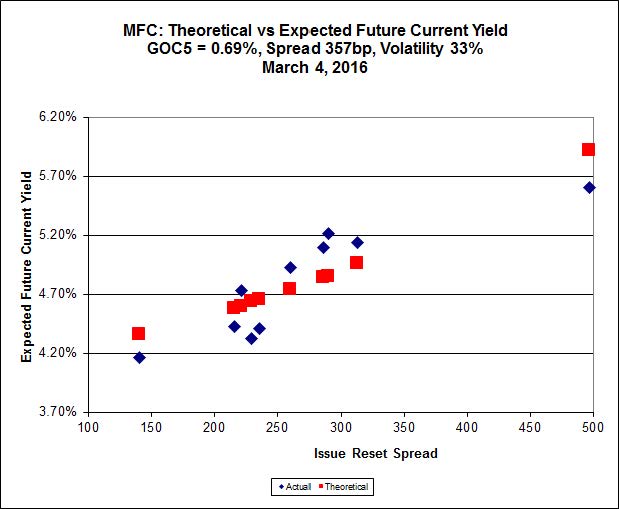
Most expensive is MFC.PR.N, resetting at +230bp on 2020-3-19, bid at 17.50 to be 1.14 rich, while MFC.PR.G, resetting at +290bp on 2016-12-19, is bid at 17.49 to be 1.33 cheap.

Click for Big
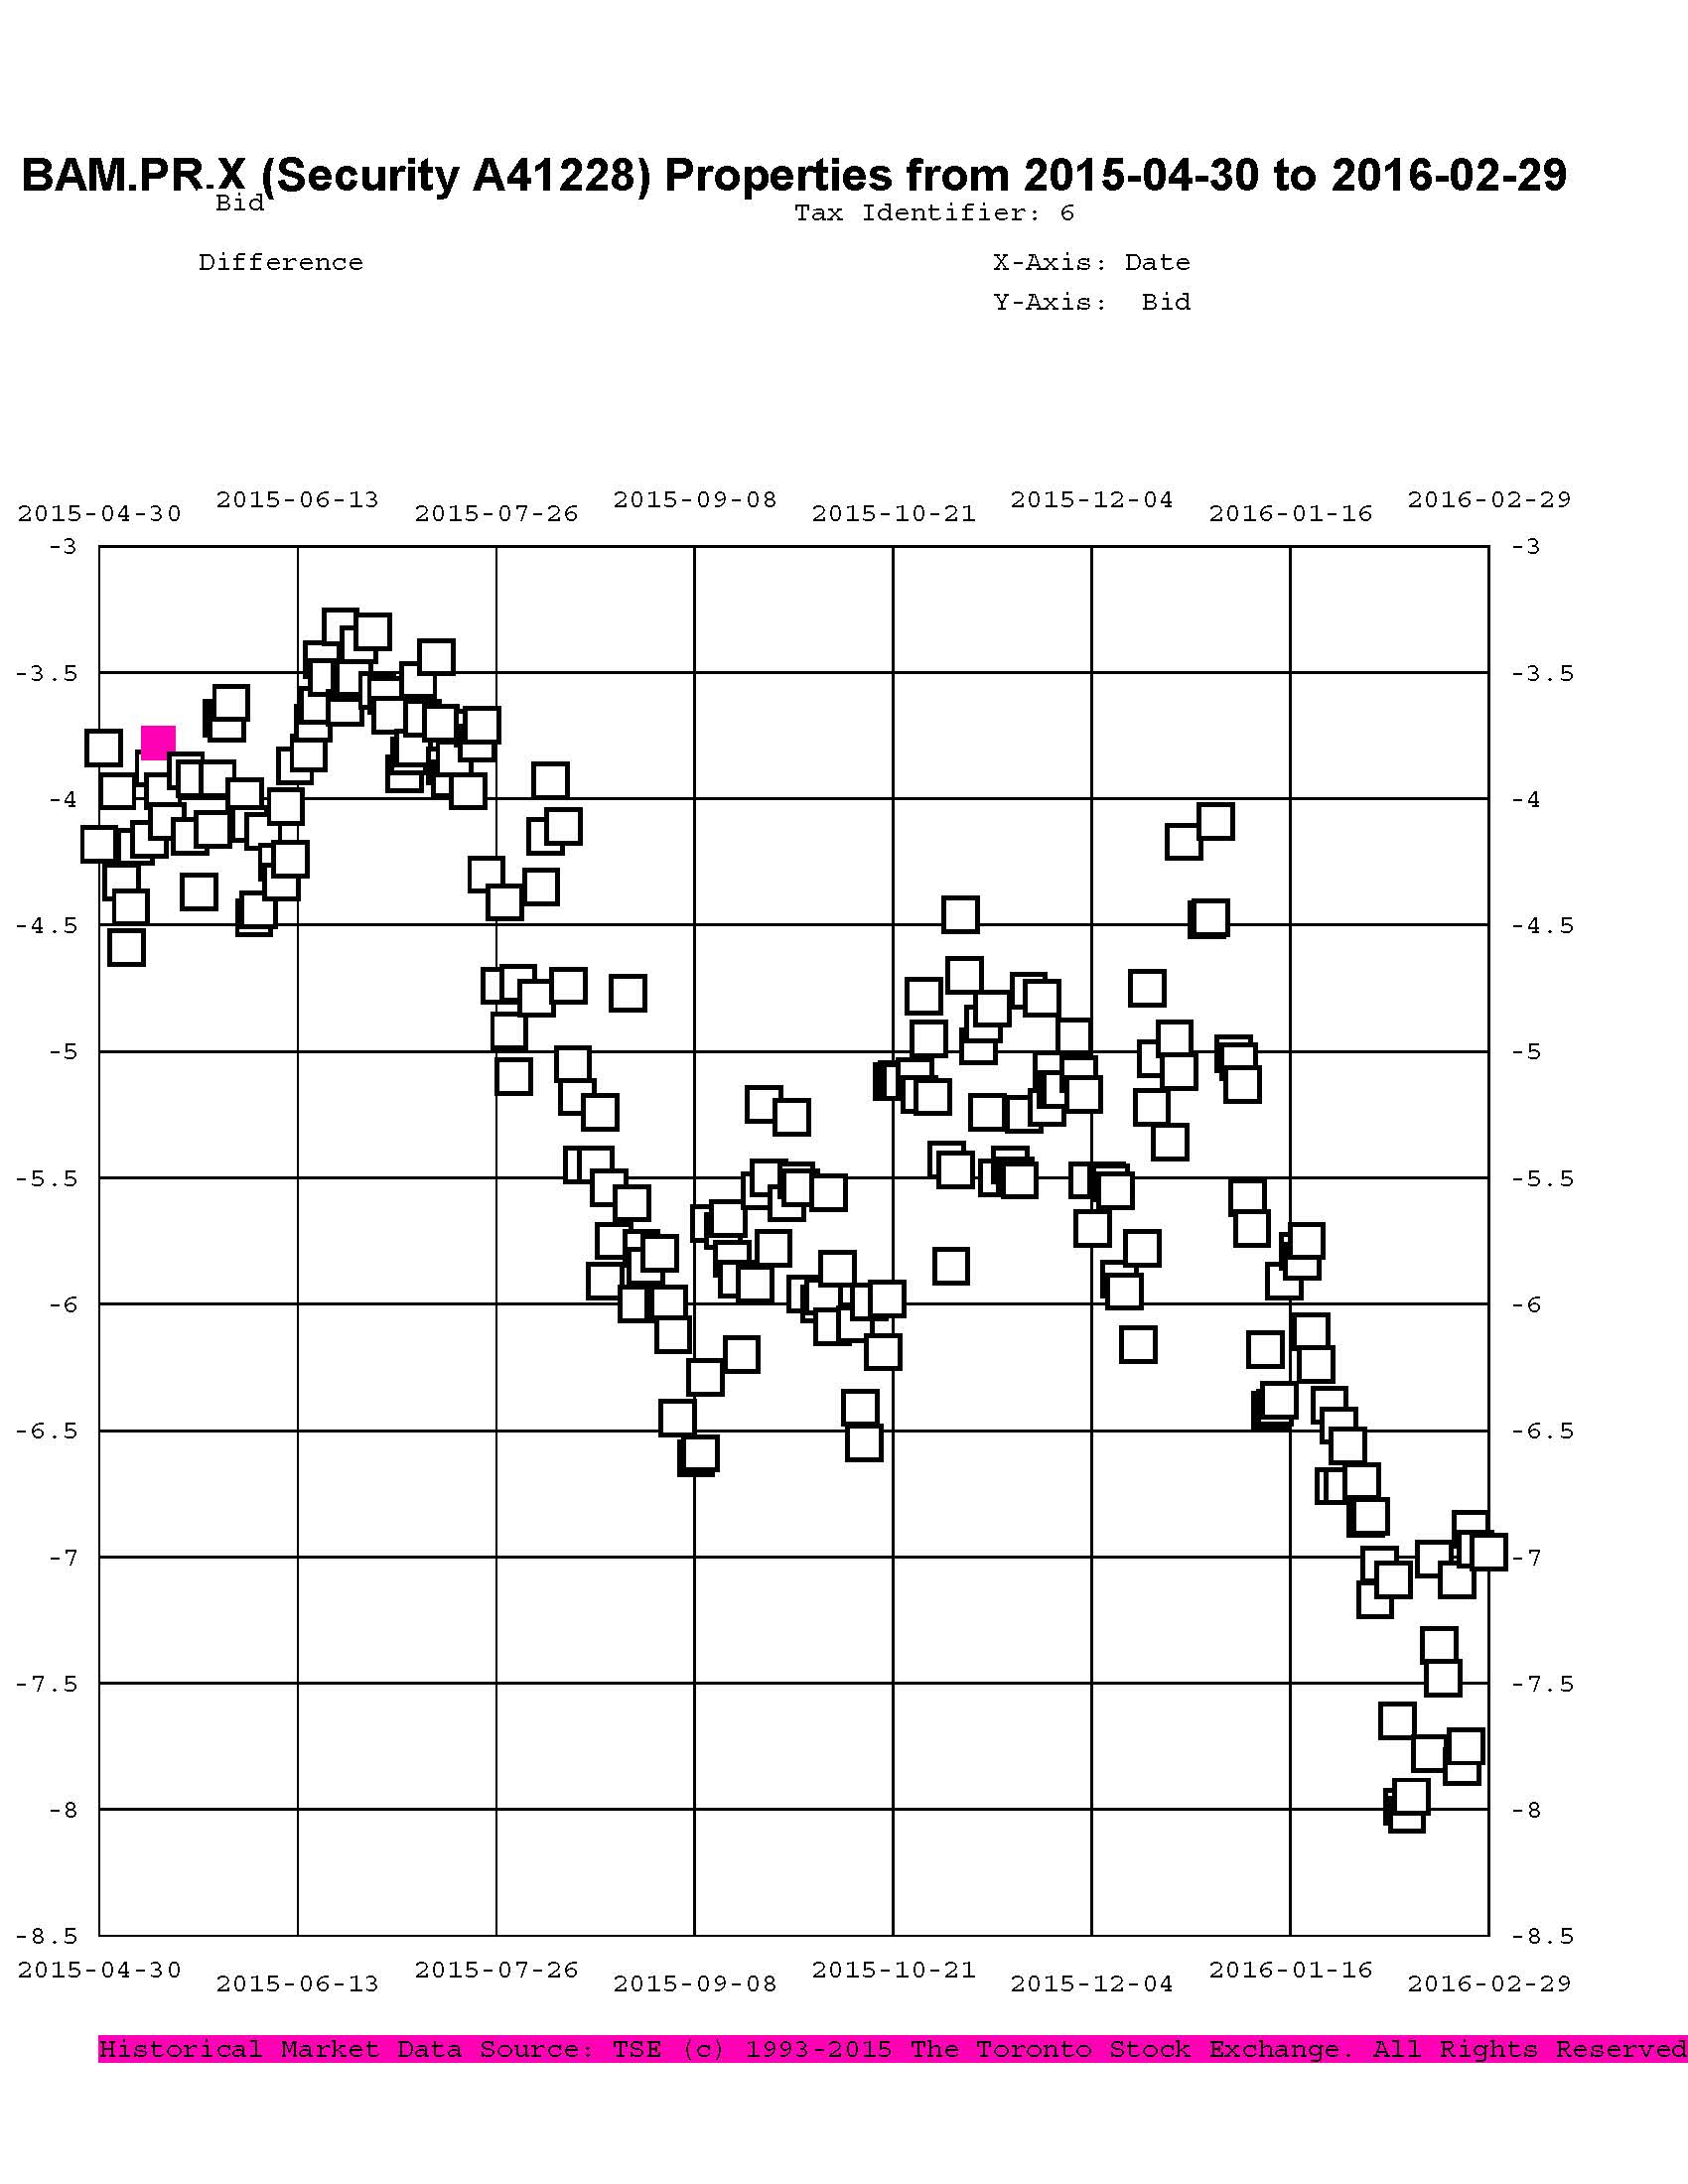
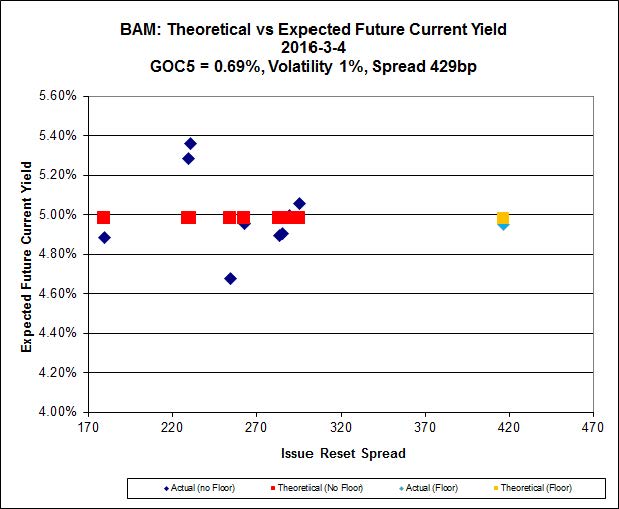
The cheapest issue relative to its peers is BAM.PR.R, resetting at +230bp on 2016-6-30, bid at 13.77 to be $1.29 cheap. BAM.PF.E, resetting at +255 on 2020-3-31 is bid at 17.75 and appears to be $1.41 rich.

Click for Big
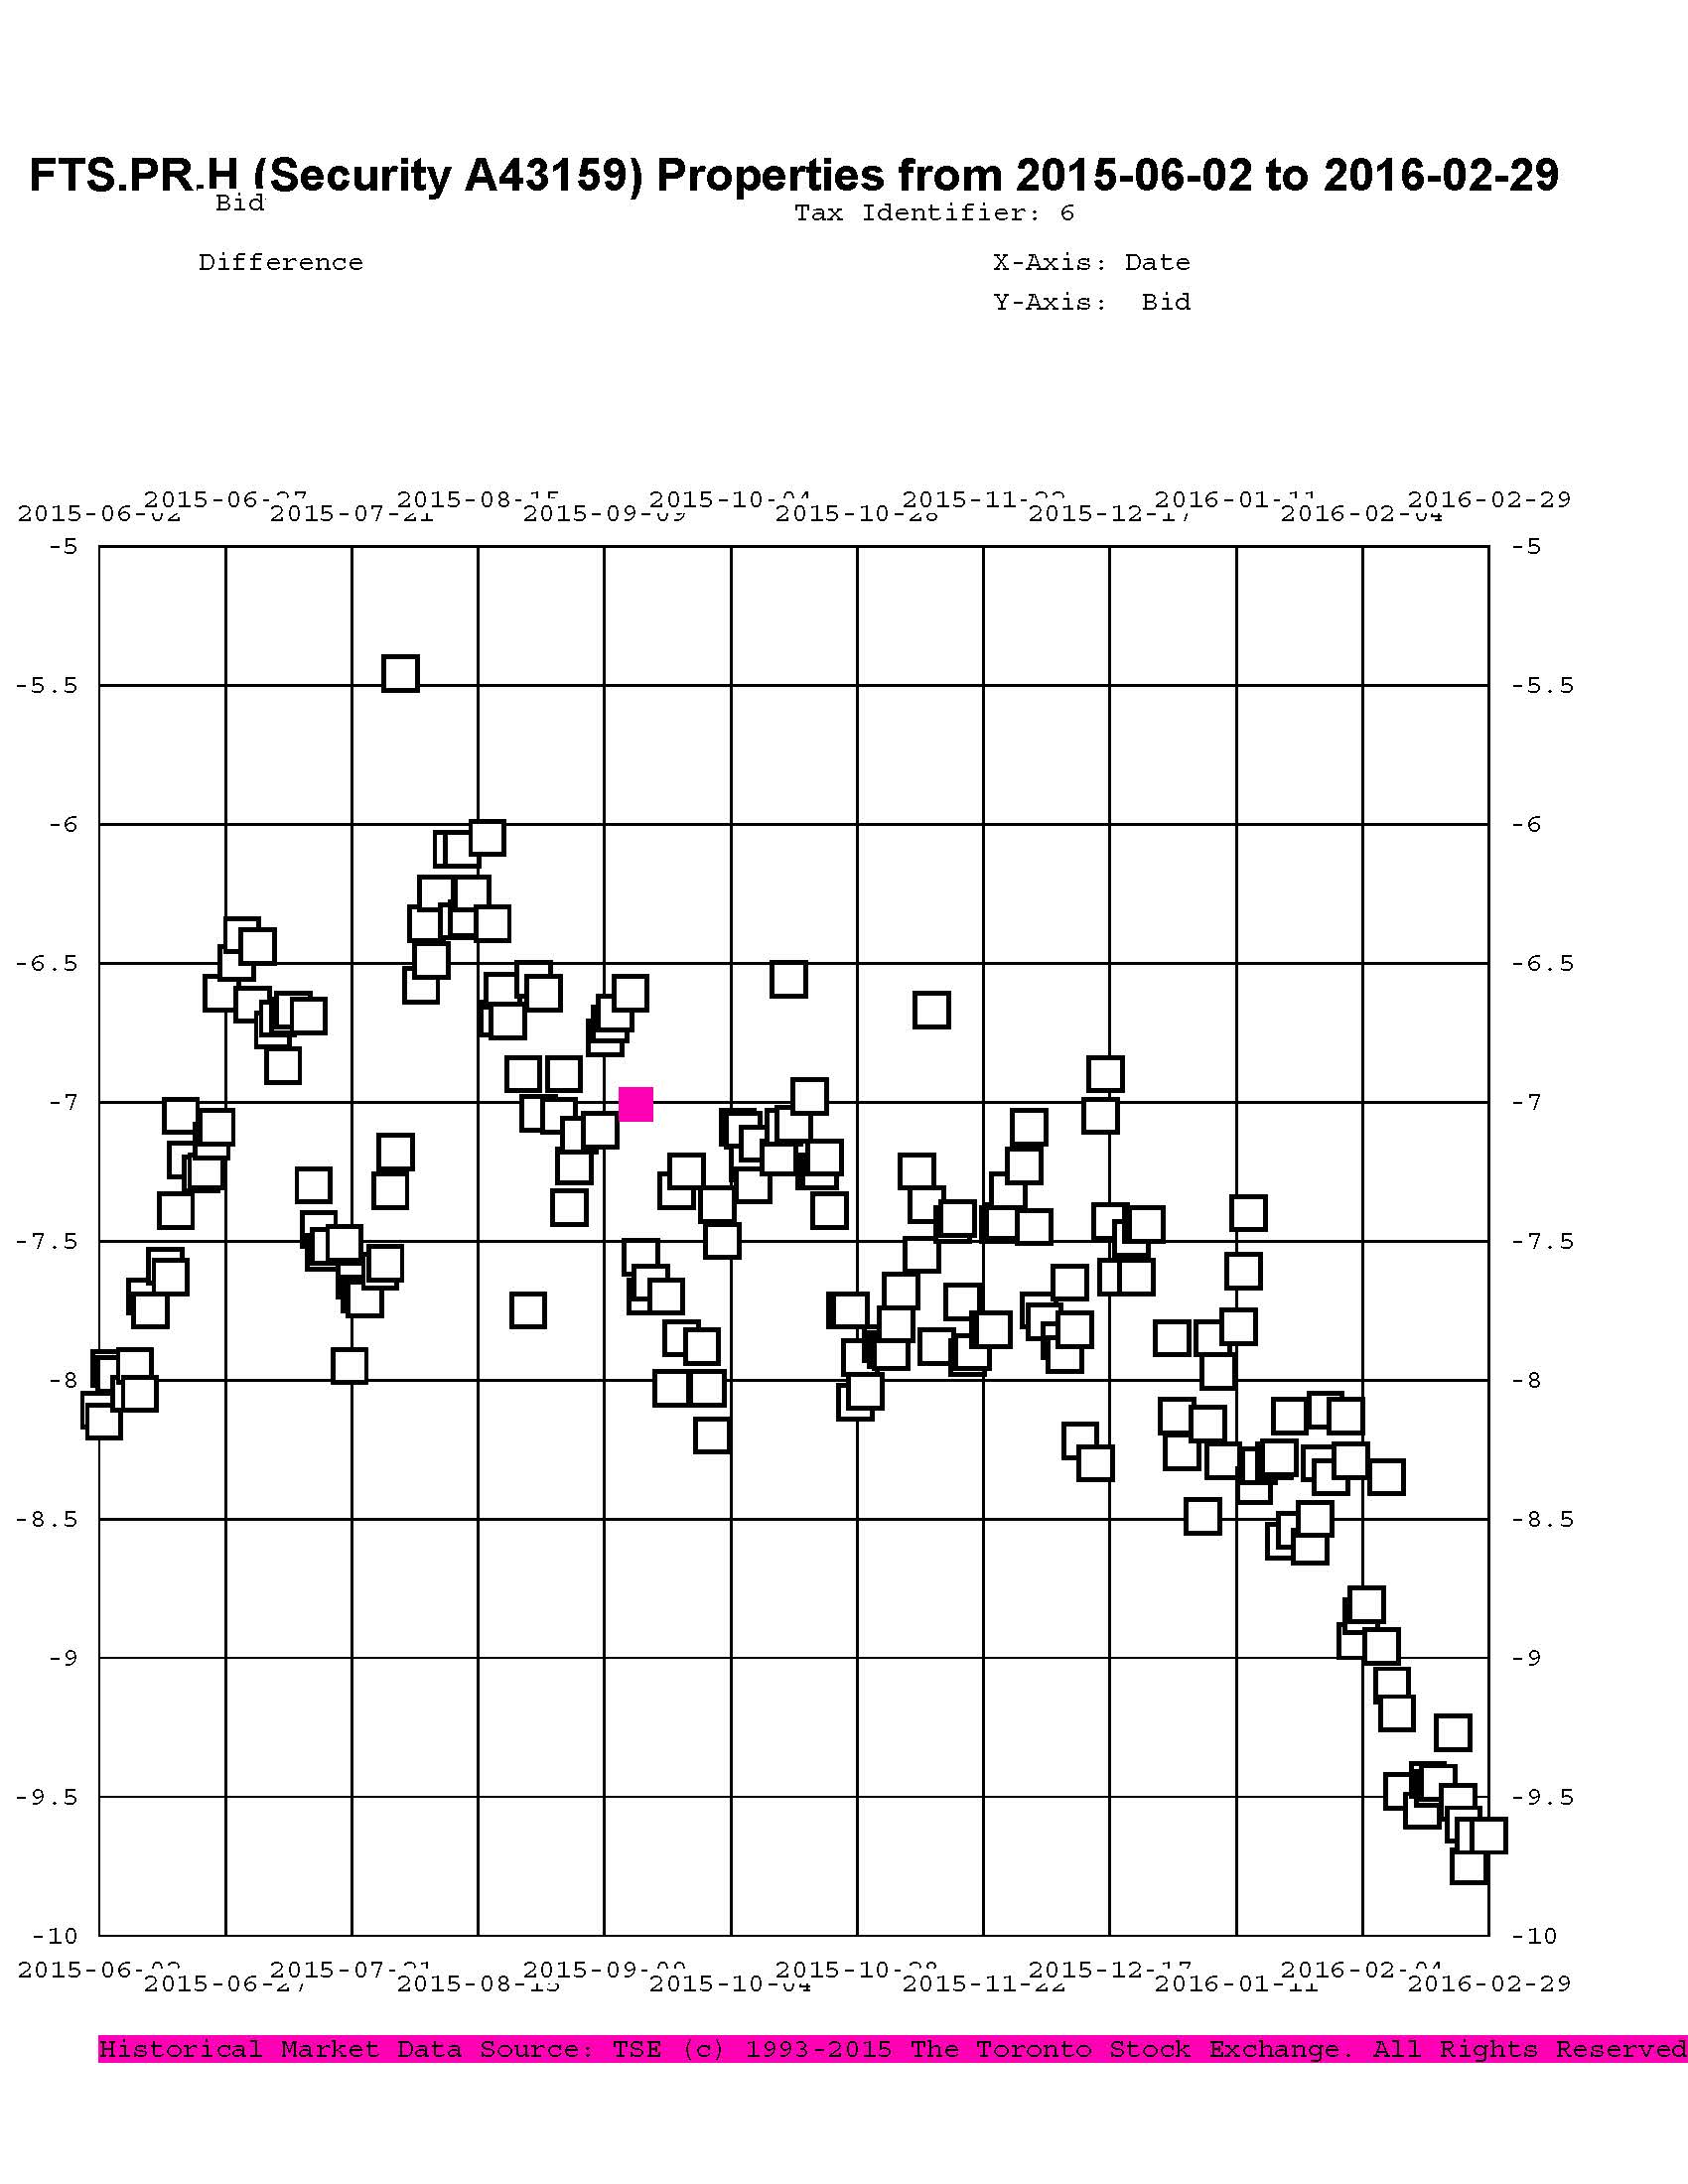
FTS.PR.K, with a spread of +205bp, and bid at 15.32 looks $0.58 expensive and resets 2019-3-1. FTS.PR.H, with a spread of +145bp and resetting 2020-6-1, is bid at 11.20 and is $0.31 cheap.

Click for Big
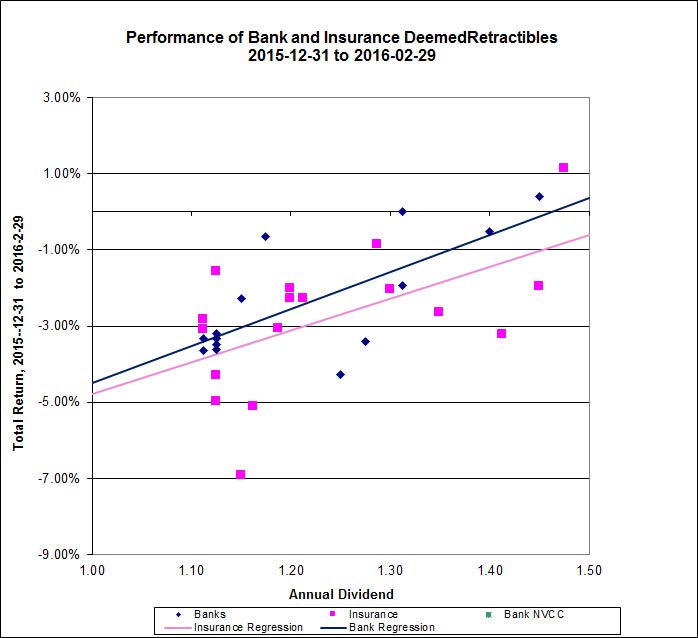
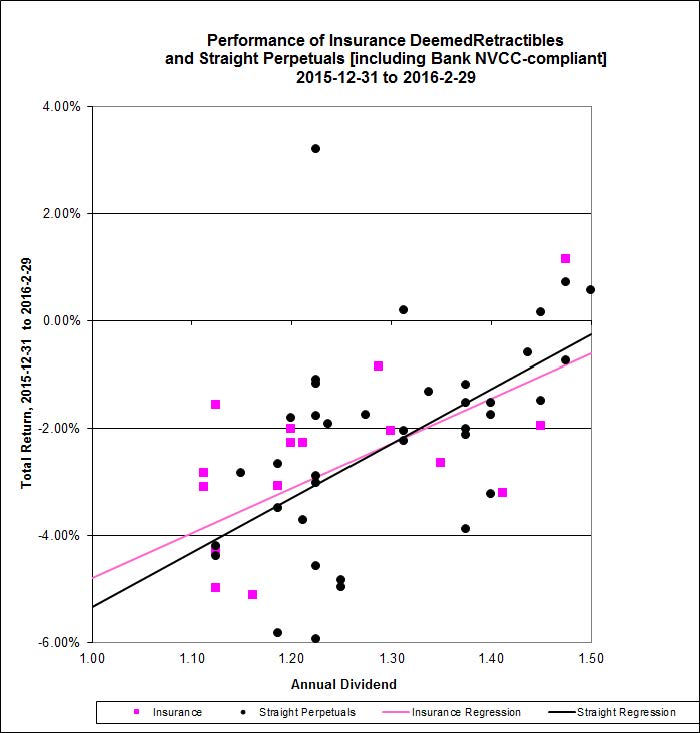
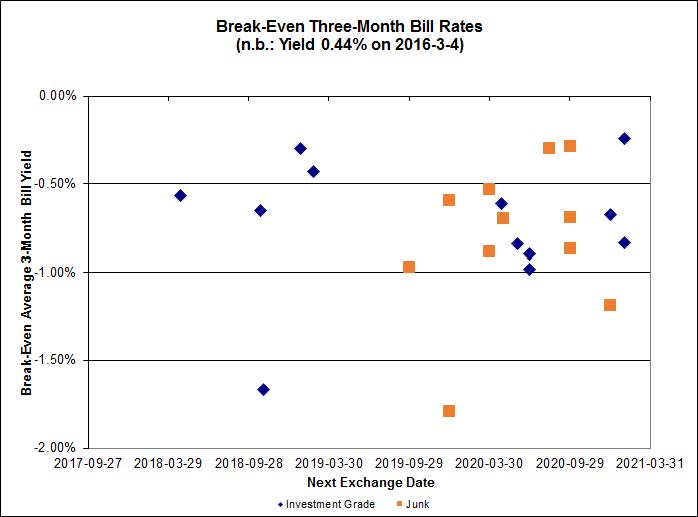
Investment-grade pairs predict an average three-month bill yield over the next five-odd years of -1.02%, with one outlier below -2.00% and two above 0.00%. There are no junk outliers.

Click for Big
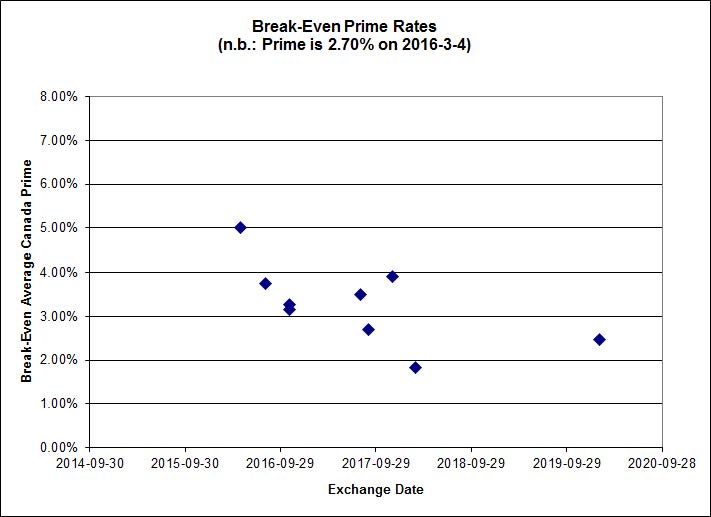
Shall we just say that this exhibits a high level of confidence in the continued rapacity of Canadian banks?
| HIMIPref™ Preferred Indices These values reflect the December 2008 revision of the HIMIPref™ Indices Values are provisional and are finalized monthly |
|||||||
| Index | Mean Current Yield (at bid) |
Median YTW |
Median Average Trading Value |
Median Mod Dur (YTW) |
Issues | Day’s Perf. | Index Value |
| Ratchet | 5.11 % | 6.21 % | 12,617 | 16.42 | 1 | 2.9526 % | 1,534.4 |
| FixedFloater | 7.27 % | 6.38 % | 24,247 | 15.88 | 1 | 2.1094 % | 2,735.2 |
| Floater | 4.55 % | 4.75 % | 74,148 | 15.86 | 4 | -1.2372 % | 1,684.0 |
| OpRet | 0.00 % | 0.00 % | 0 | 0.00 | 0 | 0.0471 % | 2,748.8 |
| SplitShare | 4.84 % | 5.73 % | 73,249 | 2.64 | 7 | 0.0471 % | 3,216.6 |
| Interest-Bearing | 0.00 % | 0.00 % | 0 | 0.00 | 0 | 0.0471 % | 2,509.7 |
| Perpetual-Premium | 5.82 % | 0.80 % | 75,293 | 0.08 | 6 | -0.1521 % | 2,535.9 |
| Perpetual-Discount | 5.71 % | 5.78 % | 100,198 | 14.13 | 33 | -0.2542 % | 2,532.8 |
| FixedReset | 5.56 % | 5.10 % | 208,689 | 14.46 | 86 | -1.0052 % | 1,828.0 |
| Deemed-Retractible | 5.30 % | 5.60 % | 115,808 | 5.13 | 34 | -0.8018 % | 2,565.1 |
| FloatingReset | 3.11 % | 4.89 % | 40,945 | 5.46 | 16 | -0.9745 % | 1,969.8 |
| Performance Highlights | |||
| Issue | Index | Change | Notes |
| BAM.PR.Z | FixedReset | -5.64 % | YTW SCENARIO Maturity Type : Limit Maturity Maturity Date : 2046-03-08 Maturity Price : 17.41 Evaluated at bid price : 17.41 Bid-YTW : 5.57 % |
| FTS.PR.G | FixedReset | -4.76 % | YTW SCENARIO Maturity Type : Limit Maturity Maturity Date : 2046-03-08 Maturity Price : 15.02 Evaluated at bid price : 15.02 Bid-YTW : 5.00 % |
| FTS.PR.H | FixedReset | -4.68 % | YTW SCENARIO Maturity Type : Limit Maturity Maturity Date : 2046-03-08 Maturity Price : 11.20 Evaluated at bid price : 11.20 Bid-YTW : 5.04 % |
| TRP.PR.I | FloatingReset | -4.45 % | YTW SCENARIO Maturity Type : Limit Maturity Maturity Date : 2046-03-08 Maturity Price : 10.51 Evaluated at bid price : 10.51 Bid-YTW : 4.76 % |
| BAM.PR.R | FixedReset | -4.38 % | YTW SCENARIO Maturity Type : Limit Maturity Maturity Date : 2046-03-08 Maturity Price : 13.77 Evaluated at bid price : 13.77 Bid-YTW : 5.66 % |
| TRP.PR.H | FloatingReset | -4.26 % | YTW SCENARIO Maturity Type : Limit Maturity Maturity Date : 2046-03-08 Maturity Price : 9.00 Evaluated at bid price : 9.00 Bid-YTW : 4.77 % |
| HSE.PR.A | FixedReset | -3.74 % | YTW SCENARIO Maturity Type : Limit Maturity Maturity Date : 2046-03-08 Maturity Price : 9.00 Evaluated at bid price : 9.00 Bid-YTW : 6.95 % |
| BAM.PR.X | FixedReset | -3.72 % | YTW SCENARIO Maturity Type : Limit Maturity Maturity Date : 2046-03-08 Maturity Price : 12.95 Evaluated at bid price : 12.95 Bid-YTW : 5.27 % |
| CU.PR.C | FixedReset | -3.63 % | YTW SCENARIO Maturity Type : Limit Maturity Maturity Date : 2046-03-08 Maturity Price : 15.95 Evaluated at bid price : 15.95 Bid-YTW : 5.00 % |
| HSE.PR.E | FixedReset | -3.18 % | YTW SCENARIO Maturity Type : Limit Maturity Maturity Date : 2046-03-08 Maturity Price : 17.04 Evaluated at bid price : 17.04 Bid-YTW : 6.51 % |
| TRP.PR.B | FixedReset | -3.04 % | YTW SCENARIO Maturity Type : Limit Maturity Maturity Date : 2046-03-08 Maturity Price : 10.52 Evaluated at bid price : 10.52 Bid-YTW : 4.83 % |
| TD.PF.A | FixedReset | -2.89 % | YTW SCENARIO Maturity Type : Limit Maturity Maturity Date : 2046-03-08 Maturity Price : 16.80 Evaluated at bid price : 16.80 Bid-YTW : 4.73 % |
| NA.PR.W | FixedReset | -2.70 % | YTW SCENARIO Maturity Type : Limit Maturity Maturity Date : 2046-03-08 Maturity Price : 15.86 Evaluated at bid price : 15.86 Bid-YTW : 5.04 % |
| VNR.PR.A | FixedReset | -2.69 % | YTW SCENARIO Maturity Type : Limit Maturity Maturity Date : 2046-03-08 Maturity Price : 16.67 Evaluated at bid price : 16.67 Bid-YTW : 5.49 % |
| MFC.PR.J | FixedReset | -2.58 % | YTW SCENARIO Maturity Type : Hard Maturity Maturity Date : 2025-01-31 Maturity Price : 25.00 Evaluated at bid price : 17.00 Bid-YTW : 8.78 % |
| HSE.PR.C | FixedReset | -2.54 % | YTW SCENARIO Maturity Type : Limit Maturity Maturity Date : 2046-03-08 Maturity Price : 15.35 Evaluated at bid price : 15.35 Bid-YTW : 6.68 % |
| BMO.PR.Q | FixedReset | -2.44 % | YTW SCENARIO Maturity Type : Hard Maturity Maturity Date : 2022-01-31 Maturity Price : 25.00 Evaluated at bid price : 18.00 Bid-YTW : 8.12 % |
| RY.PR.J | FixedReset | -2.38 % | YTW SCENARIO Maturity Type : Limit Maturity Maturity Date : 2046-03-08 Maturity Price : 18.01 Evaluated at bid price : 18.01 Bid-YTW : 4.88 % |
| BNS.PR.B | FloatingReset | -2.24 % | YTW SCENARIO Maturity Type : Hard Maturity Maturity Date : 2022-01-31 Maturity Price : 25.00 Evaluated at bid price : 20.50 Bid-YTW : 5.76 % |
| FTS.PR.K | FixedReset | -2.23 % | YTW SCENARIO Maturity Type : Limit Maturity Maturity Date : 2046-03-08 Maturity Price : 15.32 Evaluated at bid price : 15.32 Bid-YTW : 4.87 % |
| TRP.PR.C | FixedReset | -2.21 % | YTW SCENARIO Maturity Type : Limit Maturity Maturity Date : 2046-03-08 Maturity Price : 11.07 Evaluated at bid price : 11.07 Bid-YTW : 5.16 % |
| TRP.PR.G | FixedReset | -2.13 % | YTW SCENARIO Maturity Type : Limit Maturity Maturity Date : 2046-03-08 Maturity Price : 18.40 Evaluated at bid price : 18.40 Bid-YTW : 5.07 % |
| PWF.PR.A | Floater | -2.06 % | YTW SCENARIO Maturity Type : Limit Maturity Maturity Date : 2046-03-08 Maturity Price : 11.40 Evaluated at bid price : 11.40 Bid-YTW : 4.18 % |
| BMO.PR.T | FixedReset | -2.03 % | YTW SCENARIO Maturity Type : Limit Maturity Maturity Date : 2046-03-08 Maturity Price : 16.91 Evaluated at bid price : 16.91 Bid-YTW : 4.66 % |
| MFC.PR.B | Deemed-Retractible | -1.96 % | YTW SCENARIO Maturity Type : Hard Maturity Maturity Date : 2025-01-31 Maturity Price : 25.00 Evaluated at bid price : 20.56 Bid-YTW : 7.43 % |
| RY.PR.H | FixedReset | -1.89 % | YTW SCENARIO Maturity Type : Limit Maturity Maturity Date : 2046-03-08 Maturity Price : 17.11 Evaluated at bid price : 17.11 Bid-YTW : 4.63 % |
| SLF.PR.A | Deemed-Retractible | -1.89 % | YTW SCENARIO Maturity Type : Hard Maturity Maturity Date : 2025-01-31 Maturity Price : 25.00 Evaluated at bid price : 21.27 Bid-YTW : 7.03 % |
| RY.PR.M | FixedReset | -1.88 % | YTW SCENARIO Maturity Type : Limit Maturity Maturity Date : 2046-03-08 Maturity Price : 17.70 Evaluated at bid price : 17.70 Bid-YTW : 4.84 % |
| NA.PR.S | FixedReset | -1.86 % | YTW SCENARIO Maturity Type : Limit Maturity Maturity Date : 2046-03-08 Maturity Price : 16.90 Evaluated at bid price : 16.90 Bid-YTW : 4.91 % |
| MFC.PR.C | Deemed-Retractible | -1.86 % | YTW SCENARIO Maturity Type : Hard Maturity Maturity Date : 2025-01-31 Maturity Price : 25.00 Evaluated at bid price : 20.07 Bid-YTW : 7.61 % |
| TRP.PR.D | FixedReset | -1.84 % | YTW SCENARIO Maturity Type : Limit Maturity Maturity Date : 2046-03-08 Maturity Price : 17.10 Evaluated at bid price : 17.10 Bid-YTW : 4.81 % |
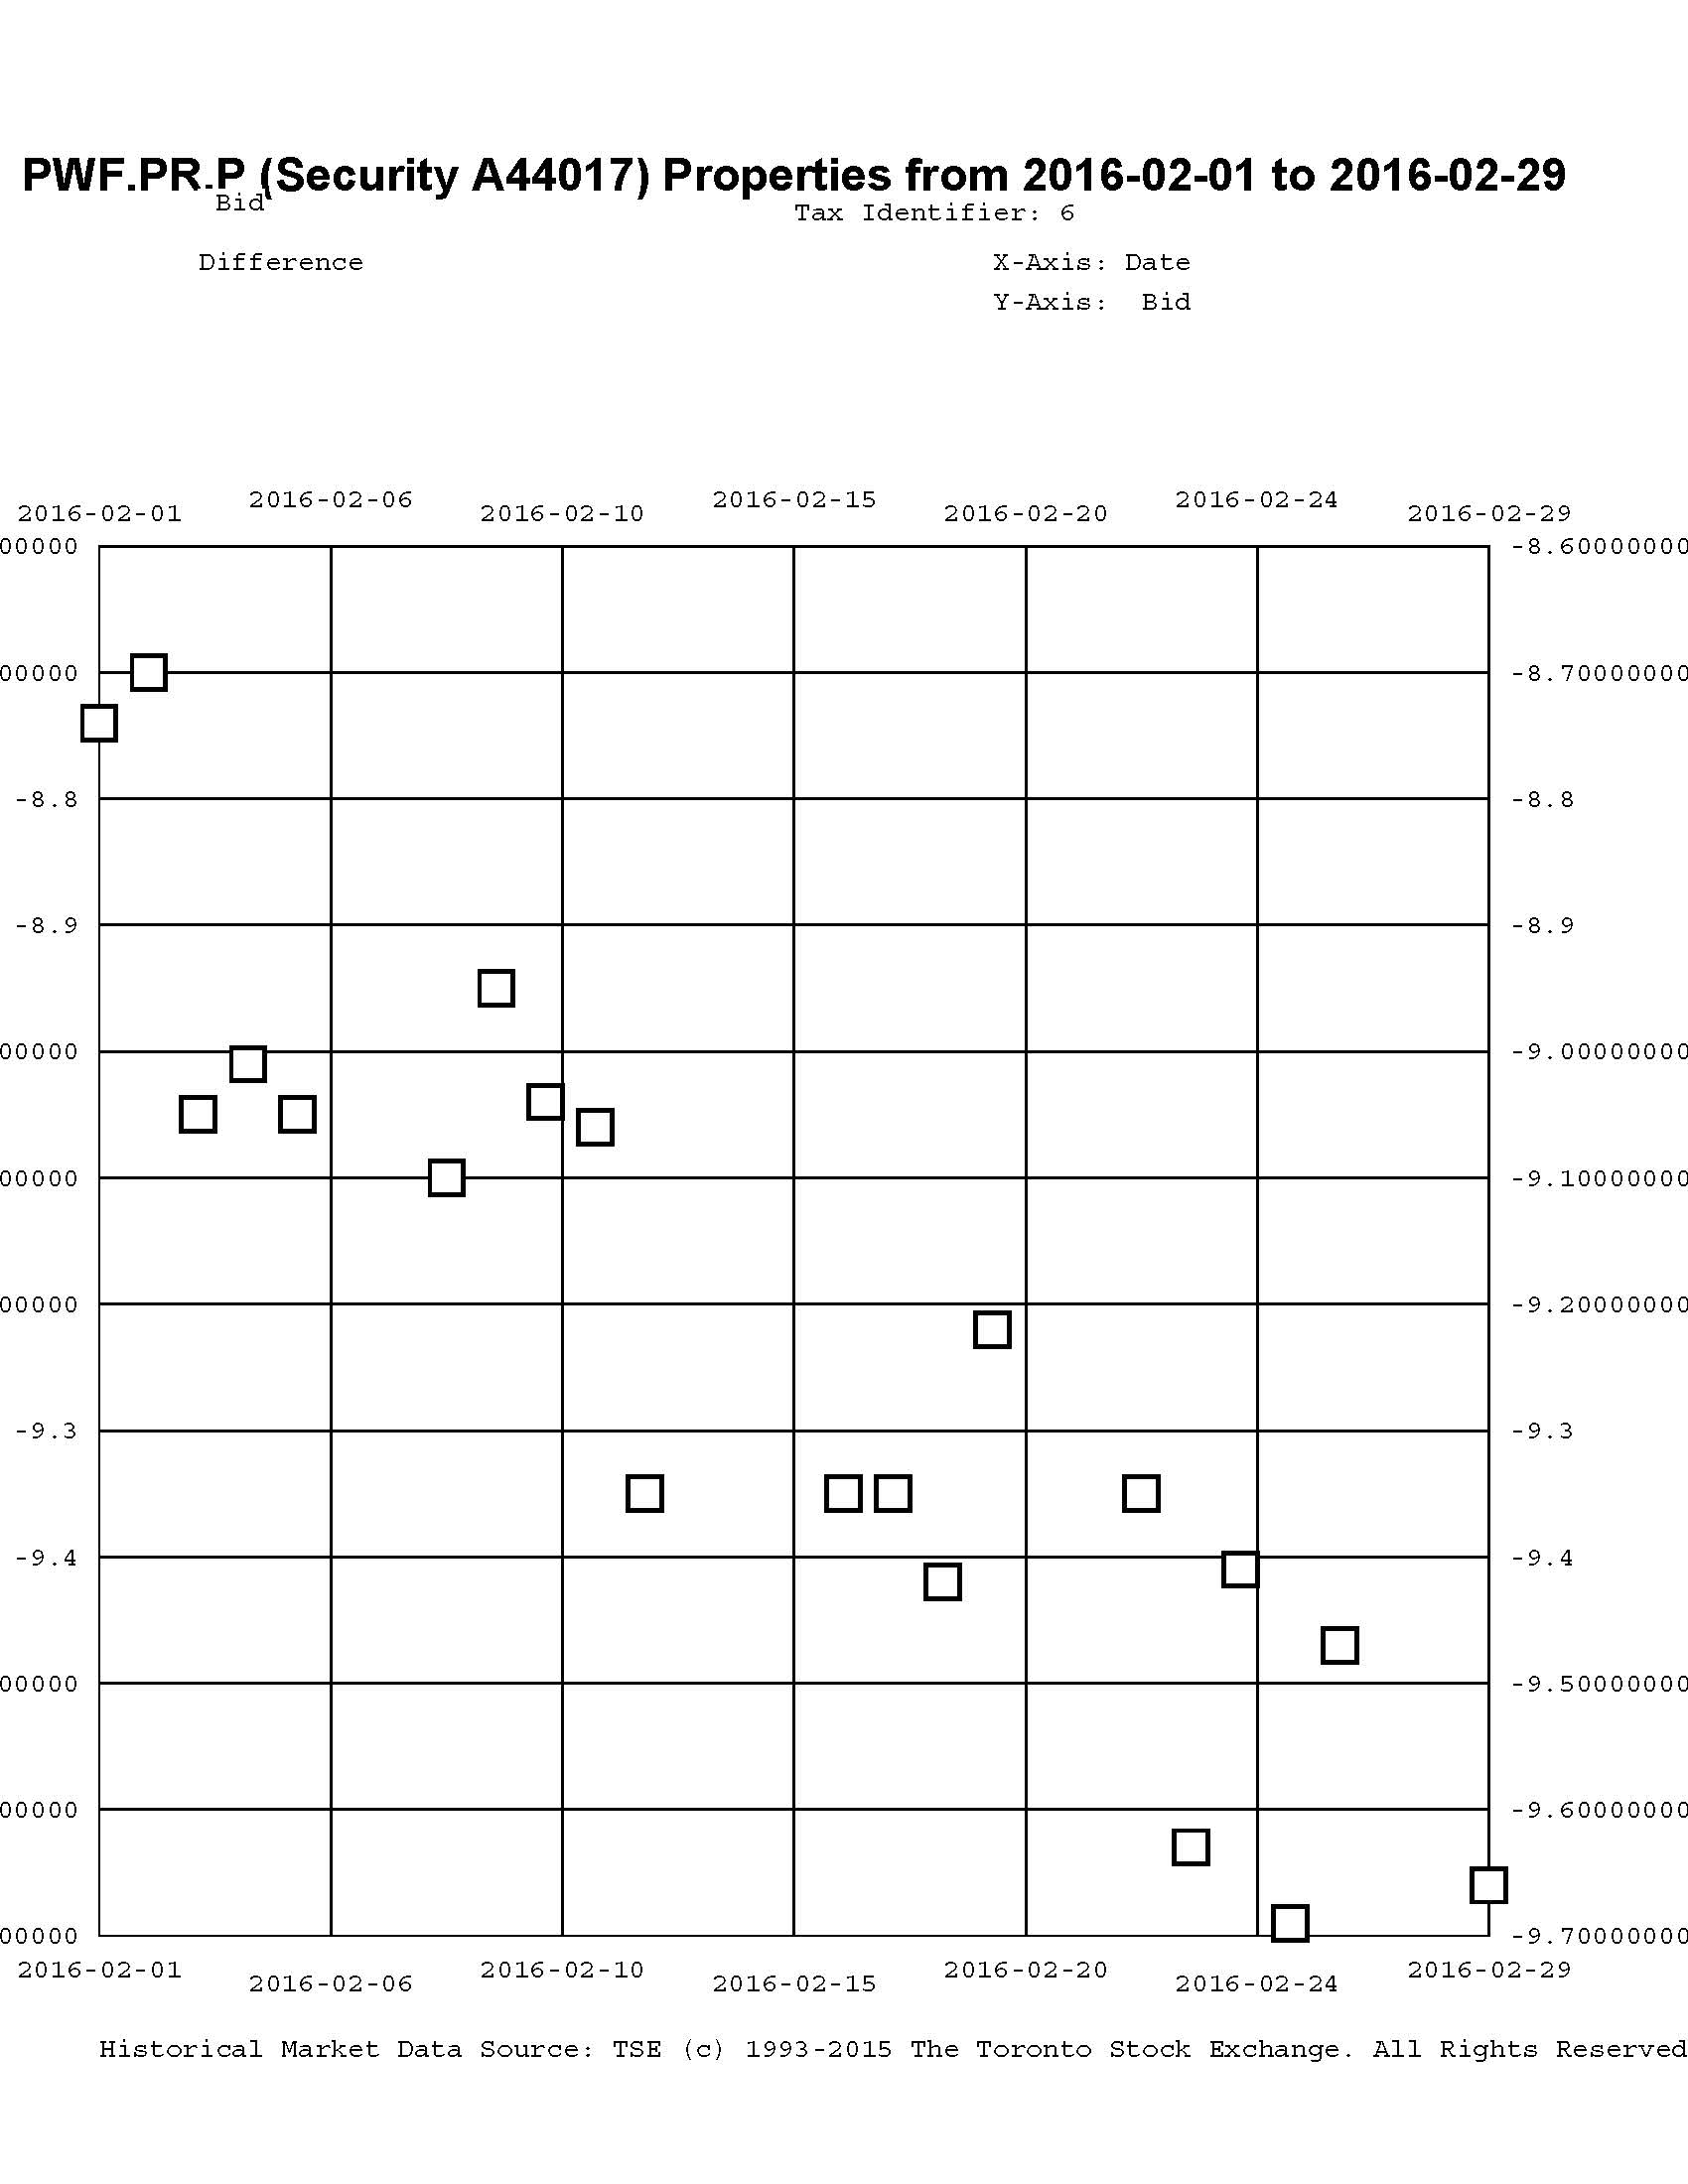
| PWF.PR.P | FixedReset | -1.80 % | YTW SCENARIO Maturity Type : Limit Maturity Maturity Date : 2046-03-08 Maturity Price : 11.98 Evaluated at bid price : 11.98 Bid-YTW : 4.88 % |
| BNS.PR.Z | FixedReset | -1.78 % | YTW SCENARIO Maturity Type : Hard Maturity Maturity Date : 2022-01-31 Maturity Price : 25.00 Evaluated at bid price : 18.80 Bid-YTW : 7.39 % |
| MFC.PR.K | FixedReset | -1.77 % | YTW SCENARIO Maturity Type : Hard Maturity Maturity Date : 2025-01-31 Maturity Price : 25.00 Evaluated at bid price : 15.50 Bid-YTW : 9.73 % |
| SLF.PR.C | Deemed-Retractible | -1.76 % | YTW SCENARIO Maturity Type : Hard Maturity Maturity Date : 2025-01-31 Maturity Price : 25.00 Evaluated at bid price : 20.07 Bid-YTW : 7.53 % |
| TRP.PR.F | FloatingReset | -1.69 % | YTW SCENARIO Maturity Type : Limit Maturity Maturity Date : 2046-03-08 Maturity Price : 11.65 Evaluated at bid price : 11.65 Bid-YTW : 5.06 % |
| SLF.PR.E | Deemed-Retractible | -1.67 % | YTW SCENARIO Maturity Type : Hard Maturity Maturity Date : 2025-01-31 Maturity Price : 25.00 Evaluated at bid price : 20.05 Bid-YTW : 7.60 % |
| BAM.PF.A | FixedReset | -1.66 % | YTW SCENARIO Maturity Type : Limit Maturity Maturity Date : 2046-03-08 Maturity Price : 17.75 Evaluated at bid price : 17.75 Bid-YTW : 5.38 % |
| SLF.PR.B | Deemed-Retractible | -1.60 % | YTW SCENARIO Maturity Type : Hard Maturity Maturity Date : 2025-01-31 Maturity Price : 25.00 Evaluated at bid price : 21.54 Bid-YTW : 6.90 % |
| SLF.PR.D | Deemed-Retractible | -1.57 % | YTW SCENARIO Maturity Type : Hard Maturity Maturity Date : 2025-01-31 Maturity Price : 25.00 Evaluated at bid price : 20.01 Bid-YTW : 7.57 % |
| BNS.PR.F | FloatingReset | -1.57 % | YTW SCENARIO Maturity Type : Hard Maturity Maturity Date : 2022-01-31 Maturity Price : 25.00 Evaluated at bid price : 18.17 Bid-YTW : 7.68 % |
| MFC.PR.N | FixedReset | -1.46 % | YTW SCENARIO Maturity Type : Hard Maturity Maturity Date : 2025-01-31 Maturity Price : 25.00 Evaluated at bid price : 17.50 Bid-YTW : 8.27 % |
| BMO.PR.S | FixedReset | -1.44 % | YTW SCENARIO Maturity Type : Limit Maturity Maturity Date : 2046-03-08 Maturity Price : 17.09 Evaluated at bid price : 17.09 Bid-YTW : 4.73 % |
| HSE.PR.G | FixedReset | -1.44 % | YTW SCENARIO Maturity Type : Limit Maturity Maturity Date : 2046-03-08 Maturity Price : 17.15 Evaluated at bid price : 17.15 Bid-YTW : 6.46 % |
| FTS.PR.M | FixedReset | -1.41 % | YTW SCENARIO Maturity Type : Limit Maturity Maturity Date : 2046-03-08 Maturity Price : 16.75 Evaluated at bid price : 16.75 Bid-YTW : 5.08 % |
| CM.PR.O | FixedReset | -1.39 % | YTW SCENARIO Maturity Type : Limit Maturity Maturity Date : 2046-03-08 Maturity Price : 16.98 Evaluated at bid price : 16.98 Bid-YTW : 4.78 % |
| BNS.PR.C | FloatingReset | -1.36 % | YTW SCENARIO Maturity Type : Hard Maturity Maturity Date : 2022-01-31 Maturity Price : 25.00 Evaluated at bid price : 20.98 Bid-YTW : 5.53 % |
| FTS.PR.J | Perpetual-Discount | -1.35 % | YTW SCENARIO Maturity Type : Limit Maturity Maturity Date : 2046-03-08 Maturity Price : 21.16 Evaluated at bid price : 21.16 Bid-YTW : 5.66 % |
| GWO.PR.R | Deemed-Retractible | -1.34 % | YTW SCENARIO Maturity Type : Hard Maturity Maturity Date : 2025-01-31 Maturity Price : 25.00 Evaluated at bid price : 21.32 Bid-YTW : 7.05 % |
| CM.PR.P | FixedReset | -1.31 % | YTW SCENARIO Maturity Type : Limit Maturity Maturity Date : 2046-03-08 Maturity Price : 16.60 Evaluated at bid price : 16.60 Bid-YTW : 4.78 % |
| PWF.PR.L | Perpetual-Discount | -1.29 % | YTW SCENARIO Maturity Type : Limit Maturity Maturity Date : 2046-03-08 Maturity Price : 21.95 Evaluated at bid price : 22.19 Bid-YTW : 5.81 % |
| SLF.PR.J | FloatingReset | -1.29 % | YTW SCENARIO Maturity Type : Hard Maturity Maturity Date : 2025-01-31 Maturity Price : 25.00 Evaluated at bid price : 11.50 Bid-YTW : 11.81 % |
| MFC.PR.M | FixedReset | -1.29 % | YTW SCENARIO Maturity Type : Hard Maturity Maturity Date : 2025-01-31 Maturity Price : 25.00 Evaluated at bid price : 17.65 Bid-YTW : 8.22 % |
| RY.PR.Z | FixedReset | -1.26 % | YTW SCENARIO Maturity Type : Limit Maturity Maturity Date : 2046-03-08 Maturity Price : 17.18 Evaluated at bid price : 17.18 Bid-YTW : 4.55 % |
| GWO.PR.O | FloatingReset | -1.25 % | YTW SCENARIO Maturity Type : Hard Maturity Maturity Date : 2025-01-31 Maturity Price : 25.00 Evaluated at bid price : 11.06 Bid-YTW : 12.16 % |
| GWO.PR.P | Deemed-Retractible | -1.25 % | YTW SCENARIO Maturity Type : Hard Maturity Maturity Date : 2025-01-31 Maturity Price : 25.00 Evaluated at bid price : 23.73 Bid-YTW : 6.14 % |
| BIP.PR.A | FixedReset | -1.25 % | YTW SCENARIO Maturity Type : Limit Maturity Maturity Date : 2046-03-08 Maturity Price : 18.22 Evaluated at bid price : 18.22 Bid-YTW : 5.96 % |
| RY.PR.W | Perpetual-Discount | -1.25 % | YTW SCENARIO Maturity Type : Limit Maturity Maturity Date : 2046-03-08 Maturity Price : 22.71 Evaluated at bid price : 23.00 Bid-YTW : 5.36 % |
| IFC.PR.C | FixedReset | -1.22 % | YTW SCENARIO Maturity Type : Hard Maturity Maturity Date : 2025-01-31 Maturity Price : 25.00 Evaluated at bid price : 16.20 Bid-YTW : 9.55 % |
| TRP.PR.E | FixedReset | -1.21 % | YTW SCENARIO Maturity Type : Limit Maturity Maturity Date : 2046-03-08 Maturity Price : 18.00 Evaluated at bid price : 18.00 Bid-YTW : 4.63 % |
| GWO.PR.H | Deemed-Retractible | -1.20 % | YTW SCENARIO Maturity Type : Hard Maturity Maturity Date : 2025-01-31 Maturity Price : 25.00 Evaluated at bid price : 21.49 Bid-YTW : 6.99 % |
| MFC.PR.H | FixedReset | -1.19 % | YTW SCENARIO Maturity Type : Hard Maturity Maturity Date : 2025-01-31 Maturity Price : 25.00 Evaluated at bid price : 19.15 Bid-YTW : 7.62 % |
| MFC.PR.G | FixedReset | -1.19 % | YTW SCENARIO Maturity Type : Hard Maturity Maturity Date : 2025-01-31 Maturity Price : 25.00 Evaluated at bid price : 17.49 Bid-YTW : 8.60 % |
| BAM.PR.K | Floater | -1.18 % | YTW SCENARIO Maturity Type : Limit Maturity Maturity Date : 2046-03-08 Maturity Price : 10.01 Evaluated at bid price : 10.01 Bid-YTW : 4.79 % |
| FTS.PR.F | Perpetual-Discount | -1.13 % | YTW SCENARIO Maturity Type : Limit Maturity Maturity Date : 2046-03-08 Maturity Price : 21.65 Evaluated at bid price : 21.90 Bid-YTW : 5.62 % |
| BMO.PR.W | FixedReset | -1.06 % | YTW SCENARIO Maturity Type : Limit Maturity Maturity Date : 2046-03-08 Maturity Price : 16.81 Evaluated at bid price : 16.81 Bid-YTW : 4.65 % |
| BNS.PR.Y | FixedReset | -1.05 % | YTW SCENARIO Maturity Type : Hard Maturity Maturity Date : 2022-01-31 Maturity Price : 25.00 Evaluated at bid price : 18.81 Bid-YTW : 7.05 % |
| BAM.PR.T | FixedReset | -1.01 % | YTW SCENARIO Maturity Type : Limit Maturity Maturity Date : 2046-03-08 Maturity Price : 14.75 Evaluated at bid price : 14.75 Bid-YTW : 5.39 % |
| BMO.PR.M | FixedReset | 1.16 % | YTW SCENARIO Maturity Type : Hard Maturity Maturity Date : 2022-01-31 Maturity Price : 25.00 Evaluated at bid price : 23.50 Bid-YTW : 3.99 % |
| CIU.PR.A | Perpetual-Discount | 1.34 % | YTW SCENARIO Maturity Type : Limit Maturity Maturity Date : 2046-03-08 Maturity Price : 20.38 Evaluated at bid price : 20.38 Bid-YTW : 5.69 % |
| TD.PR.Y | FixedReset | 1.36 % | YTW SCENARIO Maturity Type : Hard Maturity Maturity Date : 2022-01-31 Maturity Price : 25.00 Evaluated at bid price : 23.80 Bid-YTW : 3.94 % |
| TD.PF.C | FixedReset | 1.74 % | YTW SCENARIO Maturity Type : Limit Maturity Maturity Date : 2046-03-08 Maturity Price : 16.91 Evaluated at bid price : 16.91 Bid-YTW : 4.68 % |
| TD.PF.E | FixedReset | 2.11 % | YTW SCENARIO Maturity Type : Limit Maturity Maturity Date : 2046-03-08 Maturity Price : 19.40 Evaluated at bid price : 19.40 Bid-YTW : 4.71 % |
| BAM.PR.G | FixedFloater | 2.11 % | YTW SCENARIO Maturity Type : Limit Maturity Maturity Date : 2046-03-08 Maturity Price : 25.00 Evaluated at bid price : 13.07 Bid-YTW : 6.38 % |
| BAM.PR.E | Ratchet | 2.95 % | YTW SCENARIO Maturity Type : Limit Maturity Maturity Date : 2046-03-08 Maturity Price : 25.00 Evaluated at bid price : 13.25 Bid-YTW : 6.21 % |
| Volume Highlights | |||
| Issue | Index | Shares Traded |
Notes |
| RY.PR.R | FixedReset | 451,304 | Recent new issue. YTW SCENARIO Maturity Type : Call Maturity Date : 2021-08-24 Maturity Price : 25.00 Evaluated at bid price : 25.22 Bid-YTW : 5.35 % |
| TD.PF.A | FixedReset | 131,588 | RBC crossed 10,000 at 17.15. Desjardins crossed blocks of 16,800 and 100,000 at the same price. YTW SCENARIO Maturity Type : Limit Maturity Maturity Date : 2046-03-08 Maturity Price : 16.80 Evaluated at bid price : 16.80 Bid-YTW : 4.73 % |
| RY.PR.Q | FixedReset | 120,522 | TD crossed two blocks of 39,000 each, both at 25.50. YTW SCENARIO Maturity Type : Limit Maturity Maturity Date : 2046-03-08 Maturity Price : 23.29 Evaluated at bid price : 25.45 Bid-YTW : 5.21 % |
| NA.PR.S | FixedReset | 120,516 | Nesbitt crossed blocks of 50,000 and 61,600, both at 17.00. YTW SCENARIO Maturity Type : Limit Maturity Maturity Date : 2046-03-08 Maturity Price : 16.90 Evaluated at bid price : 16.90 Bid-YTW : 4.91 % |
| CU.PR.I | FixedReset | 67,932 | RBC crossed 50,000 at 25.20. YTW SCENARIO Maturity Type : Limit Maturity Maturity Date : 2046-03-08 Maturity Price : 23.23 Evaluated at bid price : 25.15 Bid-YTW : 4.38 % |
| TD.PF.G | FixedReset | 64,167 | TD crossed 39,000 at 25.50. YTW SCENARIO Maturity Type : Limit Maturity Maturity Date : 2046-03-08 Maturity Price : 23.30 Evaluated at bid price : 25.46 Bid-YTW : 5.28 % |
| There were 45 other index-included issues trading in excess of 10,000 shares. | |||
| Wide Spread Highlights | ||
| Issue | Index | Quote Data and Yield Notes |
| TD.PR.T | FloatingReset | Quote: 21.36 – 22.22 Spot Rate : 0.8600 Average : 0.5746 YTW SCENARIO |
| TRP.PR.H | FloatingReset | Quote: 9.00 – 9.74 Spot Rate : 0.7400 Average : 0.4833 YTW SCENARIO |
| TD.PF.A | FixedReset | Quote: 16.80 – 17.39 Spot Rate : 0.5900 Average : 0.3668 YTW SCENARIO |
| BAM.PR.Z | FixedReset | Quote: 17.41 – 17.99 Spot Rate : 0.5800 Average : 0.3890 YTW SCENARIO |
| GWO.PR.O | FloatingReset | Quote: 11.06 – 12.00 Spot Rate : 0.9400 Average : 0.7574 YTW SCENARIO |
| FTS.PR.M | FixedReset | Quote: 16.75 – 17.30 Spot Rate : 0.5500 Average : 0.3753 YTW SCENARIO |