It will be recalled that BAM.PR.X will reset to 2.727% (paid on par) effective July 1.
Holders of BAM.PR.X have the option to convert to FloatingResets, which will pay 3-month bills plus 180bp on the par value of $25.00, reset quarterly. The deadline for notifying the company of the intent to convert is 5:00 p.m. (Toronto time) on June 15, 2017; but note that this is a company deadline and that brokers will generally set their deadlines a day or two in advance, so there’s not much time to lose if you’re planning to convert! However, if you miss the brokerage deadline they’ll probably do it on a ‘best efforts’ basis if you grovel in a sufficiently entertaining fashion. The ticker for the new FloatingReset, if it is issued, will be BAM.PR.Y.
BAM.PR.X is a FixedReset, FixedReset, 4.60%+180, that commenced trading 2011-2-8 after being announced 2011-1-19. Thus, the new rate represents a dividend reduction of 41%. Ouch!
The most logical way to analyze the question of whether or not to convert is through the theory of Preferred Pairs, for which a calculator is available. Briefly, a Strong Pair is defined as a pair of securities that can be interconverted in the future (e.g., BAM.PR.X and the FloatingReset BAM.PR.Y that will exist if enough holders convert). Since they will be interconvertible on this future date, it may be assumed that they will be priced identically on this date (if they aren’t then holders will simply convert en masse to the higher-priced issue). And since they will be priced identically on a given date in the future, any current difference in price must be offset by expectations of an equal and opposite value of dividends to be received in the interim. And since the dividend rate on one element of the pair is both fixed and known, the implied average rate of the other, floating rate, instrument can be determined. Finally, we say, we may compare these average rates and take a view regarding the actual future course of that rate relative to the implied rate, which will provide us with guidance on which element of the pair is likely to outperform the other until the next interconversion date, at which time the process will be repeated.
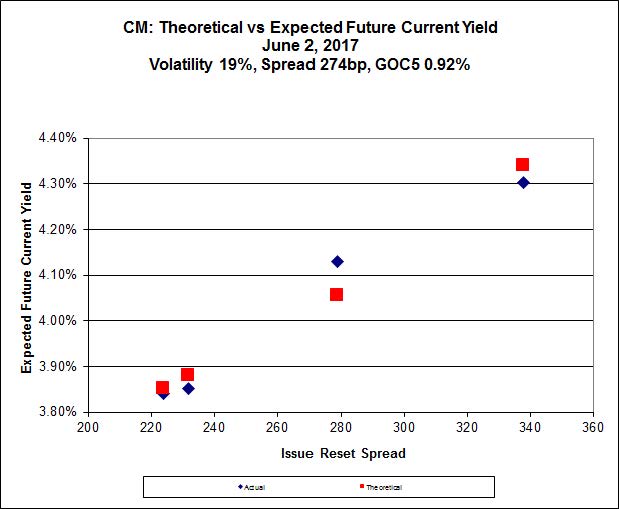
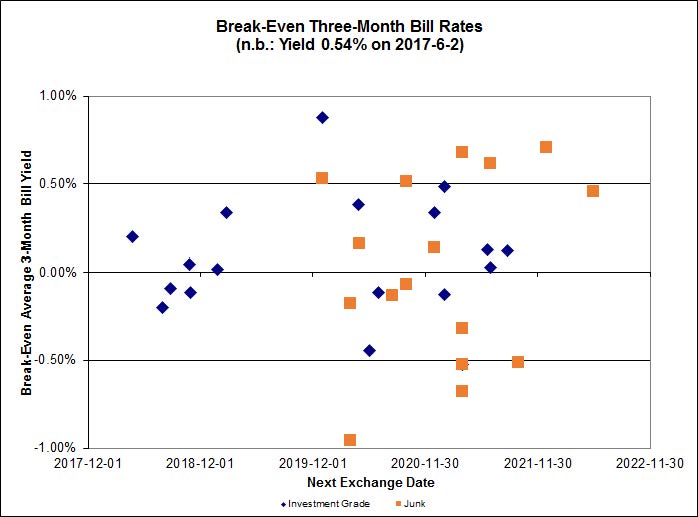
We can show the break-even rates for each FixedReset / FloatingReset Strong Pair graphically by plotting the implied average 3-month bill rate against the next Exchange Date (which is the date to which the average will be calculated).
Click for Big
The market appears to have a distaste at the moment for floating rate product; most of the implied rates until the next interconversion are lower than the current 3-month bill rate and the averages for investment-grade and junk issues are both well below current market rates, at -0.04% and -0.16%, respectively! Whatever might be the result of the next few Bank of Canada overnight rate decisions, I suggest that it is unlikely that the average rate over the next five years will be lower than current – but if you disagree, of course, you may interpret the data any way you like.
Since credit quality of each element of the pair is equal to the other element, it should not make any difference whether the pair examined is investment-grade or junk, although we might expect greater variation of implied rates between junk issues on grounds of lower liquidity, and this is just what we see.
If we plug in the current bid price of the BAM.PR.X FixedReset, we may construct the following table showing consistent prices for its soon-to-be-issued FloatingReset counterpart BAM.PR.Y given a variety of Implied Breakeven yields consistent with issues currently trading:
| Estimate of FloatingReset (received in exchange for BAM.PR.X) Trading Price In Current Conditions | |||||
| Assumed FloatingReset Price if Implied Bill is equal to |
|||||
| FixedReset | Bid Price | Spread | +0.50% | 0.00% | -0.50% |
| BAM.PR.X | 15.95 | 180bp | 15.51 | 14.99 | 14.47 |
Based on current market conditions, I suggest that the FloatingResets that will result from conversion are likely to be cheap and trading below the price of their FixedReset counterparts. Therefore, I recommend that holders of BAM.PR.X continue to hold the issue and not to convert. I will note that, given the apparent cheapness of the FloatingResets, it may be a good trade to swap the FixedReset for the FloatingReset in the market once both elements of each pair are trading and you can – presumably, according to this analysis – do it with a reasonably good take-out in price, rather than doing it through the company on a 1:1 basis. But that, of course, will depend on the prices at that time and your forecast for the path of policy rates over the next five years. There are no guarantees – my recommendation is based on the assumption that current market conditions with respect to the pairs will continue until the FloatingResets commence trading and that the relative pricing of the two new pairs will reflect these conditions.