Archive for December, 2017

New Issue: KML FixedReset, 5.20%+351M520

Wednesday, December 6th, 2017

Kinder Morgan Canada Limited has announced (although not yet on their website):

that it has entered into an agreement with a syndicate of underwriters led by CIBC Capital Markets, Scotiabank, RBC Capital Markets and TD Securities (together, the “Underwriters”) pursuant to which the Underwriters have agreed to purchase from the Company, 8,000,000 cumulative redeemable minimum rate reset preferred shares, Series 3 (the “Series 3 Preferred Shares”) at a price of $25.00 per share for distribution to the public.

The Company has granted to the Underwriters an option, exercisable at any time up to 48 hours prior to the closing of the offering, to purchase up to an additional 2,000,000 Series 3 Preferred Shares at a price of $25.00 per share.

The Company intends to use the proceeds from the offering to indirectly subscribe for preferred units in Kinder Morgan Canada Limited Partnership, which intends to subsequently use such proceeds to, directly or indirectly, finance the development, construction and completion of the Trans Mountain Expansion Project and Base Line Terminal project as well as potential future growth opportunities, to repay indebtedness and for general corporate purposes.

The holders of Series 3 Preferred Shares will be entitled to receive fixed cumulative dividends at an annual rate of $1.3000 per share, payable quarterly on the 15th day of February, May, August and November as and when declared by the Board of Directors of the Company, yielding 5.20 percent per annum at the issue price, for the initial fixed rate period to but excluding February 15, 2023 (the “Initial Fixed Rate Period”). The first quarterly dividend payment date is scheduled for February 15, 2018 and is anticipated to be in the amount of $0.22082 per share (assuming closing of the offering on December 15, 2017). The dividend rate will reset on February 15, 2023 and every five years thereafter at a rate equal to the sum of the then five-year Government of Canada bond yield plus 3.51 percent, provided that, in any event, such rate shall not be less than 5.20 percent per annum. The Series 3 Preferred Shares are redeemable by the Company, at its option, on February 15, 2023 and on February 15 of every fifth year thereafter at a price of $25.00 per share plus accrued and unpaid dividends.

The holders of Series 3 Preferred Shares will have the right to convert their shares into cumulative redeemable floating rate preferred shares, Series 4 (the “Series 4 Preferred Shares”), subject to certain conditions, on February 15, 2023 and on February 15 of every fifth year thereafter. The holders of Series 4 Preferred Shares will be entitled to receive quarterly floating rate cumulative dividends, as and when declared by the Board of Directors of the Company, at a rate equal to the sum of the then 90-day Government of Canada treasury bill rate plus 3.51 percent.

Closing of the offering is expected to occur on December 15, 2017, subject to customary closing conditions.

The offering is being made under a prospectus supplement to the base shelf prospectus of the Company dated July 28, 2017 (together, the “Prospectus”). Copies of the Prospectus may be obtained from Canadian Imperial Bank of Commerce, Commerce Court, Toronto, Ontario M5L 1A2, Telephone (416) 980-3096, The Bank of Nova Scotia, Scotia Plaza, 44 King Street West, Toronto, Ontario M5H 1H1, Telephone: (416) 866-3672, Royal Bank of Canada, 200 Bay Street, 4th Floor, North Tower, Toronto, Ontario, M5J 2W7, Telephone (416) 955-7803 and The Toronto-Dominion Bank, Toronto-Dominion Centre, Toronto, Ontario M5K 1A2, Telephone: (416) 308-6963. Investors should read the Prospectus, and the documents incorporated therein by reference, in their entirety, before making an investment decision.

The issue even made the Globe & Mail, presumably because of controversy about the Trans Mountain Pipeline:

Kinder Morgan Canada Ltd. is selling $200-million in shares even as the company dials back spending and warns of additional delays to its marquee Trans Mountain pipeline expansion.

The unit of Houston-based Kinder Morgan Inc. said Wednesday that it is selling eight million preferred units at $25 each in a bought deal to major banks, with proceeds earmarked to help finance the $7.4-billion pipeline expansion to Canada’s West Coast.

The offering comes despite warnings the 590,000-barrel-a-day expansion project could see oil shipments commence nine months later than originally planned. This week, the company said delays could extend beyond September, 2020, further driving up costs.

December 6, 2017

Wednesday, December 6th, 2017

The Bank of Canada stood pat today:

The Bank of Canada today maintained its target for the overnight rate at 1 per cent. The Bank Rate is correspondingly 1 1/4 per cent and the deposit rate is 3/4 per cent.

The global economy is evolving largely as expected in the Bank’s October Monetary Policy Report (MPR). In the United States, growth in the third quarter was stronger than forecast but is still expected to moderate in the months ahead. Growth has firmed in other advanced economies. Meanwhile, oil prices have moved higher and financial conditions have eased. The global outlook remains subject to considerable uncertainty, notably about geopolitical developments and trade policies.

Recent Canadian data are in line with October’s outlook, which was for growth to moderate while remaining above potential in the second half of 2017. Employment growth has been very strong and wages have shown some improvement, supporting robust consumer spending in the third quarter. Business investment continued to contribute to growth after a strong first half, and public infrastructure spending is becoming more evident in the data. Following exceptionally strong growth earlier in 2017, exports declined by more than was expected in the third quarter. However, the latest trade data support the MPR projection that export growth will resume as foreign demand strengthens. Housing has continued to moderate, as expected.

Inflation has been slightly higher than anticipated and will continue to be boosted in the short term by temporary factors, particularly gasoline prices. Measures of core inflation have edged up in recent months, reflecting the continued absorption of economic slack. Revisions to past quarterly national accounts have resulted in a higher level of GDP. However, this is unlikely to have significant implications for the output gap because the revisions also imply a higher level of potential output. Meanwhile, despite rising employment and participation rates, other indicators point to ongoing­ – albeit diminishing – slack in the labour market.

Based on the outlook for inflation and the evolution of the risks and uncertainties identified in October’s MPR, Governing Council judges that the current stance of monetary policy remains appropriate. While higher interest rates will likely be required over time, Governing Council will continue to be cautious, guided by incoming data in assessing the economy’s sensitivity to interest rates, the evolution of economic capacity, and the dynamics of both wage growth and inflation.

It seems that some players were expecting a hike:

The Canadian dollar reversed gains after the statement, weakening 0.7 percent to C$1.2777 per U.S. dollar at 11:10 a.m. in Toronto. Yields on Canadian government bonds fell across all maturities, with the rate on the country’s two-year bonds dropping four basis points to 1.5 percent.

Swaps trading suggests investors pushed back their expectations for the next rate increase, with the likelihood of a hike in the first quarter now at 60 percent from as high as 75 percent earlier this week.

Meanwhile, in the Canadian preferred share market:

nuclear-war-explosion-in-city-razvan-ionut-dragomirescu
Click for Big

PerpetualDiscounts now yield 5.30%, equivalent to 6.89% interest at the standard equivalency factor of 1.3x. Long corporates now yield about 3.75%, so the pre-tax interest-equivalent spread is now 315bp, a significant widening from the 305bp reported November 6.

HIMIPref™ Preferred Indices
These values reflect the December 2008 revision of the HIMIPref™ Indices

Values are provisional and are finalized monthly
Index Mean
Current
Yield
(at bid)
Median
YTW
Median
Average
Trading
Value
Median
Mod Dur
(YTW)
Issues Day’s Perf. Index Value
Ratchet 0.00 % 0.00 % 0 0.00 0 -0.3733 % 2,503.7
FixedFloater 0.00 % 0.00 % 0 0.00 0 -0.3733 % 4,594.1
Floater 3.65 % 3.84 % 33,207 17.68 4 -0.3733 % 2,647.6
OpRet 0.00 % 0.00 % 0 0.00 0 -0.1247 % 3,117.6
SplitShare 4.73 % 3.72 % 54,730 1.07 6 -0.1247 % 3,723.1
Interest-Bearing 0.00 % 0.00 % 0 0.00 0 -0.1247 % 2,904.9
Perpetual-Premium 5.37 % 4.73 % 55,435 0.24 20 -0.2160 % 2,832.6
Perpetual-Discount 5.24 % 5.30 % 73,312 14.91 14 -0.3885 % 2,989.9
FixedReset 4.30 % 4.44 % 143,914 6.13 98 -0.3555 % 2,461.5
Deemed-Retractible 5.07 % 5.32 % 89,841 5.95 30 -0.3673 % 2,932.8
FloatingReset 2.74 % 2.81 % 40,241 3.92 8 0.0925 % 2,681.7
Performance Highlights
Issue Index Change Notes
IFC.PR.C FixedReset -2.46 % YTW SCENARIO
Maturity Type : Hard Maturity
Maturity Date : 2025-01-31
Maturity Price : 25.00
Evaluated at bid price : 22.60
Bid-YTW : 5.57 %
IFC.PR.A FixedReset -1.48 % YTW SCENARIO
Maturity Type : Hard Maturity
Maturity Date : 2025-01-31
Maturity Price : 25.00
Evaluated at bid price : 19.35
Bid-YTW : 7.82 %
MFC.PR.C Deemed-Retractible -1.45 % YTW SCENARIO
Maturity Type : Hard Maturity
Maturity Date : 2025-01-31
Maturity Price : 25.00
Evaluated at bid price : 21.78
Bid-YTW : 6.82 %
MFC.PR.M FixedReset -1.42 % YTW SCENARIO
Maturity Type : Hard Maturity
Maturity Date : 2025-01-31
Maturity Price : 25.00
Evaluated at bid price : 22.86
Bid-YTW : 5.49 %
BAM.PF.E FixedReset -1.37 % YTW SCENARIO
Maturity Type : Limit Maturity
Maturity Date : 2047-12-06
Maturity Price : 22.55
Evaluated at bid price : 23.03
Bid-YTW : 4.70 %
CM.PR.O FixedReset -1.37 % YTW SCENARIO
Maturity Type : Limit Maturity
Maturity Date : 2047-12-06
Maturity Price : 22.68
Evaluated at bid price : 23.07
Bid-YTW : 4.38 %
MFC.PR.N FixedReset -1.36 % YTW SCENARIO
Maturity Type : Hard Maturity
Maturity Date : 2025-01-31
Maturity Price : 25.00
Evaluated at bid price : 22.52
Bid-YTW : 5.66 %
IAG.PR.A Deemed-Retractible -1.27 % YTW SCENARIO
Maturity Type : Hard Maturity
Maturity Date : 2025-01-31
Maturity Price : 25.00
Evaluated at bid price : 22.61
Bid-YTW : 6.26 %
MFC.PR.L FixedReset -1.25 % YTW SCENARIO
Maturity Type : Hard Maturity
Maturity Date : 2025-01-31
Maturity Price : 25.00
Evaluated at bid price : 22.05
Bid-YTW : 5.94 %
PWF.PR.L Perpetual-Discount -1.19 % YTW SCENARIO
Maturity Type : Limit Maturity
Maturity Date : 2047-12-06
Maturity Price : 23.92
Evaluated at bid price : 24.16
Bid-YTW : 5.33 %
CM.PR.P FixedReset -1.17 % YTW SCENARIO
Maturity Type : Limit Maturity
Maturity Date : 2047-12-06
Maturity Price : 22.44
Evaluated at bid price : 22.73
Bid-YTW : 4.35 %
CM.PR.Q FixedReset -1.16 % YTW SCENARIO
Maturity Type : Limit Maturity
Maturity Date : 2047-12-06
Maturity Price : 22.99
Evaluated at bid price : 23.92
Bid-YTW : 4.55 %
BMO.PR.S FixedReset -1.06 % YTW SCENARIO
Maturity Type : Limit Maturity
Maturity Date : 2047-12-06
Maturity Price : 22.82
Evaluated at bid price : 23.25
Bid-YTW : 4.35 %
BAM.PF.B FixedReset -1.06 % YTW SCENARIO
Maturity Type : Limit Maturity
Maturity Date : 2047-12-06
Maturity Price : 22.93
Evaluated at bid price : 23.40
Bid-YTW : 4.68 %
BAM.PR.C Floater -1.02 % YTW SCENARIO
Maturity Type : Limit Maturity
Maturity Date : 2047-12-06
Maturity Price : 14.61
Evaluated at bid price : 14.61
Bid-YTW : 3.88 %
MFC.PR.R FixedReset 3.83 % YTW SCENARIO
Maturity Type : Call
Maturity Date : 2022-03-19
Maturity Price : 25.00
Evaluated at bid price : 25.78
Bid-YTW : 4.03 %
Volume Highlights
Issue Index Shares
Traded
Notes
HSB.PR.C Deemed-Retractible 403,440 YTW SCENARIO
Maturity Type : Call
Maturity Date : 2018-01-05
Maturity Price : 25.00
Evaluated at bid price : 25.28
Bid-YTW : 2.90 %
SLF.PR.J FloatingReset 238,765 YTW SCENARIO
Maturity Type : Hard Maturity
Maturity Date : 2025-01-31
Maturity Price : 25.00
Evaluated at bid price : 17.60
Bid-YTW : 7.74 %
BNS.PR.R FixedReset 100,083 YTW SCENARIO
Maturity Type : Hard Maturity
Maturity Date : 2022-01-31
Maturity Price : 25.00
Evaluated at bid price : 25.13
Bid-YTW : 3.64 %
TD.PR.Y FixedReset 80,100 YTW SCENARIO
Maturity Type : Hard Maturity
Maturity Date : 2022-01-31
Maturity Price : 25.00
Evaluated at bid price : 24.93
Bid-YTW : 3.61 %
BNS.PR.G FixedReset 60,030 YTW SCENARIO
Maturity Type : Call
Maturity Date : 2021-07-25
Maturity Price : 25.00
Evaluated at bid price : 26.83
Bid-YTW : 3.54 %
RY.PR.Z FixedReset 48,500 YTW SCENARIO
Maturity Type : Limit Maturity
Maturity Date : 2047-12-06
Maturity Price : 22.49
Evaluated at bid price : 22.90
Bid-YTW : 4.30 %
There were 34 other index-included issues trading in excess of 10,000 shares.
Wide Spread Highlights
Issue Index Quote Data and Yield Notes
PWF.PR.A Floater Quote: 17.42 – 18.25
Spot Rate : 0.8300
Average : 0.5575

YTW SCENARIO
Maturity Type : Limit Maturity
Maturity Date : 2047-12-06
Maturity Price : 17.42
Evaluated at bid price : 17.42
Bid-YTW : 3.23 %

GWO.PR.Q Deemed-Retractible Quote: 24.40 – 24.74
Spot Rate : 0.3400
Average : 0.2128

YTW SCENARIO
Maturity Type : Hard Maturity
Maturity Date : 2025-01-31
Maturity Price : 25.00
Evaluated at bid price : 24.40
Bid-YTW : 5.54 %

BMO.PR.Y FixedReset Quote: 24.22 – 24.64
Spot Rate : 0.4200
Average : 0.3165

YTW SCENARIO
Maturity Type : Limit Maturity
Maturity Date : 2047-12-06
Maturity Price : 23.12
Evaluated at bid price : 24.22
Bid-YTW : 4.44 %

PWF.PR.F Perpetual-Discount Quote: 24.65 – 25.00
Spot Rate : 0.3500
Average : 0.2534

YTW SCENARIO
Maturity Type : Limit Maturity
Maturity Date : 2047-12-06
Maturity Price : 24.34
Evaluated at bid price : 24.65
Bid-YTW : 5.38 %

VNR.PR.A FixedReset Quote: 24.27 – 24.64
Spot Rate : 0.3700
Average : 0.2780

YTW SCENARIO
Maturity Type : Limit Maturity
Maturity Date : 2047-12-06
Maturity Price : 22.90
Evaluated at bid price : 24.27
Bid-YTW : 4.67 %

PWF.PR.T FixedReset Quote: 24.00 – 24.34
Spot Rate : 0.3400
Average : 0.2496

YTW SCENARIO
Maturity Type : Limit Maturity
Maturity Date : 2047-12-06
Maturity Price : 23.50
Evaluated at bid price : 24.00
Bid-YTW : 4.28 %

December 5, 2017

Tuesday, December 5th, 2017

Why are we so dependent on foreign brains and foreign capital for technological applications?

One of China’s biggest online companies wants to deploy a fleet of drones in Canada to airlift seafood from East Coast processing plants to the airport, cutting out land-haul costs in its bid to deliver more Atlantic lobsters, prawns and clams to Chinese consumers.

JD.com is also developing plans for a drone network for the Canadian West Coast that could be used to carry local blueberries to cargo aircraft headed for China. It wants to replicate plans for similar drone networks in China, where it believes unmanned aircraft can slash logistics costs by 50 to 70 per cent, CEO Richard Liu said in an interview Tuesday.

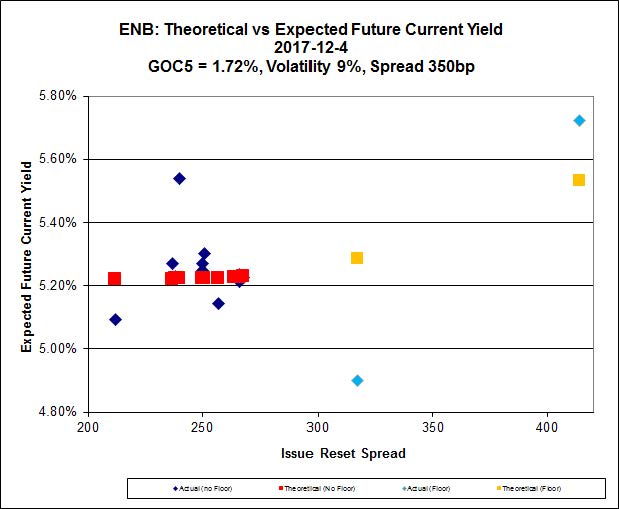
Meanwhile, in the Canadian preferred share market …

explosion_171205
Click for Big

Today’s meltdown is a mystery to me, but in the tradition of market commentators everywhere, I’ll just nod wisely and suggest tax-loss selling. Have to suggest something!

HIMIPref™ Preferred Indices
These values reflect the December 2008 revision of the HIMIPref™ Indices

Values are provisional and are finalized monthly
Index Mean
Current
Yield
(at bid)
Median
YTW
Median
Average
Trading
Value
Median
Mod Dur
(YTW)
Issues Day’s Perf. Index Value
Ratchet 0.00 % 0.00 % 0 0.00 0 -0.7251 % 2,513.0
FixedFloater 0.00 % 0.00 % 0 0.00 0 -0.7251 % 4,611.3
Floater 3.64 % 3.84 % 33,634 17.69 4 -0.7251 % 2,657.5
OpRet 0.00 % 0.00 % 0 0.00 0 -0.0197 % 3,121.5
SplitShare 4.73 % 3.71 % 55,336 1.07 6 -0.0197 % 3,727.7
Interest-Bearing 0.00 % 0.00 % 0 0.00 0 -0.0197 % 2,908.5
Perpetual-Premium 5.36 % 4.65 % 54,925 0.16 20 -0.0334 % 2,838.7
Perpetual-Discount 5.22 % 5.27 % 73,307 15.00 14 -0.3961 % 3,001.6
FixedReset 4.28 % 4.43 % 142,468 6.11 98 -0.7264 % 2,470.3
Deemed-Retractible 5.05 % 5.28 % 90,434 5.95 30 -0.2594 % 2,943.6
FloatingReset 2.74 % 2.76 % 39,780 3.92 8 -0.2442 % 2,679.2
Performance Highlights
Issue Index Change Notes
MFC.PR.R FixedReset -4.32 % YTW SCENARIO
Maturity Type : Call
Maturity Date : 2022-03-19
Maturity Price : 25.00
Evaluated at bid price : 24.83
Bid-YTW : 5.01 %
PWF.PR.P FixedReset -2.95 % YTW SCENARIO
Maturity Type : Limit Maturity
Maturity Date : 2047-12-05
Maturity Price : 17.43
Evaluated at bid price : 17.43
Bid-YTW : 4.56 %
BAM.PF.G FixedReset -2.15 % YTW SCENARIO
Maturity Type : Limit Maturity
Maturity Date : 2047-12-05
Maturity Price : 23.08
Evaluated at bid price : 24.08
Bid-YTW : 4.74 %
IFC.PR.A FixedReset -2.14 % YTW SCENARIO
Maturity Type : Hard Maturity
Maturity Date : 2025-01-31
Maturity Price : 25.00
Evaluated at bid price : 19.64
Bid-YTW : 7.56 %
BAM.PF.F FixedReset -2.02 % YTW SCENARIO
Maturity Type : Limit Maturity
Maturity Date : 2047-12-05
Maturity Price : 23.88
Evaluated at bid price : 24.21
Bid-YTW : 4.78 %
IAG.PR.G FixedReset -1.89 % YTW SCENARIO
Maturity Type : Hard Maturity
Maturity Date : 2025-01-31
Maturity Price : 25.00
Evaluated at bid price : 23.40
Bid-YTW : 5.11 %
TRP.PR.F FloatingReset -1.79 % YTW SCENARIO
Maturity Type : Limit Maturity
Maturity Date : 2047-12-05
Maturity Price : 19.25
Evaluated at bid price : 19.25
Bid-YTW : 3.64 %
BAM.PF.A FixedReset -1.70 % YTW SCENARIO
Maturity Type : Limit Maturity
Maturity Date : 2047-12-05
Maturity Price : 23.73
Evaluated at bid price : 24.30
Bid-YTW : 4.79 %
BAM.PF.E FixedReset -1.68 % YTW SCENARIO
Maturity Type : Limit Maturity
Maturity Date : 2047-12-05
Maturity Price : 22.74
Evaluated at bid price : 23.35
Bid-YTW : 4.63 %
MFC.PR.H FixedReset -1.68 % YTW SCENARIO
Maturity Type : Hard Maturity
Maturity Date : 2025-01-31
Maturity Price : 25.00
Evaluated at bid price : 24.60
Bid-YTW : 5.12 %
SLF.PR.G FixedReset -1.62 % YTW SCENARIO
Maturity Type : Hard Maturity
Maturity Date : 2025-01-31
Maturity Price : 25.00
Evaluated at bid price : 18.25
Bid-YTW : 7.78 %
MFC.PR.F FixedReset -1.61 % YTW SCENARIO
Maturity Type : Hard Maturity
Maturity Date : 2025-01-31
Maturity Price : 25.00
Evaluated at bid price : 17.77
Bid-YTW : 8.01 %
W.PR.M FixedReset -1.52 % YTW SCENARIO
Maturity Type : Call
Maturity Date : 2021-10-15
Maturity Price : 25.00
Evaluated at bid price : 25.90
Bid-YTW : 4.41 %
NA.PR.W FixedReset -1.42 % YTW SCENARIO
Maturity Type : Limit Maturity
Maturity Date : 2047-12-05
Maturity Price : 21.75
Evaluated at bid price : 22.23
Bid-YTW : 4.46 %
IFC.PR.C FixedReset -1.40 % YTW SCENARIO
Maturity Type : Hard Maturity
Maturity Date : 2025-01-31
Maturity Price : 25.00
Evaluated at bid price : 23.17
Bid-YTW : 5.16 %
TD.PF.C FixedReset -1.39 % YTW SCENARIO
Maturity Type : Limit Maturity
Maturity Date : 2047-12-05
Maturity Price : 22.46
Evaluated at bid price : 22.75
Bid-YTW : 4.36 %
BAM.PR.K Floater -1.35 % YTW SCENARIO
Maturity Type : Limit Maturity
Maturity Date : 2047-12-05
Maturity Price : 14.65
Evaluated at bid price : 14.65
Bid-YTW : 3.87 %
CM.PR.O FixedReset -1.31 % YTW SCENARIO
Maturity Type : Limit Maturity
Maturity Date : 2047-12-05
Maturity Price : 22.99
Evaluated at bid price : 23.39
Bid-YTW : 4.32 %
BAM.PF.B FixedReset -1.29 % YTW SCENARIO
Maturity Type : Limit Maturity
Maturity Date : 2047-12-05
Maturity Price : 23.18
Evaluated at bid price : 23.65
Bid-YTW : 4.63 %
CM.PR.P FixedReset -1.29 % YTW SCENARIO
Maturity Type : Limit Maturity
Maturity Date : 2047-12-05
Maturity Price : 22.69
Evaluated at bid price : 23.00
Bid-YTW : 4.30 %
TD.PF.A FixedReset -1.28 % YTW SCENARIO
Maturity Type : Limit Maturity
Maturity Date : 2047-12-05
Maturity Price : 22.80
Evaluated at bid price : 23.15
Bid-YTW : 4.29 %
TRP.PR.C FixedReset -1.28 % YTW SCENARIO
Maturity Type : Limit Maturity
Maturity Date : 2047-12-05
Maturity Price : 17.01
Evaluated at bid price : 17.01
Bid-YTW : 4.59 %
NA.PR.C FixedReset -1.25 % YTW SCENARIO
Maturity Type : Call
Maturity Date : 2022-11-15
Maturity Price : 25.00
Evaluated at bid price : 25.30
Bid-YTW : 4.26 %
MFC.PR.K FixedReset -1.24 % YTW SCENARIO
Maturity Type : Hard Maturity
Maturity Date : 2025-01-31
Maturity Price : 25.00
Evaluated at bid price : 22.27
Bid-YTW : 5.82 %
MFC.PR.G FixedReset -1.22 % YTW SCENARIO
Maturity Type : Hard Maturity
Maturity Date : 2025-01-31
Maturity Price : 25.00
Evaluated at bid price : 24.25
Bid-YTW : 4.69 %
BAM.PR.R FixedReset -1.18 % YTW SCENARIO
Maturity Type : Limit Maturity
Maturity Date : 2047-12-05
Maturity Price : 20.06
Evaluated at bid price : 20.06
Bid-YTW : 4.84 %
TD.PF.B FixedReset -1.16 % YTW SCENARIO
Maturity Type : Limit Maturity
Maturity Date : 2047-12-05
Maturity Price : 22.64
Evaluated at bid price : 23.03
Bid-YTW : 4.33 %
CU.PR.E Perpetual-Discount -1.11 % YTW SCENARIO
Maturity Type : Limit Maturity
Maturity Date : 2047-12-05
Maturity Price : 23.68
Evaluated at bid price : 24.13
Bid-YTW : 5.09 %
BAM.PR.Z FixedReset -1.10 % YTW SCENARIO
Maturity Type : Limit Maturity
Maturity Date : 2047-12-05
Maturity Price : 23.09
Evaluated at bid price : 24.20
Bid-YTW : 4.85 %
TRP.PR.A FixedReset -1.09 % YTW SCENARIO
Maturity Type : Limit Maturity
Maturity Date : 2047-12-05
Maturity Price : 19.89
Evaluated at bid price : 19.89
Bid-YTW : 4.53 %
TRP.PR.E FixedReset -1.08 % YTW SCENARIO
Maturity Type : Limit Maturity
Maturity Date : 2047-12-05
Maturity Price : 22.51
Evaluated at bid price : 22.85
Bid-YTW : 4.50 %
NA.PR.S FixedReset -1.07 % YTW SCENARIO
Maturity Type : Limit Maturity
Maturity Date : 2047-12-05
Maturity Price : 22.67
Evaluated at bid price : 23.10
Bid-YTW : 4.47 %
SLF.PR.H FixedReset -1.05 % YTW SCENARIO
Maturity Type : Hard Maturity
Maturity Date : 2025-01-31
Maturity Price : 25.00
Evaluated at bid price : 21.62
Bid-YTW : 5.61 %
HSE.PR.E FixedReset -1.05 % YTW SCENARIO
Maturity Type : Call
Maturity Date : 2020-03-31
Maturity Price : 25.00
Evaluated at bid price : 24.56
Bid-YTW : 5.20 %
MFC.PR.I FixedReset -1.01 % YTW SCENARIO
Maturity Type : Hard Maturity
Maturity Date : 2025-01-31
Maturity Price : 25.00
Evaluated at bid price : 24.47
Bid-YTW : 4.78 %
Volume Highlights
Issue Index Shares
Traded
Notes
TD.PR.Y FixedReset 122,834 YTW SCENARIO
Maturity Type : Hard Maturity
Maturity Date : 2022-01-31
Maturity Price : 25.00
Evaluated at bid price : 24.92
Bid-YTW : 3.62 %
NA.PR.W FixedReset 87,803 YTW SCENARIO
Maturity Type : Limit Maturity
Maturity Date : 2047-12-05
Maturity Price : 21.75
Evaluated at bid price : 22.23
Bid-YTW : 4.46 %
TD.PF.G FixedReset 72,547 YTW SCENARIO
Maturity Type : Call
Maturity Date : 2021-04-30
Maturity Price : 25.00
Evaluated at bid price : 26.69
Bid-YTW : 3.55 %
BMO.PR.S FixedReset 67,338 YTW SCENARIO
Maturity Type : Limit Maturity
Maturity Date : 2047-12-05
Maturity Price : 23.06
Evaluated at bid price : 23.50
Bid-YTW : 4.30 %
TRP.PR.K FixedReset 43,216 YTW SCENARIO
Maturity Type : Call
Maturity Date : 2022-05-31
Maturity Price : 25.00
Evaluated at bid price : 26.04
Bid-YTW : 3.92 %
CM.PR.R FixedReset 36,811 YTW SCENARIO
Maturity Type : Call
Maturity Date : 2022-07-31
Maturity Price : 25.00
Evaluated at bid price : 25.45
Bid-YTW : 4.10 %
There were 40 other index-included issues trading in excess of 10,000 shares.
Wide Spread Highlights
Issue Index Quote Data and Yield Notes
MFC.PR.R FixedReset Quote: 24.83 – 26.01
Spot Rate : 1.1800
Average : 0.6647

YTW SCENARIO
Maturity Type : Call
Maturity Date : 2022-03-19
Maturity Price : 25.00
Evaluated at bid price : 24.83
Bid-YTW : 5.01 %

BAM.PF.G FixedReset Quote: 24.08 – 24.60
Spot Rate : 0.5200
Average : 0.3301

YTW SCENARIO
Maturity Type : Limit Maturity
Maturity Date : 2047-12-05
Maturity Price : 23.08
Evaluated at bid price : 24.08
Bid-YTW : 4.74 %

CU.PR.E Perpetual-Discount Quote: 24.13 – 24.52
Spot Rate : 0.3900
Average : 0.2544

YTW SCENARIO
Maturity Type : Limit Maturity
Maturity Date : 2047-12-05
Maturity Price : 23.68
Evaluated at bid price : 24.13
Bid-YTW : 5.09 %

CU.PR.F Perpetual-Discount Quote: 22.05 – 22.49
Spot Rate : 0.4400
Average : 0.3103

YTW SCENARIO
Maturity Type : Limit Maturity
Maturity Date : 2047-12-05
Maturity Price : 21.70
Evaluated at bid price : 22.05
Bid-YTW : 5.12 %

IFC.PR.C FixedReset Quote: 23.17 – 23.65
Spot Rate : 0.4800
Average : 0.3506

YTW SCENARIO
Maturity Type : Hard Maturity
Maturity Date : 2025-01-31
Maturity Price : 25.00
Evaluated at bid price : 23.17
Bid-YTW : 5.16 %

MFC.PR.F FixedReset Quote: 17.77 – 18.18
Spot Rate : 0.4100
Average : 0.2928

YTW SCENARIO
Maturity Type : Hard Maturity
Maturity Date : 2025-01-31
Maturity Price : 25.00
Evaluated at bid price : 17.77
Bid-YTW : 8.01 %

Assessing the value of the minimum reset yield

Tuesday, December 5th, 2017

Barry Critchley was kind enough to mention me in his piece Assessing the value of the minimum reset yield:

The minimum rate reset feature has some value for the investor and could become real value in five years if the five-year Canada bond rate is below the current five-year rate. The question is whether investors are being rewarded now.

James Hymas, portfolio manager of the Malachite Aggressive Preferred Fund and publisher of the PrefBlog thinks they’re not. “I think it’s overly reflective in the price, but given the current yield on five-year Canada bonds (around 1.70 per cent) the current value is minimal.”

Hymas said the minimum reset has value if in five years, the five-year Canada rate is below 1.70 per cent, a level that’s “significantly below the target inflation rate,” of two per cent set by the Bank of Canada, and not far from the record low five-year rate.

In Hymas’s view, a coupon that starts with a five is required. In the meantime, he says that better value lies in the secondary market.

New Issue: ENB FixedReset 4.90%+317M490

Monday, December 4th, 2017

Enbridge Inc. has announced:

that it has entered into an agreement with a group of underwriters to sell $400 million Cumulative Redeemable Minimum Rate Reset Preference Shares, Series 19 (the “Series 19 Preferred Shares”) at a price of $25.00 per share for distribution to the public. Closing of the offering is expected on or about December 11, 2017.

The holders of Series 19 Preferred Shares will be entitled to receive fixed cumulative dividends at an annual rate of $1.225 per share, payable quarterly on the first day of March, June, September and December, as and when declared by the Board of Directors of Enbridge. The Series 19 Preferred Shares are expected to yield 4.90 percent per annum for the initial fixed rate period to, but excluding, March 1, 2023. The first quarterly dividend payment date is scheduled for March 1, 2018. The dividend rate will reset on March 1, 2023 and every five years thereafter at a rate equal to the sum of the then five-year Canadian Government bond yield plus 3.17 percent, provided that, in any event, such rate shall not be less than 4.90 percent per annum. The Series 19 Preferred Shares are redeemable by Enbridge, at its option, on March 1, 2023 and on March 1 of every fifth year thereafter.

The holders of Series 19 Preferred Shares will have the right to convert their shares into Cumulative Redeemable Preference Shares, Series 20 (the “Series 20 Preferred Shares”) on March 1, 2023 and on March 1 of every fifth year thereafter, subject to certain conditions. The holders of Series 20 Preferred Shares will be entitled to receive quarterly floating rate cumulative dividends, as and when declared by the Board of Directors of Enbridge, at a rate equal to the sum of the 90-day Government of Canada Treasury bill rate plus 3.17 percent.

Enbridge has granted to the underwriters an option to purchase up to an additional four million Series 19 Preferred Shares at a price of $25.00 per share, exercisable at any time up to 48 hours prior to the closing of the offering.

The offering is being made only in Canada by means of a prospectus supplement to the base shelf prospectus of the Company dated September 14, 2017. Proceeds are expected to be used to partially fund capital projects, to reduce existing indebtedness and for other general corporate purposes of the Company and its affiliates.

The syndicate of underwriters is led by Scotiabank, BMO Capital Markets, CIBC Capital Markets, and National Bank Financial.

This issue looks extraordinarily expensive to me! According to Implied Volatility analysis:

impvol_enb_171204
Click for Big

With the parameters shown, the theoretical value of the new issue is 23.17, roughly equivalent to the BPO new issue. Critics will be quick to point out that in this calculation there is zero value assigned to the minimum rate guarantee … but I’d say that’s about right!

December 4, 2017

Monday, December 4th, 2017
HIMIPref™ Preferred Indices
These values reflect the December 2008 revision of the HIMIPref™ Indices

Values are provisional and are finalized monthly
Index Mean
Current
Yield
(at bid)
Median
YTW
Median
Average
Trading
Value
Median
Mod Dur
(YTW)
Issues Day’s Perf. Index Value
Ratchet 0.00 % 0.00 % 0 0.00 0 0.6161 % 2,531.4
FixedFloater 0.00 % 0.00 % 0 0.00 0 0.6161 % 4,645.0
Floater 3.61 % 3.81 % 33,989 17.74 4 0.6161 % 2,676.9
OpRet 0.00 % 0.00 % 0 0.00 0 -0.0525 % 3,122.1
SplitShare 4.73 % 3.70 % 54,425 1.07 6 -0.0525 % 3,728.5
Interest-Bearing 0.00 % 0.00 % 0 0.00 0 -0.0525 % 2,909.1
Perpetual-Premium 5.36 % 4.73 % 55,000 2.18 20 -0.0490 % 2,839.7
Perpetual-Discount 5.20 % 5.25 % 73,649 15.01 14 -0.4579 % 3,013.5
FixedReset 4.25 % 4.36 % 143,622 4.52 98 -0.1070 % 2,488.3
Deemed-Retractible 5.04 % 5.23 % 89,163 5.96 30 -0.1535 % 2,951.3
FloatingReset 2.73 % 2.74 % 40,499 3.93 8 0.1685 % 2,685.7
Performance Highlights
Issue Index Change Notes
W.PR.K FixedReset -1.90 % YTW SCENARIO
Maturity Type : Call
Maturity Date : 2021-01-15
Maturity Price : 25.00
Evaluated at bid price : 25.75
Bid-YTW : 4.48 %
RY.PR.M FixedReset -1.56 % YTW SCENARIO
Maturity Type : Limit Maturity
Maturity Date : 2047-12-04
Maturity Price : 22.94
Evaluated at bid price : 23.92
Bid-YTW : 4.38 %
POW.PR.D Perpetual-Discount -1.43 % YTW SCENARIO
Maturity Type : Limit Maturity
Maturity Date : 2047-12-04
Maturity Price : 23.95
Evaluated at bid price : 24.20
Bid-YTW : 5.23 %
CU.PR.F Perpetual-Discount -1.12 % YTW SCENARIO
Maturity Type : Limit Maturity
Maturity Date : 2047-12-04
Maturity Price : 21.70
Evaluated at bid price : 22.05
Bid-YTW : 5.12 %
PWF.PR.A Floater 1.50 % YTW SCENARIO
Maturity Type : Limit Maturity
Maturity Date : 2047-12-04
Maturity Price : 17.56
Evaluated at bid price : 17.56
Bid-YTW : 3.21 %
Volume Highlights
Issue Index Shares
Traded
Notes
BNS.PR.H FixedReset 108,262 YTW SCENARIO
Maturity Type : Call
Maturity Date : 2022-01-26
Maturity Price : 25.00
Evaluated at bid price : 26.18
Bid-YTW : 3.76 %
HSB.PR.C Deemed-Retractible 94,632 YTW SCENARIO
Maturity Type : Call
Maturity Date : 2018-01-03
Maturity Price : 25.00
Evaluated at bid price : 25.27
Bid-YTW : 3.04 %
BMO.PR.S FixedReset 45,630 YTW SCENARIO
Maturity Type : Limit Maturity
Maturity Date : 2047-12-04
Maturity Price : 23.29
Evaluated at bid price : 23.72
Bid-YTW : 4.26 %
PWF.PR.Z Perpetual-Discount 42,860 YTW SCENARIO
Maturity Type : Limit Maturity
Maturity Date : 2047-12-04
Maturity Price : 24.36
Evaluated at bid price : 24.75
Bid-YTW : 5.25 %
BAM.PF.J FixedReset 42,289 YTW SCENARIO
Maturity Type : Call
Maturity Date : 2022-12-31
Maturity Price : 25.00
Evaluated at bid price : 25.80
Bid-YTW : 3.99 %
HSB.PR.D Deemed-Retractible 40,200 YTW SCENARIO
Maturity Type : Call
Maturity Date : 2018-01-03
Maturity Price : 25.00
Evaluated at bid price : 25.26
Bid-YTW : 3.21 %
There were 31 other index-included issues trading in excess of 10,000 shares.
Wide Spread Highlights
Issue Index Quote Data and Yield Notes
W.PR.K FixedReset Quote: 25.75 – 26.24
Spot Rate : 0.4900
Average : 0.3532

YTW SCENARIO
Maturity Type : Call
Maturity Date : 2021-01-15
Maturity Price : 25.00
Evaluated at bid price : 25.75
Bid-YTW : 4.48 %

IFC.PR.A FixedReset Quote: 20.07 – 20.48
Spot Rate : 0.4100
Average : 0.2779

YTW SCENARIO
Maturity Type : Hard Maturity
Maturity Date : 2025-01-31
Maturity Price : 25.00
Evaluated at bid price : 20.07
Bid-YTW : 7.20 %

BIP.PR.A FixedReset Quote: 24.16 – 24.50
Spot Rate : 0.3400
Average : 0.2264

YTW SCENARIO
Maturity Type : Limit Maturity
Maturity Date : 2047-12-04
Maturity Price : 23.12
Evaluated at bid price : 24.16
Bid-YTW : 5.30 %

POW.PR.D Perpetual-Discount Quote: 24.20 – 24.54
Spot Rate : 0.3400
Average : 0.2274

YTW SCENARIO
Maturity Type : Limit Maturity
Maturity Date : 2047-12-04
Maturity Price : 23.95
Evaluated at bid price : 24.20
Bid-YTW : 5.23 %

CU.PR.I FixedReset Quote: 25.55 – 26.00
Spot Rate : 0.4500
Average : 0.3450

YTW SCENARIO
Maturity Type : Call
Maturity Date : 2020-12-01
Maturity Price : 25.00
Evaluated at bid price : 25.55
Bid-YTW : 3.75 %

PWF.PR.H Perpetual-Premium Quote: 25.72 – 25.98
Spot Rate : 0.2600
Average : 0.1764

YTW SCENARIO
Maturity Type : Call
Maturity Date : 2018-01-03
Maturity Price : 25.00
Evaluated at bid price : 25.72
Bid-YTW : -21.16 %

BAM.PR.Z To Reset At 4.685%

Monday, December 4th, 2017

Brookfield Asset Management Inc. has announced:

that it has determined the fixed dividend rate on its Cumulative Class A Preference Shares, Series 30 (“Series 30 Shares”) (TSX:BAM.PR.Z) for the five years commencing January 1, 2018 and ending December 31, 2022, and also determined the quarterly dividend on its floating rate Cumulative Class A Preference Shares, Series 25 (“Series 25 Shares”) (TSX:BAM.PR.S).

Series 30 Shares and Series 31 Shares

If declared, the fixed quarterly dividends on the Series 30 Shares during the five years commencing January 1, 2018 will be $0.2928125 per share per quarter, which represents a yield of 4.781% on the most recent trading price, similar to the current yield. The new fixed dividend rate that will apply for the five years commencing January 1, 2018 represents a yield of 4.685% based on the redemption price of $25 per share.

Holders of Series 30 Shares have the right, at their option, exercisable not later than 5:00 p.m. (Toronto time) on December 18, 2017, to convert all or part of their Series 30 Shares, on a one-for-one basis, into Cumulative Class A Preference Shares, Series 31 (the “Series 31 Shares”), effective December 31, 2017.

The quarterly floating rate dividends on the Series 31 Shares will be paid at an annual rate, calculated for each quarter, of 2.96% over the annual yield on three-month Government of Canada treasury bills. The actual quarterly dividend rate in respect of the January 1, 2018 to March 31, 2018 dividend period for the Series 31 Shares will be 0.94488% (3.832% on an annualized basis) and the dividend, if declared, for such dividend period will be $0.23622 per share, payable on March 29, 2018.

Holders of Series 30 Shares are not required to elect to convert all or any part of their Series 31 Shares into Series 31 Shares.

As provided in the share conditions of the Series 30 Shares, (i) if Brookfield determines that there would be fewer than 1,000,000 Series 30 Shares outstanding after December 31, 2017, all remaining Series 30 Shares will be automatically converted into Series 31 Shares on a one-for-one basis effective December 31, 2017; and (ii) if Brookfield determines that there would be fewer than 1,000,000 Series 31 Shares outstanding after December 31, 2017, no Series 30 Shares will be permitted to be converted into Series 31 Shares. There are currently 9,934,050 Series 30 Shares outstanding.

The Toronto Stock Exchange (“TSX”) has conditionally approved the listing of the Series 31 Shares effective upon conversion. Listing of the Series 31 Shares is subject to Brookfield fulfilling all the listing requirements of the TSX and, upon approval, the Series 31 Shares will be listed on the TSX under the trading symbol “BAM.PF.K”.

BAM.PR.Z is a FixedReset, 4.80%+296, that commenced trading 2011-11-2 after being announced 2011-10-24. It is tracked by HIMIPref™ and assigned to the FixedReset subindex.

The most logical way to analyze the question of whether or not to convert is through the theory of Preferred Pairs, for which a calculator is available. Briefly, a Strong Pair is defined as a pair of securities that can be interconverted in the future (e.g., BAM.PR.Z and the FloatingReset BAM.PF.K that will exist if enough holders convert). Since they will be interconvertible on this future date, it may be assumed that they will be priced identically on this date (if they aren’t then holders will simply convert en masse to the higher-priced issue). And since they will be priced identically on a given date in the future, any current difference in price must be offset by expectations of an equal and opposite value of dividends to be received in the interim. And since the dividend rate on one element of the pair is both fixed and known, the implied average rate of the other, floating rate, instrument can be determined. Finally, we say, we may compare these average rates and take a view regarding the actual future course of that rate relative to the implied rate, which will provide us with guidance on which element of the pair is likely to outperform the other until the next interconversion date, at which time the process will be repeated.

We can show the break-even rates for each FixedReset / FloatingReset Strong Pair graphically by plotting the implied average 3-month bill rate against the next Exchange Date (which is the date to which the average will be calculated).

pairs_fr_171204
Click for Big

The market appears to have a distaste at the moment for floating rate product; most of the implied rates until the next interconversion are lower than the current 3-month bill rate and the averages for investment-grade and junk issues are both well below current market rates, at +0.42% and +0.53%, respectively! Whatever might be the result of the next few Bank of Canada overnight rate decisions, I suggest that it is unlikely that the average rate over the next five years will be lower than current – but if you disagree, of course, you may interpret the data any way you like.

Since credit quality of each element of the pair is equal to the other element, it should not make any difference whether the pair examined is investment-grade or junk, although we might expect greater variation of implied rates between junk issues on grounds of lower liquidity, and this is just what we see.

If we plug in the current bid price of the BAM.PR.Z FixedReset, we may construct the following table showing consistent prices for its soon-may-be-issued FloatingReset BAM.PF.K counterpart given a variety of Implied Breakeven yields consistent with issues currently trading:

Estimate of FloatingReset BAM.PF.K (received in exchange for BAM.PR.Z) Trading Price In Current Conditions
  Assumed FloatingReset
Price if Implied Bill
is equal to
FixedReset Bid Price Spread 1.00% 0.50% 0.00%
BAM.PR.Z 24.47 296bp 23.73 23.22 22.71

Based on current market conditions, I suggest that the FloatingResets that will result from conversion are likely to be cheap and trading below the price of their FixedReset counterparts. Therefore, it seems likely that I will recommend that holders of BAM.PR.Z continue to hold the issue and not to convert, but I will wait until it’s closer to the December 18 notification deadline before making a final pronouncement. I will note that, given the apparent cheapness of the FloatingResets, it may be a good trade to swap the FixedReset for the FloatingReset in the market once both elements of each pair are trading and you can – presumably, according to this analysis – do it with a reasonably good take-out in price, rather than doing it through the company on a 1:1 basis. But that, of course, will depend on the prices at that time and your forecast for the path of policy rates over the next five years. There are no guarantees – my recommendation is based on the assumption that current market conditions with respect to the pairs will continue until the FloatingResets commence trading and that the relative pricing of the two new pairs will reflect these conditions.

MAPF Performance: November, 2017

Saturday, December 2nd, 2017

Malachite Aggressive Preferred Fund’s Net Asset Value per Unit as of the close November 30, 2017, was $10.1466.

Returns to November 30, 2017
Period MAPF BMO-CM “50” Preferred Share Index TXPR*
Total Return
CPD – according to Blackrock
One Month +0.97% +0.76% +0.70% N/A
Three Months +5.50% +5.23% +4.08% N/A
One Year +28.52% +21.85% +17.64% +17.30%
Two Years (annualized) +17.44% +14.07% +11.48% N/A
Three Years (annualized) +3.22% +2.51% +0.99% +0.64%
Four Years (annualized) +5.02% +2.83% +2.11% N/A
Five Years (annualized) +3.68% +2.53% +1.64% +1.26%
Six Years (annualized) +5.10% +3.11% +2.35% N/A
Seven Years (annualized) +4.44% +3.55% +2.63% N/A
Eight Years (annualized) +6.11% +4.61% +3.51% N/A
Nine Years (annualized) +13.31% +7.62% +6.48% N/A
Ten Years (annualized) +10.21% +4.35% +3.28% +2.75%
Eleven Years (annualized) +8.73% +3.31%    
Twelve Years (annualized) +8.56% +3.40%    
Thirteen Years (annualized) +8.39% +3.50%    
Fourteen Years (annualized) +8.84% +3.68%    
Fifteen Years (annualized) +10.17% +3.95%    
Sixteen Years (annualized) +9.40% +3.86%    
MAPF returns assume reinvestment of distributions, and are shown after expenses but before fees.
The full name of the BMO-CM “50” index is the BMO Capital Markets “50” Preferred Share Index. It is calculated without accounting for fees.
“TXPR” is the S&P/TSX Preferred Share Index. It is calculated without accounting for fees.
CPD Returns are for the NAV and are after all fees and expenses.
Figures for National Bank Preferred Equity Income Fund (formerly Omega Preferred Equity) (which are after all fees and expenses) for 1-, 3- and 12-months are +0.71%, +3.60% and +15.88%, respectively, according to Morningstar after all fees & expenses. Three year performance is +2.01%; five year is +2.50%; ten year is +3.81%
Figures for Manulife Preferred Income Class Adv [into which was merged Manulife Preferred Income Fund (formerly AIC Preferred Income Fund)] (which are after all fees and expenses) for 1-, 3- and 12-months are +0.72%, +4.62% & +20.31%, respectively. Three year performance is +1.90%.

It will be noted that AIC Preferred Income Fund was in existence prior to August, 2009, but long term performance figures have been suppressed.

Figures for Horizons Active Preferred Share ETF (HPR) (which are after all fees and expenses) for 1-, 3- and 12-months are +0.75%, +4.65% & +19.67%, respectively. Three year performance is +3.08%, five-year is +3.14%
Figures for National Bank Preferred Equity Fund (formerly Altamira Preferred Equity Fund) are +0.65%, +4.33% and +18.96% for one-, three- and twelve months, respectively. Three year performance is +2.01%; five-year is +1.79%

According to the fund’s fact sheet as of June 30, 2016, the fund’s inception date was October 30, 2015. I do not know how they justify this nonsensical statement, but will assume that prior performance is being suppressed in some perfectly legal manner that somebody at National considers ethical.

The figures for the NAV of BMO S&P/TSX Laddered Preferred Share Index ETF (ZPR) is +20.14% for the past twelve months. Two year performance is +12.06%, three year is -1.10%, five year is -0.12%.
Figures for Natixis Canadian Preferred Share Class (formerly NexGen Canadian Preferred Share Tax Managed Fund) are -%, +% and -% for one-, three- and twelve-months, respectively.
Figures for BMO Preferred Share Fund are +3.62% and +13.78% for the past three- and twelve-months, respectively. Three year performance is +0.04%.
Figures for PowerShares Canadian Preferred Share Index Class, Series F are +21.68% for the past twelve months. The three-year figure is +2.70%; five years is +1.87%
Figures for the First Asset Preferred Share Investment Trust (PSF.UN) are no longer available since the fund has merged with First Asset Preferred Share ETF (FPR)

MAPF returns assume reinvestment of dividends, and are shown after expenses but before fees. Past performance is not a guarantee of future performance. You can lose money investing in Malachite Aggressive Preferred Fund or any other fund. For more information, see the fund’s main page. The fund is available either directly from Hymas Investment Management or through a brokerage account at Odlum Brown Limited.

Obviously, the last twelve months have been superb for both preferred shares in general and the fund in particular, but I think that there is still room for outsized gains. The Seniority Spread (the interest-equivalent yield on reasonably liquid, investment-grade PerpetualDiscounts less the yield on long term corporate bonds) is still quite elevated (chart end-date 2017-11-10):

pl_171110_body_chart_1
Click for Big

… and the relationship between five-year Canada yields and yields on investment-grade FixedResets is also well within what I consider ‘decoupled panic’ territory (chart end-date 2017-10-13):

pl_171110_body_chart_5
Click for Big

In addition, I feel that the yield on five-year Canadas is unsustainably low (it should be the inflation rate plus an increment of … 1%? 1.5%? 2.0%?),and a return to sustainable levels is likely over the medium term.

FixedReset performance on the month was +0.84% vs. PerpetualDiscounts of +1.18% in October; the former has outperformed by about 100bp over the past three months:

himi_indexperf_171130
Click for Big

Of course, it’s one thing to say that ‘spreads are unsustainable and so are government yields’ and it’s quite another to forecast just how and when a more economically sustainable environment will take effect. It could be years. There could be a reversal, particularly if Trump’s international trade policies cause a severe recession or even a depression. And, of course, I could be just plain wrong about the sustainability of the current environment.

The Bank of Canada’s stood pat on policy in October and subsequent chatter indicated a dovish interpretation of the Bank’s remarks. This has deflated government yields somewhat and hence FixedReset expected yields and current returns. However, a strong employment backdrop is boosting speculation that Canada will be faster to follow the Federal Reserve during its anticipated policy tightening.

I think that a broad, sustainable rally in FixedResets will require higher five-year Canada yields (or a widespread expectation of them) … and although I’m sure this will happen eventually, it would be foolish to speculate on just when it will happen!

Calculation of MAPF Sustainable Income Per Unit
Month NAVPU Portfolio
Average
YTW
Leverage
Divisor
Securities
Average
YTW
Capital
Gains
Multiplier
Sustainable
Income
per
current
Unit
June, 2007 9.3114 5.16% 1.03 5.01% 1.3240 0.3524
September 9.1489 5.35% 0.98 5.46% 1.3240 0.3773
December, 2007 9.0070 5.53% 0.942 5.87% 1.3240 0.3993
March, 2008 8.8512 6.17% 1.047 5.89% 1.3240 0.3938
June 8.3419 6.034% 0.952 6.338% 1.3240 $0.3993
September 8.1886 7.108% 0.969 7.335% 1.3240 $0.4537
December, 2008 8.0464 9.24% 1.008 9.166% 1.3240 $0.5571
March 2009 $8.8317 8.60% 0.995 8.802% 1.3240 $0.5872
June 10.9846 7.05% 0.999 7.057% 1.3240 $0.5855
September 12.3462 6.03% 0.998 6.042% 1.3240 $0.5634
December 2009 10.5662 5.74% 0.981 5.851% 1.1141 $0.5549
March 2010 10.2497 6.03% 0.992 6.079% 1.1141 $0.5593
June 10.5770 5.96% 0.996 5.984% 1.1141 $0.5681
September 11.3901 5.43% 0.980 5.540% 1.1141 $0.5664
December 2010 10.7659 5.37% 0.993 5.408% 1.0298 $0.5654
March, 2011 11.0560 6.00% 0.994 5.964% 1.0298 $0.6403
June 11.1194 5.87% 1.018 5.976% 1.0298 $0.6453
September 10.2709 6.10%
Note
1.001 6.106% 1.0298 $0.6090
December, 2011 10.0793 5.63%
Note
1.031 5.805% 1.0000 $0.5851
March, 2012 10.3944 5.13%
Note
0.996 5.109% 1.0000 $0.5310
June 10.2151 5.32%
Note
1.012 5.384% 1.0000 $0.5500
September 10.6703 4.61%
Note
0.997 4.624% 1.0000 $0.4934
December, 2012 10.8307 4.24% 0.989 4.287% 1.0000 $0.4643
March, 2013 10.9033 3.87% 0.996 3.886% 1.0000 $0.4237
June 10.3261 4.81% 0.998 4.80% 1.0000 $0.4957
September 10.0296 5.62% 0.996 5.643% 1.0000 $0.5660
December, 2013 9.8717 6.02% 1.008 5.972% 1.0000 $0.5895
March, 2014 10.2233 5.55% 0.998 5.561% 1.0000 $0.5685
June 10.5877 5.09% 0.998 5.100% 1.0000 $0.5395
September 10.4601 5.28% 0.997 5.296% 1.0000 $0.5540
December, 2014 10.5701 4.83% 1.009 4.787% 1.0000 $0.5060
March, 2015 9.9573 4.99% 1.001 4.985% 1.0000 $0.4964
June, 2015 9.4181 5.55% 1.002 5.539% 1.0000 $0.5217
September 7.8140 6.98% 0.999 6.987% 1.0000 $0.5460
December, 2015 8.1379 6.85% 0.997 6.871% 1.0000 $0.5592
March, 2016 7.4416 7.79% 0.998 7.805% 1.0000 $0.5808
June 7.6704 7.67% 1.011 7.587% 1.0000 $0.5819
September 8.0590 7.35% 0.993 7.402% 1.0000 $0.5965
December, 2016 8.5844 7.24% 0.990 7.313% 1.0000 $0.6278
March, 2017 9.3984 6.26% 0.994 6.298% 1.0000 $0.5919
June 9.5313 6.41% 0.998 6.423% 1.0000 $0.6122
September 9.7129 6.56% 0.998 6.573% 1.0000 $0.6384
November, 2017 10.1466 5.89% 0.991 5.943% 1.0000 $0.6030
NAVPU is shown after quarterly distributions of dividend income and annual distribution of capital gains.
Portfolio YTW includes cash (or margin borrowing), with an assumed interest rate of 0.00%
The Leverage Divisor indicates the level of cash in the account: if the portfolio is 1% in cash, the Leverage Divisor will be 0.99
Securities YTW divides “Portfolio YTW” by the “Leverage Divisor” to show the average YTW on the securities held; this assumes that the cash is invested in (or raised from) all securities held, in proportion to their holdings.
The Capital Gains Multiplier adjusts for the effects of Capital Gains Dividends. On 2009-12-31, there was a capital gains distribution of $1.989262 which is assumed for this purpose to have been reinvested at the final price of $10.5662. Thus, a holder of one unit pre-distribution would have held 1.1883 units post-distribution; the CG Multiplier reflects this to make the time-series comparable. Note that Dividend Distributions are not assumed to be reinvested.
Sustainable Income is the resultant estimate of the fund’s dividend income per current unit, before fees and expenses. Note that a “current unit” includes reinvestment of prior capital gains; a unitholder would have had the calculated sustainable income with only, say, 0.9 units in the past which, with reinvestment of capital gains, would become 1.0 current units.
DeemedRetractibles are comprised of all Straight Perpetuals (both PerpetualDiscount and PerpetualPremium) issued by BMO, BNS, CM, ELF, GWO, HSB, IAG, MFC, NA, RY, SLF and TD, which are not exchangable into common at the option of the company (definition refined in May, 2011). These issues are analyzed as if their prospectuses included a requirement to redeem at par on or prior to 2022-1-31 (banks) or 2025-1-31 (insurers and insurance holding companies), in addition to the call schedule explicitly defined. See OSFI Does Not Grandfather Extant Tier 1 Capital, CM.PR.D, CM.PR.E, CM.PR.G: Seeking NVCC Status and the January, February, March and June, 2011, editions of PrefLetter for the rationale behind this analysis.

The same reasoning is also applied to FixedResets from these issuers, other than explicitly defined NVCC from banks.

Yields for September, 2011, to January, 2012, were calculated by imposing a cap of 10% on the yields of YLO issues held, in order to avoid their extremely high calculated yields distorting the calculation and to reflect the uncertainty in the marketplace that these yields will be realized. From February to September 2012, yields on these issues have been set to zero. All YLO issues held were sold in October 2012.

These calculations were performed assuming constant contemporary GOC-5 and 3-Month Bill rates, as follows:

Canada Yields Assumed in Calculations
Month-end GOC-5 3-Month Bill
September, 2015 0.78% 0.40%
December, 2015 0.71% 0.46%
March, 2016 0.70% 0.44%
June 0.57% 0.47%
September 0.58% 0.53%
December, 2016 1.16% 0.47%
March, 2017 1.08% 0.55%
June 1.35% 0.69%
September 1.79% 0.97%
November, 2017 1.62% 0.87%

Significant positions were held in NVCC non-compliant regulated FixedReset issues on November 30, 2017; all of these currently have their yields calculated with the presumption that they will be called by the issuers at par prior to 2022-1-31 (banks) or 2025-1-31 (insurers and insurance holding companies) or on a different date (SplitShares) This presents another complication in the calculation of sustainable yield, which also assumes that redemption proceeds will be reinvested at the same rate. It will also be noted that my analysis of likely insurance industry regulation as recently updated is not given much weight by the market.

I will also note that the sustainable yield calculated above is not directly comparable with any yield calculation currently reported by any other preferred share fund as far as I am aware. The Sustainable Yield depends on:
i) Calculating Yield-to-Worst for each instrument and using this yield for reporting purposes;
ii) Using the contemporary value of Five-Year Canadas to estimate dividends after reset for FixedResets. The assumption regarding the five-year Canada rate has become more important as the proportion of low-spread FixedResets in the portfolio has increased.
iii) Making the assumption that deeply discounted NVCC non-compliant issues from both banks and insurers, both Straight and FixedResets will be redeemed at par on their DeemedMaturity date as discussed above.

MAPF Portfolio Composition: November, 2017

Saturday, December 2nd, 2017

Turnover declined slightly to about 7% in November.

There is extreme segmentation in the marketplace, with OSFI’s NVCC rule changes in February 2011 having had the effect of splitting the formerly relatively homogeneous Straight Perpetual class of preferreds into three parts:

  • Unaffected Straight Perpetuals
  • DeemedRetractibles explicitly subject to the rules (banks)
  • DeemedRetractibles considered by me, but not (yet!) by the market, to be likely to be explicitly subject to the rules in the future (insurers and insurance holding companies)

This segmentation, and the extreme valuation differences between the segments, has cut down markedly on the opportunities for trading.

To make this more clear, it used to be that there were 70-odd Straight Perpetuals and I was more or less indifferent as to which ones I owned (subject, of course, to issuer concentration concerns and other risk management factors). Thus, if any one of these 70 were to go down in price by – say – $0.25, I would quite often have something in inventory that I’d be willing to swap for it. The segmentation means that I am no longer indifferent; in addition to checking the valuation of a potential buy to other Straights, I also have to check its peer group. This cuts down on the potential for trading.

And, of course, the same segmentation has the same effect on trading opportunities between FixedReset issues.

There is no real hope that this situation will be corrected in the near-term. OSFI has indicated that the long-promised “Draft Definition of Capital” for insurers will not be issued “for public consultation in late 2012 or early 2013”, as they fear that it might encourage speculation in the marketplace. It is not clear why OSFI is so afraid of informed speculation, since the constant speculation in the marketplace is currently less informed than it would be with a little bit of regulatory clarity. While the framework has been updated, the modifications focus on the amount of capital required, not the required characteristics of that capital. However, OSFI has recently indicated that it would support a mechanism similar to the NVCC rule for banks, so we may see some developments as the IAIS deliberations regarding insurance capital continue.

As a result of this delay, I have extended the Deemed Maturity date for insurers and insurance holding companies by three years (to 2025-1-31), in the expectation that when OSFI finally does provide clarity, they will allow the same degree of lead-in time for these companies as they did for banks. This had a major effect on the durations of preferred shares subject to the change but, fortunately, not much on their calculated yields as most of these issues were either trading near par when the change was made or were trading at sufficient premium that a par call was expected on economic grounds. However, with the declines in the market over the past nine months, the expected capital gain on redemption of the insurance-issued DeemedRetractibles has become an important component of the calculated yield.

Due to the footdragging by OSFI, I will be extending the DeemedMaturity date for insurance issues by another few years in the near future.

Sectoral distribution of the MAPF portfolio on November 30 was as follows:

MAPF Sectoral Analysis 2017-11-30
HIMI Indices Sector Weighting YTW ModDur
Ratchet 0% N/A N/A
FixFloat 0% N/A N/A
Floater 0% N/A N/A
OpRet 0% N/A N/A
SplitShare 8.3% 4.60% 5.42
Interest Rearing 0% N/A N/A
PerpetualPremium 0% N/A N/A
PerpetualDiscount 11.5% 5.24% 15.05
Fixed-Reset 59.5% 5.99% 8.24
Deemed-Retractible 2.1% 5.71% 5.91
FloatingReset 7.9% 7.85% 6.39
Scraps (Various) 9.7% 6.13% 12.44
Cash +0.9% 0.00% 0.00
Total 100% 5.89% 8.92
Totals and changes will not add precisely due to rounding. Cash is included in totals with duration and yield both equal to zero.
DeemedRetractibles are comprised of all Straight Perpetuals (both PerpetualDiscount and PerpetualPremium) issued by BMO, BNS, CM, ELF, GWO, HSB, IAG, MFC, NA, RY, SLF and TD, which are not exchangable into common at the option of the company. These issues are analyzed as if their prospectuses included a requirement to redeem at par on or prior to 2022-1-31 (banks) or 2025-1-3 (insurers and insurance holding companies), in addition to the call schedule explicitly defined. See OSFI Does Not Grandfather Extant Tier 1 Capital, CM.PR.D, CM.PR.E, CM.PR.G: NVCC Status Confirmed and the January, February, March and June, 2011, editions of PrefLetter for the rationale behind this analysis.

Note that the estimate for the time this will become effective for insurers and insurance holding companies was extended by three years in April 2013, due to the delays in OSFI’s providing clarity on the issue.

Calculations of resettable instruments are performed assuming a constant GOC-5 rate of 1.62% and a constant 3-Month Bill rate of 0.87%

The “total” reflects the un-leveraged total portfolio (i.e., cash is included in the portfolio calculations and is deemed to have a duration and yield of 0.00.). MAPF will often have relatively large cash balances, both credit and debit, to facilitate trading. Figures presented in the table have been rounded to the indicated precision.

Credit distribution is:

MAPF Credit Analysis 2017-11-30
DBRS Rating Weighting
Pfd-1 0
Pfd-1(low) 0
Pfd-2(high) 42.8%
Pfd-2 31.4%
Pfd-2(low) 15.3%
Pfd-3(high) 2.0%
Pfd-3 4.3%
Pfd-3(low) 2.8%
Pfd-4(high) 0%
Pfd-4 0%
Pfd-4(low) 0%
Pfd-5(high) 0.6%
Pfd-5 0.0%
Cash +0.9%
Totals will not add precisely due to rounding.
The fund holds a position in AZP.PR.C, which is rated P-5(high) by S&P and is unrated by DBRS; it is included in the Pfd-5(high) total.
A position held in INE.PR.A is not rated by DBRS, but has been included as “Pfd-3” in the above table on the basis of its S&P rating of P-3.

Liquidity Distribution is:

MAPF Liquidity Analysis 2017-11-30
Average Daily Trading Weighting
<$50,000 13.0%
$50,000 – $100,000 42.8%
$100,000 – $200,000 39.4%
$200,000 – $300,000 1.0%
>$300,000 3.6%
Cash +0.2%
Totals will not add precisely due to rounding.

MAPF is, of course, Malachite Aggressive Preferred Fund, a “unit trust” managed by Hymas Investment Management Inc. Further information and links to performance, audited financials and subscription information are available the fund’s web page. The fund may be purchased either directly from Hymas Investment Management or through a brokerage account at Odlum Brown Limited. A “unit trust” is like a regular mutual fund, but is sold by offering memorandum rather than prospectus. This is cheaper, but means subscription is restricted to “accredited investors” (as defined by the Ontario Securities Commission). Fund past performances are not a guarantee of future performance. You can lose money investing in MAPF or any other fund.

A similar portfolio composition analysis has been performed on the Claymore Preferred Share ETF (symbol CPD) (and other funds) as of July 31, 2017, and published in the August, 2017, PrefLetter. It is fair to say:

  • MAPF credit quality is much better
  • MAPF liquidity is lower
  • MAPF Yield is higher
  • Weightings
    • MAPF has similar exposure to Straight Perpetuals
      • Much more exposed to PerpetualDiscounts
      • Much less exposed to DeemedRetractibles
      • A little less exposed to PerpetualPremiums
    • Neither portfolio is exposed to Operating Retractibles (there aren’t too many of those any more!)
    • MAPF is more exposed to SplitShares
    • MAPF is a little less exposed to FixFloat / Floater / Ratchet
    • MAPF is a little higher weighted in FixedResets, but has a greater emphasis on lower-spread issues

NPI.PR.C To Reset At 5.08%

Saturday, December 2nd, 2017

Northland Power Inc. has announced:

the fixed dividend rate on its Cumulative Rate Reset Preferred Shares, Series 3 (“Series 3 Shares”) for the five years commencing December 31, 2017 and ending December 30, 2022. The fixed quarterly dividends on the Series 3 Shares during that period will be paid at an annual rate of 5.08% (Cdn. $0.3132 per share per quarter).

Holders of Series 3 Shares have the right, at their option, exercisable not later than 5:00 pm (Toronto time) on December 18, 2017, to elect to convert all or part of their Series 3 Shares, on a one-for-one basis, into Cumulative Floating Rate Preferred Shares, Series 4 (the “Series 4 Shares”), effective December 31, 2017. Holders of Series 3 Shares are not required to elect to convert all or any part of their Series 3 Shares into Series 4 Shares.

The quarterly floating rate dividends on the Series 4 Shares will be paid at an annual rate, calculated for each quarter, of 3.46% over the annual yield on 90-day Government of Canada treasury bills. The actual quarterly dividend rate in respect of the December 31, 2017 to March 30, 2018 dividend period for the Series 4 Shares will be 1.07% (4.33% on an annualized basis) and the dividend, if and when declared, for such dividend period will be Cdn. $0.2669 per share, payable on March 31, 2018.

As provided in the share conditions of the Series 3 Shares, if Northland determines that, after giving effect to the election notices received to convert Series 3 Shares, there would be fewer than 1,000,000 (i) Series 3 Shares outstanding after December 31, 2017, all remaining Series 3 Shares will be automatically converted into Series 4 Shares on a one-for-one basis effective December 31, 2017; and (ii) Series 4 Shares outstanding after December 31, 2017, no Series 3 Shares will be permitted to be converted into Series 4 Shares. There are currently 4,800,000 Series 3 Shares outstanding.

Northland intends to apply to the Toronto Stock Exchange (“TSX”) to list the Series 4 Shares effective upon conversion. Listing of the Series 4 Shares will be subject to Northland fulfilling all the listing requirements of the TSX and, upon approval, the Series 4 Shares will be listed on the TSX under the trading symbol “NPI.PR.D.”

NPI.PR.C is a FixedReset, 5.00%+346, that commenced trading 2012-5-24 after being announced 2012-5-14. It is tracked by HIMIPref™ but relegated to the Scraps index on credit concerns.

The most logical way to analyze the question of whether or not to convert is through the theory of Preferred Pairs, for which a calculator is available. Briefly, a Strong Pair is defined as a pair of securities that can be interconverted in the future (e.g., IFC.PR.A and the FloatingReset that will exist if enough holders convert). Since they will be interconvertible on this future date, it may be assumed that they will be priced identically on this date (if they aren’t then holders will simply convert en masse to the higher-priced issue). And since they will be priced identically on a given date in the future, any current difference in price must be offset by expectations of an equal and opposite value of dividends to be received in the interim. And since the dividend rate on one element of the pair is both fixed and known, the implied average rate of the other, floating rate, instrument can be determined. Finally, we say, we may compare these average rates and take a view regarding the actual future course of that rate relative to the implied rate, which will provide us with guidance on which element of the pair is likely to outperform the other until the next interconversion date, at which time the process will be repeated.

We can show the break-even rates for each FixedReset / FloatingReset Strong Pair graphically by plotting the implied average 3-month bill rate against the next Exchange Date (which is the date to which the average will be calculated).

pairs_fr_171201
Click for Big

The market appears to have a distaste at the moment for floating rate product; most of the implied rates until the next interconversion are lower than the current 3-month bill rate and the averages for investment-grade and junk issues are both well below current market rates, at +0.38% and +0.49%, respectively! Whatever might be the result of the next few Bank of Canada overnight rate decisions, I suggest that it is unlikely that the average rate over the next five years will be lower than current – but if you disagree, of course, you may interpret the data any way you like.

Since credit quality of each element of the pair is equal to the other element, it should not make any difference whether the pair examined is investment-grade or junk, although we might expect greater variation of implied rates between junk issues on grounds of lower liquidity, and this is just what we see.

If we plug in the current bid price of the NPI.PR.C FixedReset, we may construct the following table showing consistent prices for its soon-may-be-issued FloatingReset NPI.PR.D counterpart given a variety of Implied Breakeven yields consistent with issues currently trading:

Estimate of FloatingReset NPI.PR.D (received in exchange for NPI.PR.C) Trading Price In Current Conditions
  Assumed FloatingReset
Price if Implied Bill
is equal to
FixedReset Bid Price Spread 1.00% 0.50% 0.00%
NPI.PR.C 24.52 346bp 23.90 23.39 22.89

Based on current market conditions, I suggest that the FloatingResets that will result from conversion are likely to be cheap and trading below the price of their FixedReset counterparts. Therefore, it seems likely that I will recommend that holders of NPI.PR.C continue to hold the issue and not to convert, but I will wait until it’s closer to the December 18 notification deadline before making a final pronouncement. I will note that, given the apparent cheapness of the FloatingResets, it may be a good trade to swap the FixedReset for the FloatingReset in the market once both elements of each pair are trading and you can – presumably, according to this analysis – do it with a reasonably good take-out in price, rather than doing it through the company on a 1:1 basis. But that, of course, will depend on the prices at that time and your forecast for the path of policy rates over the next five years. There are no guarantees – my recommendation is based on the assumption that current market conditions with respect to the pairs will continue until the FloatingResets commence trading and that the relative pricing of the two new pairs will reflect these conditions.