More news about the generational wealth transfer of ludicrous university tuition:
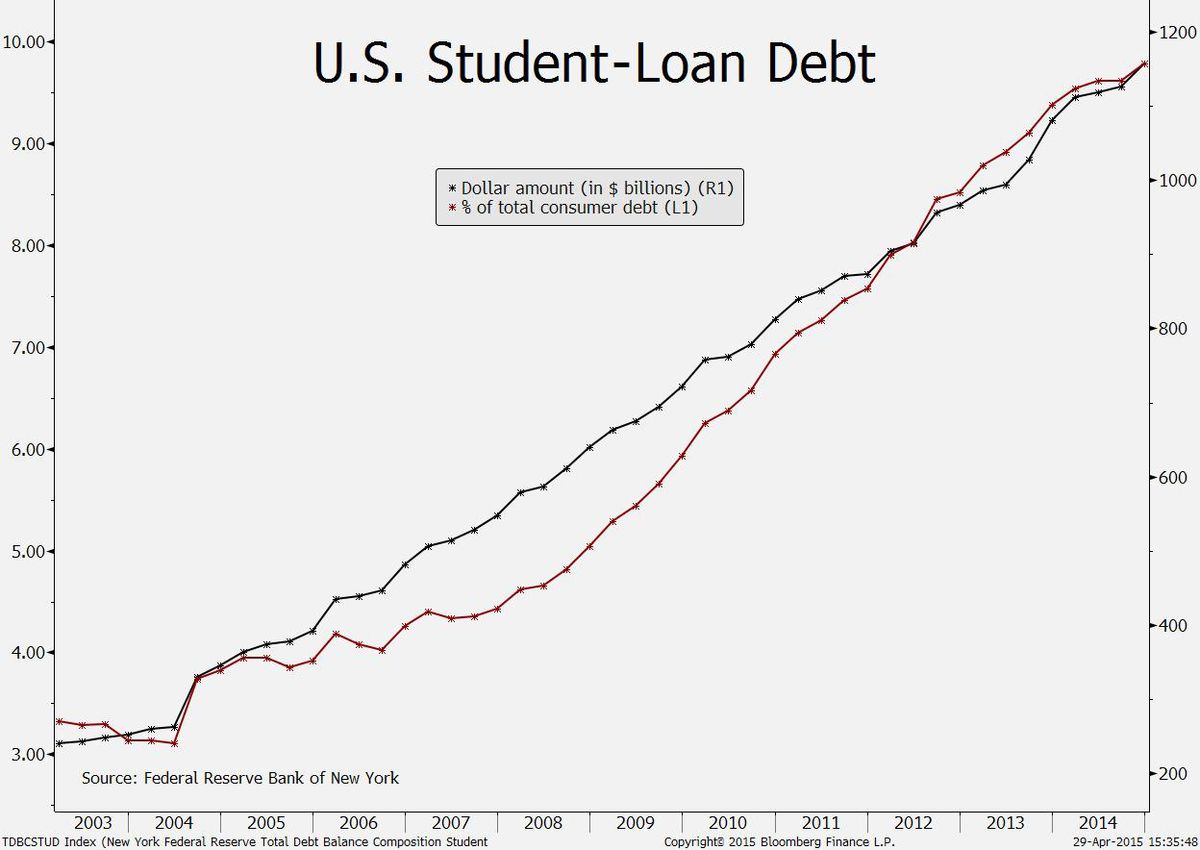
Surging student-loan debt represents a key risk to the economy’s expansion because wage gains are failing to keep up, according to Beth Ann Bovino, U.S. chief economist at Standard & Poor’s.
As the attached chart illustrates, the dollar amount of borrowing has increased in each quarter since 2003, when data compiled by the Federal Reserve Bank of New York begins. The chart also displays student loans as a percentage of consumer debt, which has consistently risen since 2007’s third quarter.
Education-related loans amounted to $1.16 trillion at the end of last year, a 71 percent increase from the second quarter of 2009, when the latest recession ended. The growth contrasted with declines in mortgages, home-equity loans, credit cards and other forms of consumer borrowing.
Click for Big
To brighten everybody’s day, here’s another drone story:
Industrial deforestation is responsible for the destruction of forests worldwide and results in disruptive effects on their ecosystems, including reduced biodiversity, increased soil erosion and the release of greenhouse gas emissions, to name a few.
Planting a tree takes a lot longer than cutting one down, and it’s a relatively slow and expensive process. Fortunately, a solution may be on the horizon.
BioCarbon Engineering, the brainchild of former NASA engineer Lauren Fletcher, has proposed a solution: Industrial reforestation with robot drones. Could reforestation get any more awesome?
The drones would plant an estimated 1 billion trees a year, saving people from having to do it by hand. This would make reforestation quicker and cheaper. However, Fletcher doesn’t say that this new method of reforestation is necessarily better than planting trees by hand, just cheaper. If put into full effect, the drone method of planting trees could cut the price of traditional practices down to 15% of the original cost.
Much to the amusement of Bloomberg, Ben Bernanke took some shots at the Wall Street Journal:
The editorialists point out that the Federal Open Market Committee’s projections of economic growth have been too high since the financial crisis, which is true. Therefore (the WSJ concludes), monetary policy is not working and efforts to use it to support the recovery should be discontinued.
It’s generous of the WSJ writers to note, as they do, that “economic forecasting isn’t easy.” They should know, since the Journal has been forecasting a breakout in inflation and a collapse in the dollar at least since 2006, when the FOMC decided not to raise the federal funds rate above 5-1/4 percent.
…
The WSJ also argues that, because monetary policy has not been a panacea for our economic troubles, we should stop using it. I agree that monetary policy is no panacea, and as Fed chairman I frequently said so. With short-term interest rates pinned near zero, monetary policy is not as powerful or as predictable as at other times. But the right inference is not that we should stop using monetary policy, but rather that we should bring to bear other policy tools as well. I am waiting for the WSJ to argue for a well-structured program of public infrastructure development, which would support growth in the near term by creating jobs and in the longer term by making our economy more productive.
It must be nice to have retired from public life and be able to shoot back a little!
the previously scheduled deflation has been cancelled:
Euro-area consumer prices ended a four-month streak of declines after the European Central Bank started pumping billions of euros into the bloc’s economy through its quantitative-easing program.
Prices stagnated in April from a year earlier after falling 0.1 percent in March, the European Union’s statistics office in Luxembourg said Thursday. The inflation reading was in line with the median estimate in a Bloomberg survey. Unemployment held at 11.3 percent in March.
The improvement helps ECB President Mario Draghi’s case that large-scale asset purchases have already shown success in averting deflation in the 19-nation economy. Bank lending increased in March for the first time since 2012 and encouraging data from Germany to Spain point to a strengthening recovery even as the Greek crisis undermines confidence.
“The big bad deflationary spiral lasted all of four months,” said Nick Kounis, head of macro research at ABN Amro Bank NV in Amsterdam. “We expect headline inflation to accelerate to above 1 percent by year end as the depressing impact of energy prices fades,” while “core inflation will start to pick up as the effects of the past depreciation of the euro and the recovery of the economy feed through.”
Prices excluding vulnerable items such as energy, food and tobacco rose 0.6 percent from April last year, according to Eurostat. A slump in energy prices eased.
Nova Scotia Power is the proud issuer of NSI.PR.D, an operating retractible with a 5.9% coupon that will become redeemable at
$25.00 on October 15 of this year. Today, the company issued 30 year notes at 3.612%. Any bets on redemption?
Brookfield Asset Management Inc., proud issuer of more series of shares, directly and indirectly, than you can shake a stick at, has been confirmed at Pfd-2(low) by DBRS:
DBRS Limited (DBRS) has today confirmed the ratings and Stable trend of Brookfield Asset Management Inc. (BAM or the Company) as indicated in the table below. The confirmation reflects the increasing contribution of predictable fee-based revenue to the Company following its corporate reorganization and that BAM’s core business segments have performed in line with expectation. Performance in 2014 was supported by (1) average hydrology on an enlarged capacity in the renewable energy segment, (2) improving in-place rents and occupancy rates in office properties and strong retail properties demand in the United States and (3) increased contribution from assets recently commissioned or acquired in the infrastructure segment. With its reorganization completed, DBRS expects such fees (a large proportion of which are fixed or based on sizes of fee-bearing assets) to be predictable and to increasingly contribute to company-level cash flows.
With only a moderate increase in company-level borrowings, BAM’s financial metrics remain consistent with levels DBRS expects for its ratings. Despite issuances of debt and preferred shares in 2014, company-level debt increased only modestly by about $100 million, thanks largely to the favourable exchange rate effect of a weakened Canadian dollar against the U.S. dollar, the Company’s reporting currency.
BAM defines “Funds From Operations” (FFO) as “net income prior to fair value changes, depreciation and amortization, and deferred income taxes, and BAM’s proportionate share of FFO in its equity accounted investments”. DBRS understands that cash flow distributed to BAM in fees, dividends and divestment proceeds has amounted to approximately 70% to 80% of FFO (as adjusted by DBRS to exclude non-recurring items and disposition gains) in recent years. Company-level FFO-to-debt improved modestly to 39% in 2014 from 38% in 2013, while FFO interest coverage recorded a larger improvement to 7.9 times (x) from 6.0x, as BAM refinanced maturing debt with lower-cost debt issues. On an adjusted basis, FFO-to-debt in 2014 was 33% and FFO interest coverage was 7.0x. The adjustments are in accordance with DBRS’s Preferred Share and Hybrid Criteria for Corporate Issuers, published on January 21, 2015. DBRS assesses that company-level liquidity remains strong, supported by ample cash and credit availability, a demonstrated ability to access capital markets and an ability to monetize its listed assets (with total market capitalization providing 5.5x coverage of company-level debt).
To maintain the ratings, DBRS expects BAM to maintain its company-level FFO-to-debt to at least 35% (30% on an adjusted basis) and FFO interest coverage in excess of 5.5x (5.0x on adjusted basis). In addition, DBRS expects that the Company’s business risk profiles would not materially deteriorate because of significant investments in higher-risk businesses, that cash distribution to BAM will remain at similar proportion to its annual FFO and that company-level liquidity will remain strong.
It was yet another violently mixed day for the Canadian preferred share market, with PerpetualDiscounts down 9bp, FixedResets gaining 43bp and DeemedRetractibles off 4bp. As one might expect, there is a lengthy Performance Highlights table dominated by winning FixedResets. Volume was above average.
For as long as the FixedReset market is so violently unsettled, I’ll keep publishing updates of the more interesting and meaningful series of FixedResets’ Implied Volatilities. This doesn’t include Enbridge because although Enbridge has a large number of issues outstanding, all of which are quite liquid, the range of Issue Reset Spreads is too small for decent conclusions. The low is 212bp (ENB.PR.H; second-lowest is ENB.PR.D at 237bp) and the high is a mere 268 for ENB.PF.G.
Remember that all rich /cheap assessments are:
» based on Implied Volatility Theory only
» are relative only to other FixedResets from the same issuer
» assume constant GOC-5 yield
» assume constant Implied Volatility
» assume constant spread
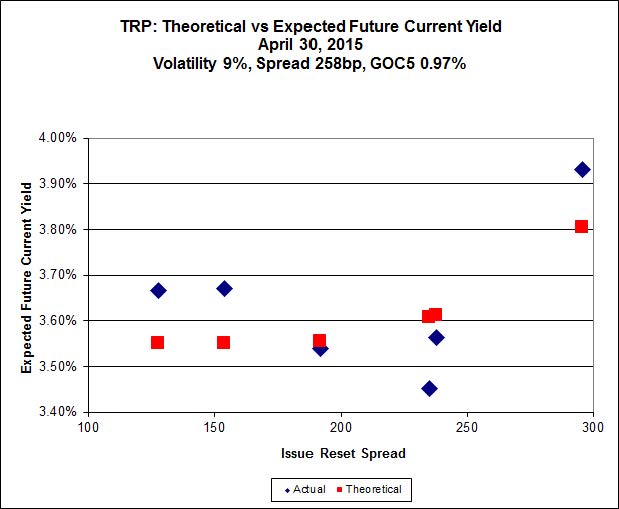
Here’s TRP:
Click for Big
TRP.PR.E, which resets 2019-10-30 at +235, is bid at 24.05 to be $1.04 rich, while TRP.PR.G, resetting 2020-11-30 at +296, is $0.83 cheap at its bid price of 25.00.
Click for Big
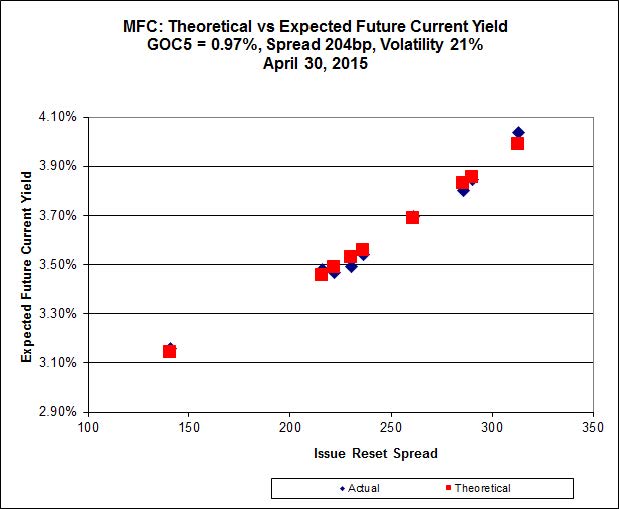
Another excellent fit, but the numbers are perplexing. Implied Volatility for MFC continues to be a conundrum. It is still too high if we consider that NVCC rules will never apply to these issues; it is still too low if we consider them to be NVCC non-compliant issues (and therefore with Deemed Maturities in the call schedule).
Most expensive is MFC.PR.N, resetting at +230 on 2020-3-19, bid at 23.40 to be $0.22 rich, while MFC.PR.H, resetting at +313bp on 2017-3-19, is bid at 25.39 to be $0.32 cheap.

Click for Big
The cheapest issue relative to its peers is BAM.PR.R, resetting at +230bp on 2016-6-30, bid at 20.17 to be $0.63 cheap. BAM.PR.X, resetting at +180bp 2017-6-30 is bid at 18.42 and appears to be $0.80 rich.
Click for Big
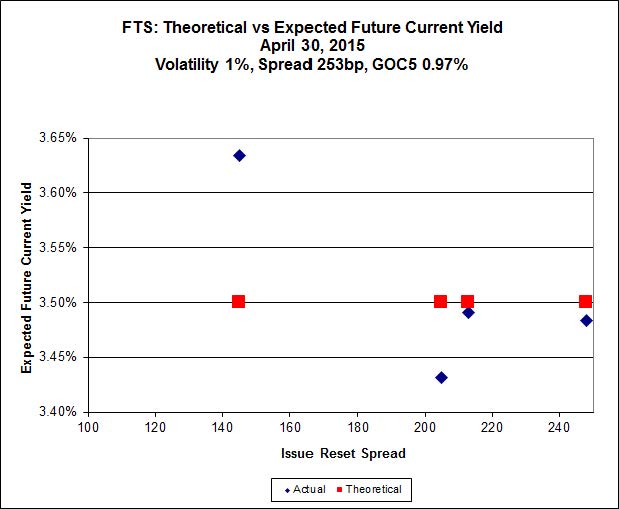
FTS.PR.H, with a spread of +145bp, and bid at 16.65, looks $0.64 cheap and resets 2015-6-1. FTS.PR.K, with a spread of +205bp and resetting 2019-3-1, is bid at 22.00 and is $0.43 rich – reclaiming the title of ‘Most Expensive FTS FixedReset’ it briefly ceded to FTS.PR.M.
Click for Big
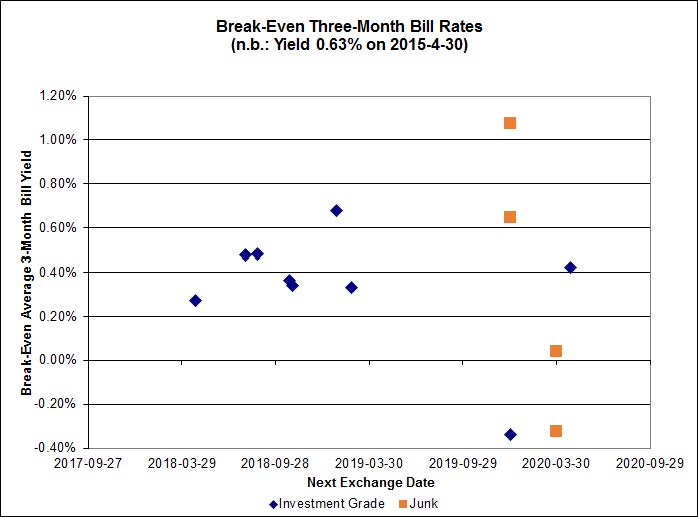
Investment-grade pairs now predict an average over the next five years of about 0.40%, but TRP.PR.A / TRP.PR.F is an outlier at -0.34%. The DC.PR.B / DC.PR.D pair retains its customary outlier status, with a breakeven rate of -1.41%.
Click for Big
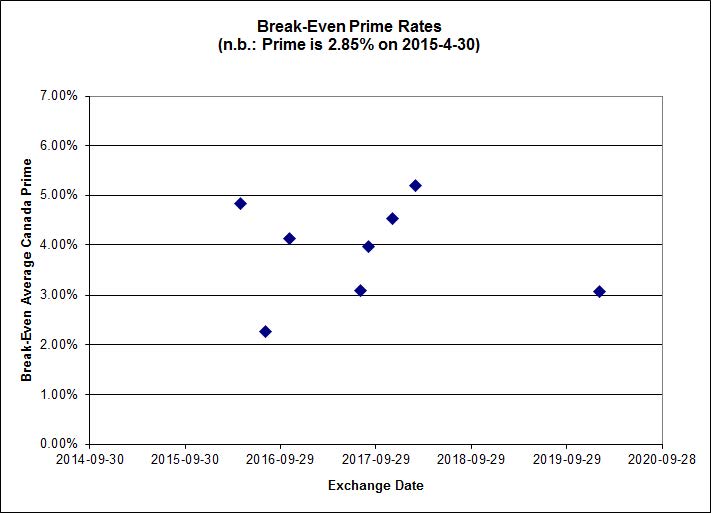
Shall we just say that this exhibits a high level of confidence in the continued rapacity of Canadian banks?
| HIMIPref™ Preferred Indices These values reflect the December 2008 revision of the HIMIPref™ Indices Values are provisional and are finalized monthly |
|||||||
| Index | Mean Current Yield (at bid) |
Median YTW |
Median Average Trading Value |
Median Mod Dur (YTW) |
Issues | Day’s Perf. | Index Value |
| Ratchet | 0.00 % | 0.00 % | 0 | 0.00 | 0 | 2.0075 % | 2,274.5 |
| FixedFloater | 0.00 % | 0.00 % | 0 | 0.00 | 0 | 2.0075 % | 3,976.9 |
| Floater | 3.19 % | 3.29 % | 54,839 | 18.99 | 4 | 2.0075 % | 2,418.0 |
| OpRet | 4.42 % | -4.47 % | 38,022 | 0.09 | 2 | -0.1178 % | 2,765.9 |
| SplitShare | 4.56 % | 4.64 % | 68,811 | 3.38 | 3 | 0.1200 % | 3,231.9 |
| Interest-Bearing | 0.00 % | 0.00 % | 0 | 0.00 | 0 | -0.1178 % | 2,529.1 |
| Perpetual-Premium | 5.33 % | 4.27 % | 69,300 | 0.66 | 25 | -0.0744 % | 2,518.4 |
| Perpetual-Discount | 5.14 % | 5.29 % | 138,935 | 14.94 | 9 | -0.0852 % | 2,777.5 |
| FixedReset | 4.43 % | 3.74 % | 285,615 | 16.62 | 86 | 0.4265 % | 2,393.9 |
| Deemed-Retractible | 4.93 % | 3.19 % | 112,170 | 0.24 | 36 | -0.0443 % | 2,647.2 |
| FloatingReset | 2.51 % | 3.04 % | 71,296 | 6.22 | 9 | 0.1573 % | 2,323.1 |
| Performance Highlights | |||
| Issue | Index | Change | Notes |
| BAM.PF.E | FixedReset | -1.43 % | YTW SCENARIO Maturity Type : Limit Maturity Maturity Date : 2045-04-30 Maturity Price : 22.12 Evaluated at bid price : 22.72 Bid-YTW : 4.03 % |
| BAM.PF.A | FixedReset | -1.07 % | YTW SCENARIO Maturity Type : Limit Maturity Maturity Date : 2045-04-30 Maturity Price : 22.96 Evaluated at bid price : 24.10 Bid-YTW : 4.01 % |
| SLF.PR.G | FixedReset | -1.04 % | YTW SCENARIO Maturity Type : Hard Maturity Maturity Date : 2025-01-31 Maturity Price : 25.00 Evaluated at bid price : 17.07 Bid-YTW : 6.86 % |
| BNS.PR.R | FixedReset | -1.02 % | YTW SCENARIO Maturity Type : Hard Maturity Maturity Date : 2022-01-31 Maturity Price : 25.00 Evaluated at bid price : 25.14 Bid-YTW : 3.26 % |
| FTS.PR.F | Perpetual-Premium | -1.01 % | YTW SCENARIO Maturity Type : Limit Maturity Maturity Date : 2045-04-30 Maturity Price : 24.15 Evaluated at bid price : 24.43 Bid-YTW : 5.08 % |
| TRP.PR.E | FixedReset | 1.01 % | YTW SCENARIO Maturity Type : Limit Maturity Maturity Date : 2045-04-30 Maturity Price : 22.83 Evaluated at bid price : 24.05 Bid-YTW : 3.51 % |
| GWO.PR.N | FixedReset | 1.06 % | YTW SCENARIO Maturity Type : Hard Maturity Maturity Date : 2025-01-31 Maturity Price : 25.00 Evaluated at bid price : 18.19 Bid-YTW : 6.07 % |
| BAM.PR.R | FixedReset | 1.10 % | YTW SCENARIO Maturity Type : Limit Maturity Maturity Date : 2045-04-30 Maturity Price : 20.17 Evaluated at bid price : 20.17 Bid-YTW : 4.14 % |
| TRP.PR.B | FixedReset | 1.19 % | YTW SCENARIO Maturity Type : Limit Maturity Maturity Date : 2045-04-30 Maturity Price : 15.34 Evaluated at bid price : 15.34 Bid-YTW : 3.56 % |
| ENB.PR.N | FixedReset | 1.20 % | YTW SCENARIO Maturity Type : Limit Maturity Maturity Date : 2045-04-30 Maturity Price : 21.11 Evaluated at bid price : 21.11 Bid-YTW : 4.35 % |
| ENB.PR.P | FixedReset | 1.26 % | YTW SCENARIO Maturity Type : Limit Maturity Maturity Date : 2045-04-30 Maturity Price : 20.86 Evaluated at bid price : 20.86 Bid-YTW : 4.27 % |
| ENB.PR.Y | FixedReset | 1.27 % | YTW SCENARIO Maturity Type : Limit Maturity Maturity Date : 2045-04-30 Maturity Price : 19.94 Evaluated at bid price : 19.94 Bid-YTW : 4.37 % |
| CU.PR.F | Perpetual-Discount | 1.29 % | YTW SCENARIO Maturity Type : Limit Maturity Maturity Date : 2045-04-30 Maturity Price : 23.21 Evaluated at bid price : 23.55 Bid-YTW : 4.83 % |
| ENB.PR.J | FixedReset | 1.33 % | YTW SCENARIO Maturity Type : Limit Maturity Maturity Date : 2045-04-30 Maturity Price : 21.77 Evaluated at bid price : 22.10 Bid-YTW : 4.16 % |
| SLF.PR.H | FixedReset | 1.38 % | YTW SCENARIO Maturity Type : Hard Maturity Maturity Date : 2025-01-31 Maturity Price : 25.00 Evaluated at bid price : 22.05 Bid-YTW : 4.76 % |
| RY.PR.H | FixedReset | 1.43 % | YTW SCENARIO Maturity Type : Limit Maturity Maturity Date : 2045-04-30 Maturity Price : 22.89 Evaluated at bid price : 24.14 Bid-YTW : 3.31 % |
| ENB.PF.G | FixedReset | 1.59 % | YTW SCENARIO Maturity Type : Limit Maturity Maturity Date : 2045-04-30 Maturity Price : 21.83 Evaluated at bid price : 22.30 Bid-YTW : 4.28 % |
| TRP.PR.D | FixedReset | 1.60 % | YTW SCENARIO Maturity Type : Limit Maturity Maturity Date : 2045-04-30 Maturity Price : 22.62 Evaluated at bid price : 23.50 Bid-YTW : 3.57 % |
| CM.PR.O | FixedReset | 1.67 % | YTW SCENARIO Maturity Type : Limit Maturity Maturity Date : 2045-04-30 Maturity Price : 22.96 Evaluated at bid price : 24.30 Bid-YTW : 3.35 % |
| FTS.PR.K | FixedReset | 1.85 % | YTW SCENARIO Maturity Type : Limit Maturity Maturity Date : 2045-04-30 Maturity Price : 21.69 Evaluated at bid price : 22.00 Bid-YTW : 3.59 % |
| RY.PR.Z | FixedReset | 1.97 % | YTW SCENARIO Maturity Type : Limit Maturity Maturity Date : 2045-04-30 Maturity Price : 22.97 Evaluated at bid price : 24.29 Bid-YTW : 3.25 % |
| BNS.PR.Y | FixedReset | 2.19 % | YTW SCENARIO Maturity Type : Hard Maturity Maturity Date : 2022-01-31 Maturity Price : 25.00 Evaluated at bid price : 22.85 Bid-YTW : 3.27 % |
| FTS.PR.G | FixedReset | 2.21 % | YTW SCENARIO Maturity Type : Limit Maturity Maturity Date : 2045-04-30 Maturity Price : 21.87 Evaluated at bid price : 22.20 Bid-YTW : 3.58 % |
| MFC.PR.L | FixedReset | 2.27 % | YTW SCENARIO Maturity Type : Hard Maturity Maturity Date : 2025-01-31 Maturity Price : 25.00 Evaluated at bid price : 22.50 Bid-YTW : 4.81 % |
| BAM.PR.K | Floater | 2.33 % | YTW SCENARIO Maturity Type : Limit Maturity Maturity Date : 2045-04-30 Maturity Price : 14.91 Evaluated at bid price : 14.91 Bid-YTW : 3.37 % |
| BAM.PF.B | FixedReset | 2.43 % | YTW SCENARIO Maturity Type : Limit Maturity Maturity Date : 2045-04-30 Maturity Price : 22.20 Evaluated at bid price : 22.75 Bid-YTW : 4.00 % |
| ENB.PR.T | FixedReset | 2.67 % | YTW SCENARIO Maturity Type : Limit Maturity Maturity Date : 2045-04-30 Maturity Price : 20.74 Evaluated at bid price : 20.74 Bid-YTW : 4.30 % |
| FTS.PR.H | FixedReset | 2.78 % | YTW SCENARIO Maturity Type : Limit Maturity Maturity Date : 2045-04-30 Maturity Price : 16.65 Evaluated at bid price : 16.65 Bid-YTW : 3.55 % |
| MFC.PR.F | FixedReset | 3.01 % | YTW SCENARIO Maturity Type : Hard Maturity Maturity Date : 2025-01-31 Maturity Price : 25.00 Evaluated at bid price : 18.85 Bid-YTW : 5.98 % |
| BAM.PR.C | Floater | 3.42 % | YTW SCENARIO Maturity Type : Limit Maturity Maturity Date : 2045-04-30 Maturity Price : 15.10 Evaluated at bid price : 15.10 Bid-YTW : 3.33 % |
| BAM.PR.B | Floater | 3.67 % | YTW SCENARIO Maturity Type : Limit Maturity Maturity Date : 2045-04-30 Maturity Price : 15.24 Evaluated at bid price : 15.24 Bid-YTW : 3.29 % |
| Volume Highlights | |||
| Issue | Index | Shares Traded |
Notes |
| ENB.PR.Y | FixedReset | 118,368 | Desjardins crossed blocks of 77,000 and 21,900, both at 19.89. YTW SCENARIO Maturity Type : Limit Maturity Maturity Date : 2045-04-30 Maturity Price : 19.94 Evaluated at bid price : 19.94 Bid-YTW : 4.37 % |
| FTS.PR.J | Perpetual-Premium | 67,826 | Desjardins crossed 50,000 at 24.72. YTW SCENARIO Maturity Type : Limit Maturity Maturity Date : 2045-04-30 Maturity Price : 24.29 Evaluated at bid price : 24.72 Bid-YTW : 4.86 % |
| ENB.PR.T | FixedReset | 61,411 | Desjardins crossed 10,000 at 20.30; RBC crossed 16,900 at 20.60. YTW SCENARIO Maturity Type : Limit Maturity Maturity Date : 2045-04-30 Maturity Price : 20.74 Evaluated at bid price : 20.74 Bid-YTW : 4.30 % |
| BMO.PR.J | Deemed-Retractible | 57,134 | Called for redemption. YTW SCENARIO Maturity Type : Call Maturity Date : 2015-05-30 Maturity Price : 25.25 Evaluated at bid price : 25.22 Bid-YTW : 2.20 % |
| RY.PR.J | FixedReset | 45,145 | YTW SCENARIO Maturity Type : Limit Maturity Maturity Date : 2045-04-30 Maturity Price : 23.12 Evaluated at bid price : 24.90 Bid-YTW : 3.50 % |
| SLF.PR.G | FixedReset | 43,285 | YTW SCENARIO Maturity Type : Hard Maturity Maturity Date : 2025-01-31 Maturity Price : 25.00 Evaluated at bid price : 17.07 Bid-YTW : 6.86 % |
| There were 43 other index-included issues trading in excess of 10,000 shares. | |||
| Wide Spread Highlights | ||
| Issue | Index | Quote Data and Yield Notes |
| RY.PR.K | FloatingReset | Quote: 24.15 – 24.75 Spot Rate : 0.6000 Average : 0.3497 YTW SCENARIO |
| GWO.PR.F | Deemed-Retractible | Quote: 25.55 – 26.21 Spot Rate : 0.6600 Average : 0.4547 YTW SCENARIO |
| RY.PR.L | FixedReset | Quote: 25.64 – 26.19 Spot Rate : 0.5500 Average : 0.3528 YTW SCENARIO |
| TRP.PR.F | FloatingReset | Quote: 18.76 – 19.25 Spot Rate : 0.4900 Average : 0.3178 YTW SCENARIO |
| FTS.PR.F | Perpetual-Premium | Quote: 24.43 – 25.00 Spot Rate : 0.5700 Average : 0.4004 YTW SCENARIO |
| MFC.PR.L | FixedReset | Quote: 22.50 – 23.05 Spot Rate : 0.5500 Average : 0.3828 YTW SCENARIO |