It was kind of an interesting day, with US equities getting smacked:
U.S. stocks joined a worldwide selloff, after equities’ worst month in more than three years, amid continuing concerns that China’s slowdown will weigh on the global economy.
…
The Standard & Poor’s 500 Index slid 3 percent to 1,913.85 at 4 p.m. in New York, the third-worst drop this year. … The Dow Jones Industrial Average sank 469.68 points, or 2.8 percent, to 16,058.35. The Nasdaq Composite Index lost 2.9 percent.
…
Equities dropped in Asia, with the Shanghai Composite Index slumping as much as 4.8 percent, after manufacturing reports pointed to a deepening Chinese economic slowdown.
…
International Monetary Fund Managing Director Christine Lagarde said Tuesday the global expansion outlook is worse than the lender anticipated less than two months ago. “This reflects two forces: a weaker than expected recovery in advanced economies, and a further slowdown in emerging economies, especially in Latin America,” Lagarde said in a speech in Jakarta.
A report today showed U.S. factories expanded in August at the slowest pace since May 2013 as anemic demand from emerging markets such as China translated into leaner factory order books. A measure of exports matched the weakest reading since April 2009. The weak manufacturing data surface ahead of the Federal Reserve’s September policy meeting in which they will debate whether the economy is strong enough to withstand an increase in interest rates in the face of fragile overseas economies.
In somewhat related news, it looks like the deal with Iran will survive not just US Congress, but a very noticeable surge in sponsored content for pro-Israeli groups in my Facebook feed:
President Barack Obama all but wrapped up enough U.S. Senate votes to protect the Iran nuclear deal in Congress as two more Democratic senators said Tuesday they will support the agreement.
The backing from Senators Chris Coons of Delaware and Bob Casey of Pennsylvania brings the president within one vote of the 34 he needs. Eleven Democrats haven’t declared a position, including West Virginia’s Joe Manchin, who said in July he was leaning toward supporting the agreement. An aide has said Manchin remains undecided.
Which is somewhat related because of the effects on the oil market:
The Americas will take the brunt of any cuts in oil production as Iran increases output once international sanctions are lifted, according to a report by A.T. Kearney Inc.’s oil and gas consulting practice in Dubai.
North, South and Central American oil production could fall 1.1 million barrels a day by 2020 because of higher costs as Iran’s output climbs, starting with an increase of 800,000 barrels a day next year, Chicago-based A.T. Kearney said in a report to be issued this week. Brent crude prices are seen trading at $45 to $65 a barrel next year, according to the report. The international benchmark was about $47 a barrel on Tuesday.
So slow economic growth and subdued pricing for oil add up to one thing:
Treasury market analysts are scaling back their forecasts for a selloff as yields show traders expect almost no inflation for the next two years.
Benchmark 10-year yields will hold below 3 percent through September 2016, based on Bloomberg surveys of economists, with the most recent forecasts given the heaviest weightings. In June, the projection was for 3.15 percent.
A bond-market gauge called the break-even rate shows traders expect the average annual rate of inflation to be 0.3 percent over the coming 24 months. The figure has tumbled from more than 1 percent as recently as July. Federal Reserve Bank of Boston President Eric Rosengren said uncertainty over inflation and global growth justifies a modest pace of interest-rate increases, regardless of when the central bank begins.
‘What’s in it for me’, you ask? How about more vacations in Canada?
Canada’s economy shrank again in the second quarter as plunging oil prices triggered a drop in investment, with fresh debate about a recession dealing a blow to Prime Minister Stephen Harper’s bid for re-election.
Gross domestic product declined at a 0.5 percent annualized pace from April to June, Statistics Canada said Tuesday in Ottawa. The agency revised the first-quarter contraction to 0.8 percent from 0.6 percent.
The Group of Seven’s biggest crude oil exporter is struggling as a global commodity slump guts business spending.
…
Canada’s dollar depreciated 0.3 percent to C$1.3173 per U.S. dollar at 11:55 a.m. Toronto time. The currency is down about 12 percent this year. Swaps trading showed the odds of a rate cut next week fell to about 21 percent after Tuesday’s report, down from 24 percent Monday and 36 percent a week ago.
The consecutive GDP declines are milder than any back-to-back contractions since at least 1981, including the last recession in 2009 which saw drops of 3.6 percent and 8.7 percent. The job market also suggests there’s no broad-based slump in the world’s 11th largest economy. The jobless rate of 6.8 percent for July is down from 7 percent a year ago. August labor data is due Sept. 4.
Fortunately, all this gloom is alleviated by more news from the highly entertaining battle between Sprott and the bullion trusts. Sprott recently announced:
the filing of notices of change (the “Notices of Change”) in connection with the offers (together, the “Sprott offers”) by Sprott Asset Management Gold Bid LP and Sprott Asset Management Silver Bid LP to acquire all of the outstanding units of Central GoldTrust (“GTU”) and Silver Bullion Trust (“SBT”), respectively, for units of Sprott Physical Gold Trust and units of Sprott Physical Silver Trust, in each case on a Net Asset Value (“NAV”) to NAV exchange basis.
We can find, after a bit of difficulty, the document on SEDAR, filed under “Silver Bullion Trust Aug 28 2015 17:49:05 ET Notice of change or variation – English PDF 73 K”, a public document that the regulators consider so critical to the efficient and fair functioning of the public markets that they prohibit investor scum and other interested parties from linking to it directly. After accepting the regulators’ terms of use and offering a little prayer of thanksgiving for our transparent capital markets, we find:
The Offeror has (subject to the next two sentences) agreed to pay to each Soliciting Dealer a fee of U.S.$0.0448 for each SBT Unit deposited through such Soliciting Dealer and either: (i) taken-up and paid for by the Offeror under the Offer; or (ii) provided the Merger Transaction is completed, deemed to be withdrawn from the Offer under the Merger Election, based on, among other things, the claims submitted, CDS and DTC participant deposits and the CDS and DTC participant list as at the Expiry Time. The aggregate amount payable with respect to any single beneficial holder of SBT Units will not be less than U.S.$50.00 and not be more than U.S.$1,500.00, provided that no fee will be payable in respect of deposits of less than 1,000 SBT Units per beneficial holder. When SBT Units deposited are beneficially owned by more than one person, only one minimum and maximum amount will be applied. The Offeror may require the Soliciting Dealers to furnish evidence of beneficial ownership satisfactory to the Offeror before payment of such solicitation fees.
Silver Bullion Trust has a NAVPU of USD 8.38 as of September 1, so this payment comes to a little over 50bp on unit value, which is nice work if you can get it. The target has this to say:
The Trustees note the recent announcement by Sprott that they intend to pay financial advisors and brokers to secure tenders to their Offer, a clear indication that the Sprott Offer has thus far been unable to attract sufficient Unitholder support. The Trustees caution Unitholders regarding any advice or recommendations they may receive from their financial advisors or brokers, which may be biased and based on their desire to collect solicitation fees from Sprott. Sprott is paying your broker to convince you to tender. Don’t be talked into tendering!
I continue to scan the news for mention of solicitation fees and new issue commissions being discussed in connection with potential bans on mutual fund trailer commissions, but there’s nothing. The regulators are too busy coming up with new ways to restrict public access to public documents, while self-proclaimed investor advocates concentrate on trying to get their heads out of their asses.
You know what’s good about the internet? This is what’s good about the internet:
 Click for Big
In other other news (about chess), Lev Aronian won the 2015 Sinquefield Cup (a ridiculously strong tournament), but the highlights reel has to include So – Nakamura in round 6 and Nakamura – Grischuk in round 9. Fighting chess! Those with a taste for it may wish to watch the Thoresen Chess Engine Competition Season 8, which brings the world’s strongest chess programmes together on some rather high-end hardware.
The Canadian preferred share market commenced the new month on a mixed note, with PerpetualDiscounts gaining 12bp, FixedResets down 6bp and DeemedRetractibles off 2bp. Reported yields for the FixedReset subindex dropped significantly from yesterday due to the mass migration of ENB issues from FixedResets into Scraps due to credit concerns. The Performance Highlights table continues to show a lot of churn amongst the FixedResets. Volume was extremely low.
For as long as the FixedReset market is so violently unsettled, I’ll keep publishing updates of the more interesting and meaningful series of FixedResets’ Implied Volatilities. This doesn’t include Enbridge because although Enbridge has a large number of issues outstanding, all of which are quite liquid, the range of Issue Reset Spreads is too small for decent conclusions. The low is 212bp (ENB.PR.H; second-lowest is ENB.PR.D at 237bp) and the high is a mere 268 for ENB.PF.G.
Remember that all rich /cheap assessments are:
» based on Implied Volatility Theory only
» are relative only to other FixedResets from the same issuer
» assume constant GOC-5 yield
» assume constant Implied Volatility
» assume constant spread
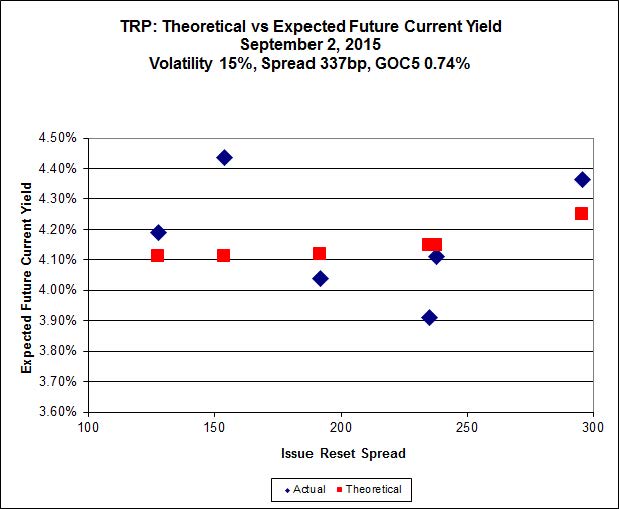
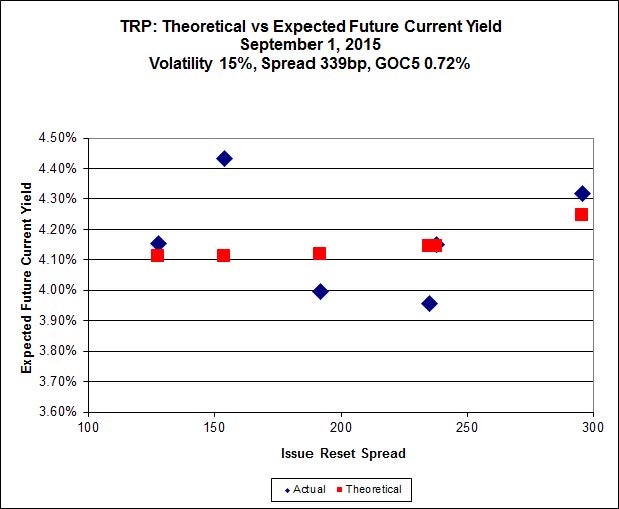
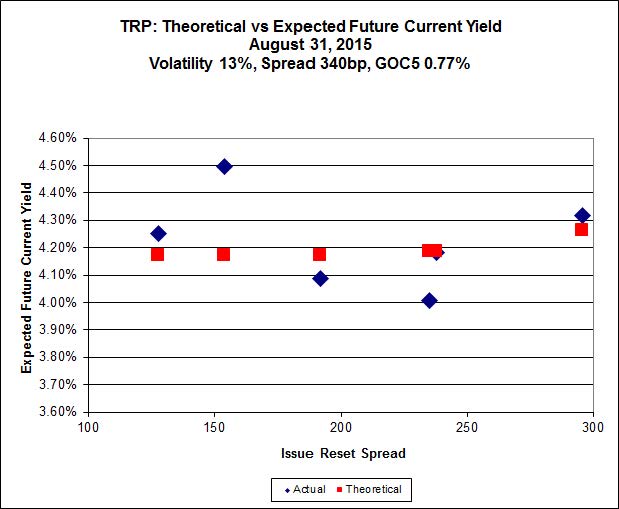
Here’s TRP:
 Click for Big
TRP.PR.E, which resets 2019-10-30 at +235, is bid at 19.40 to be $0.88 rich, while TRP.PR.C, resetting 2016-1-30 at +164, is $1.00 cheap at its bid price of 12.75.
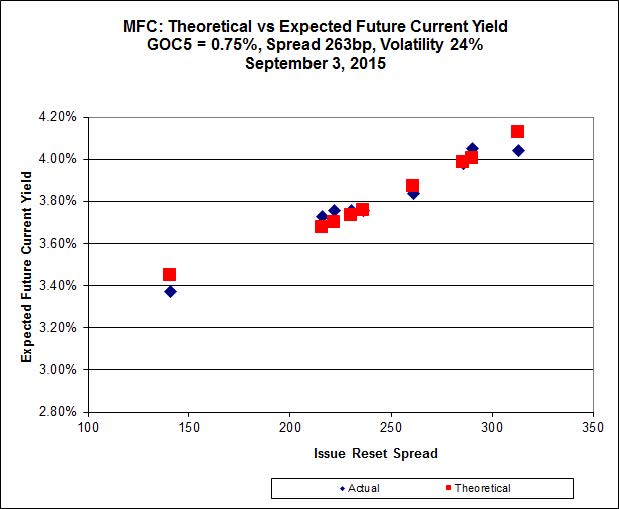
 Click for Big
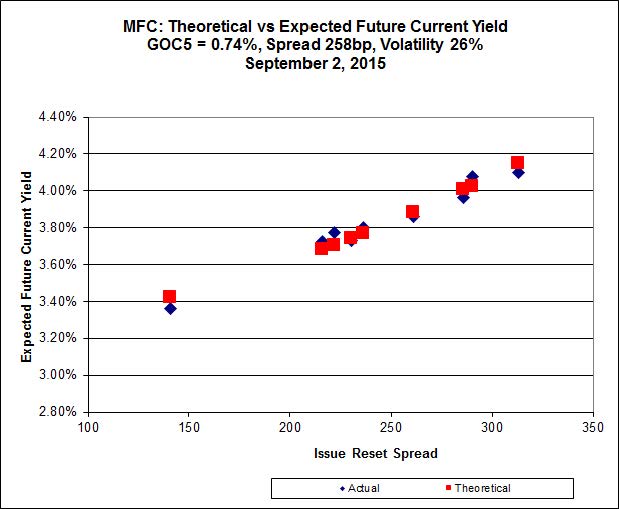
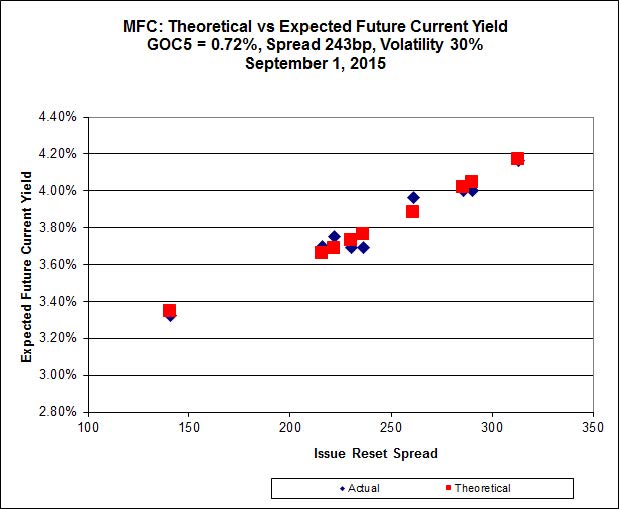
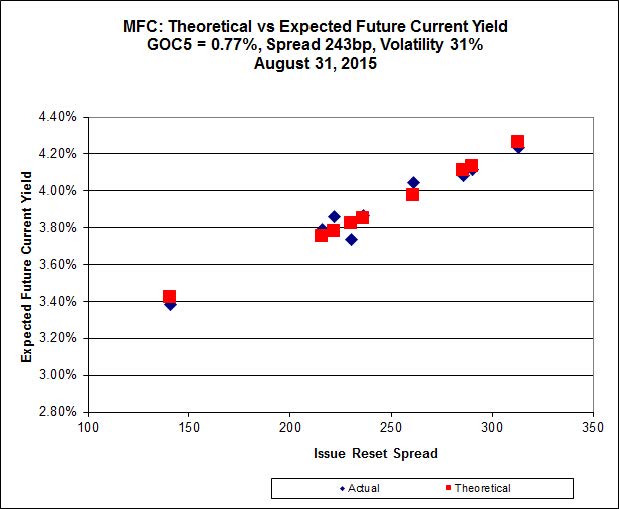
Another good fit today for MFC, with Implied Volatility dropping a bit again today.
Most expensive is MFC.PR.M, resetting at +236bp on 2019-12-19, bid at 20.85 to be 0.39 rich, while MFC.PR.J, resetting at +261bp on 2018-3-19, is bid at 21.00 to be 0.44 cheap.
 Click for Big
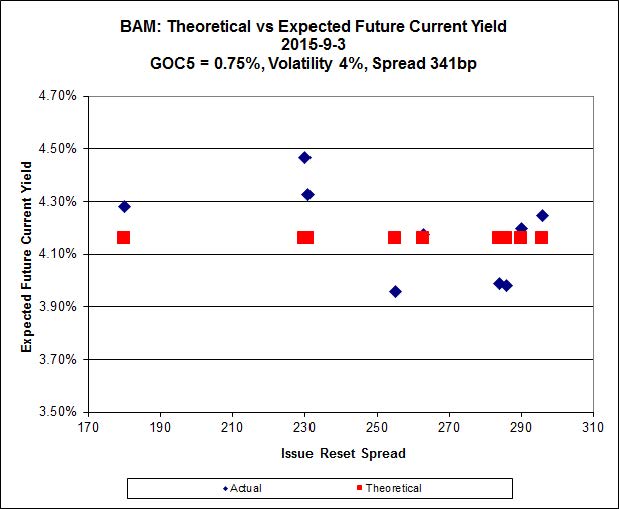
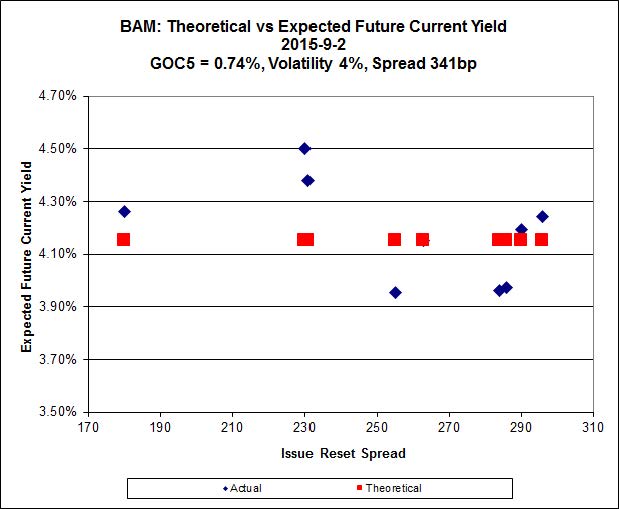
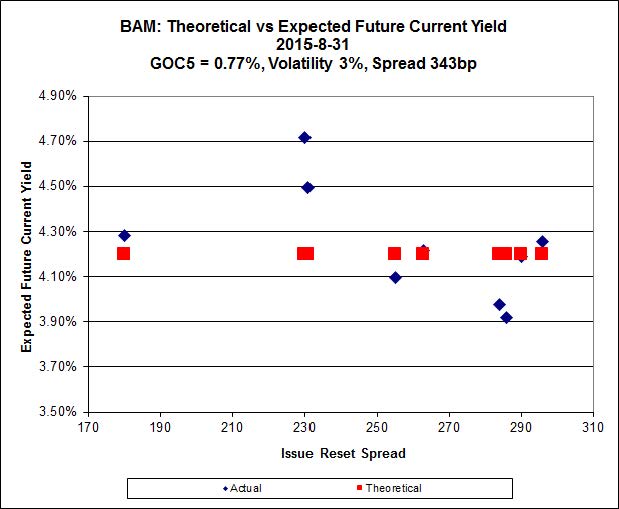
The fit on the BAM issues continues to be horrible.
The cheapest issue relative to its peers is BAM.PR.R, resetting at +230bp on 2016-6-30, bid at 16.51 to be $1.68 cheap. BAM.PF.G, resetting at +284bp on 2020-6-30 is bid at 22.60 and appears to be $1.15 rich.
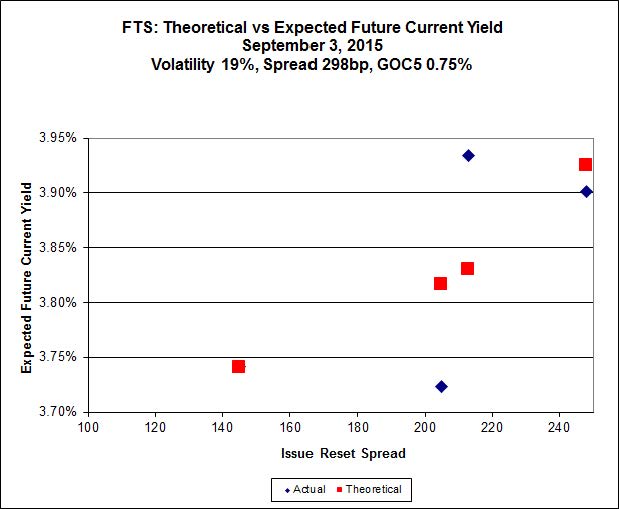
 Click for Big
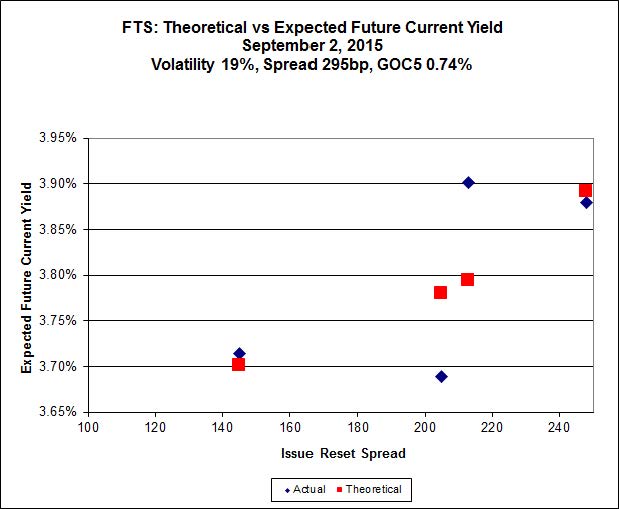
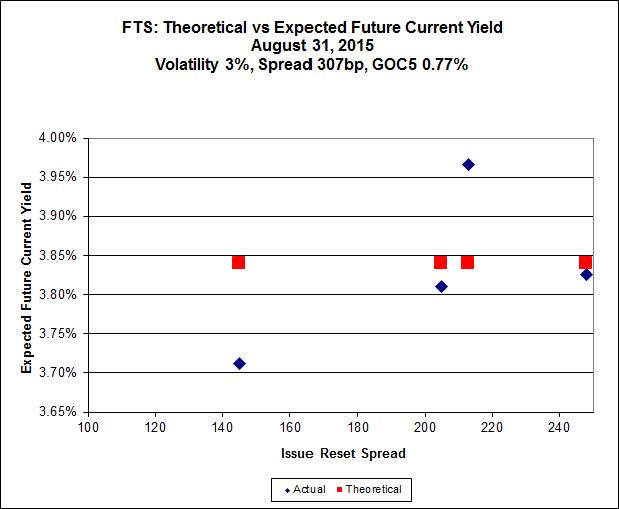
Implied Volatility reversed yesterday’s precipitous decline, illustrating the perils of relying too heavily on a four-point curve.
FTS.PR.M, with a spread of +248bp, and bid at 20.65, looks $0.26 expensive and resets 2019-12-1. FTS.PR.G, with a spread of +213bp and resetting 2018-9-1, is bid at 18.12 and is $0.60 cheap.
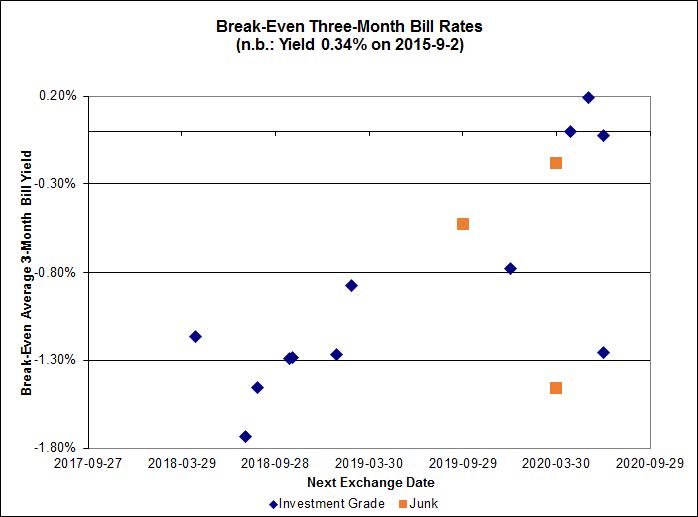
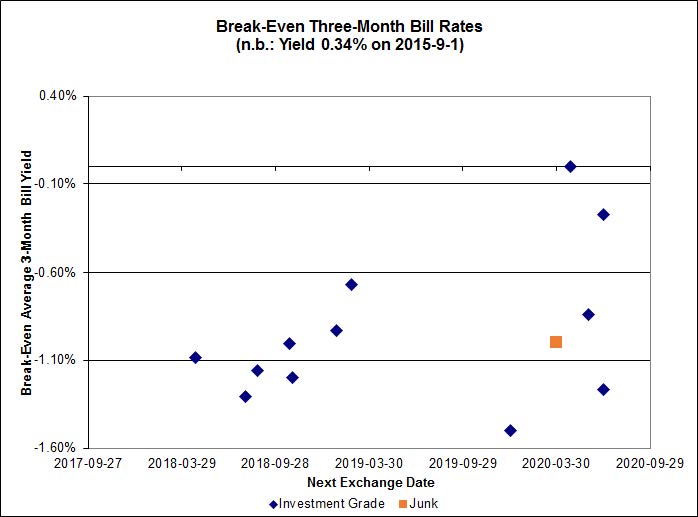
 Click for Big
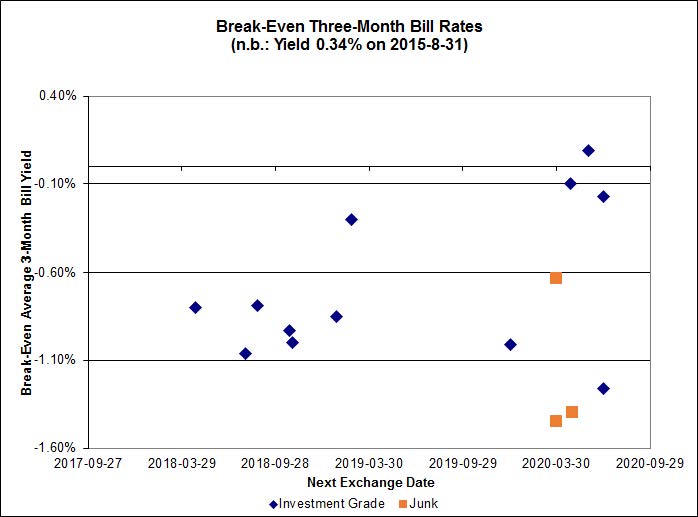
Investment-grade pairs predict an average three-month bill yield over the next five-odd years of -0.94%, with no outliers. Note that the distribution is bimodal (although less than recently), with NVCC non-compliant bank issues averaging -1.05% and the unregulated issues averaging -0.78%. There are four junk outliers below -1.60% and two above +0.40%.
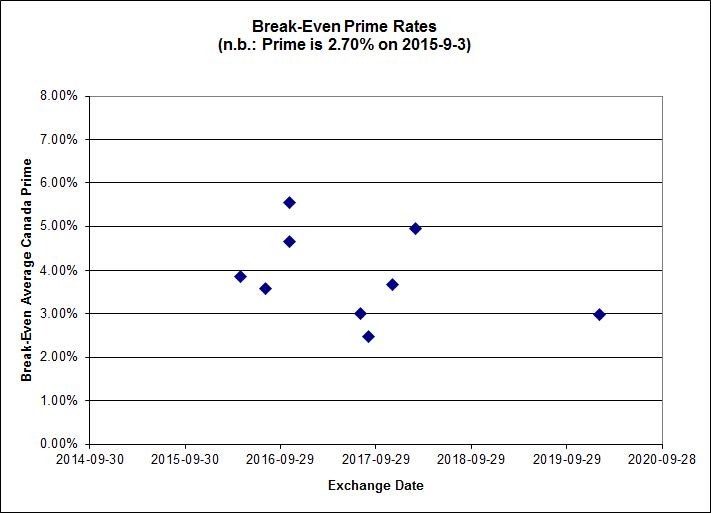
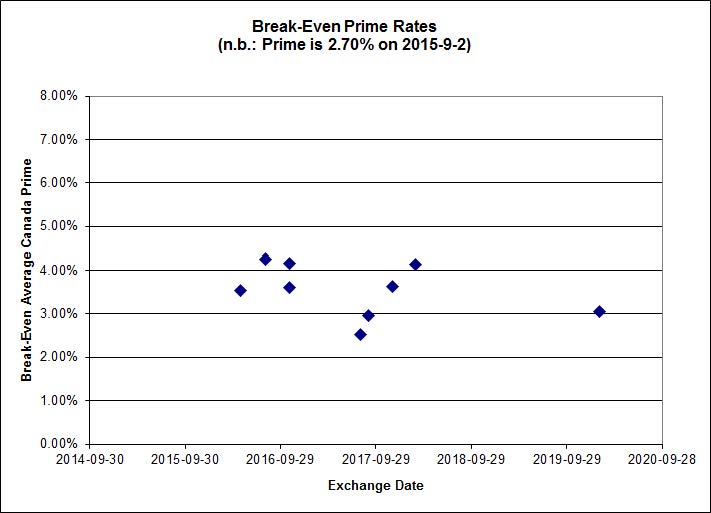
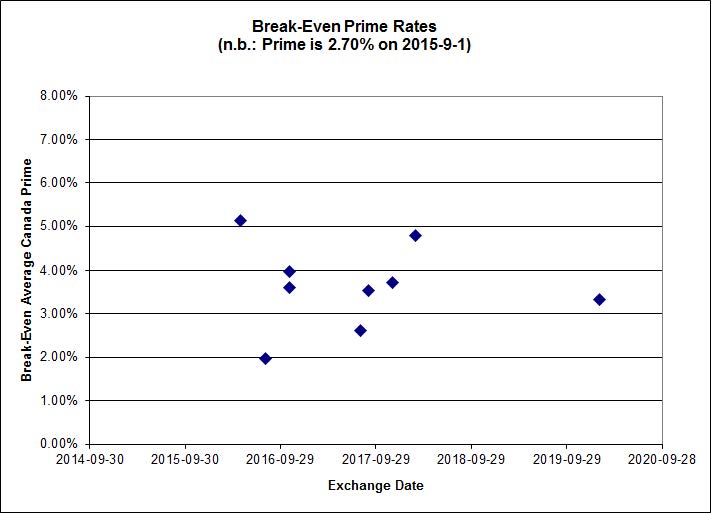
 Click for Big
Shall we just say that this exhibits a high level of confidence in the continued rapacity of Canadian banks?
HIMIPref™ Preferred Indices
These values reflect the December 2008 revision of the HIMIPref™ Indices
Values are provisional and are finalized monthly |
| Index |
Mean
Current
Yield
(at bid) |
Median
YTW |
Median
Average
Trading
Value |
Median
Mod Dur
(YTW) |
Issues |
Day’s Perf. |
Index Value |
| Ratchet |
0.00 % |
0.00 % |
0 |
0.00 |
0 |
-1.6976 % |
1,618.5 |
| FixedFloater |
0.00 % |
0.00 % |
0 |
0.00 |
0 |
-1.6976 % |
2,829.9 |
| Floater |
4.53 % |
4.60 % |
57,627 |
16.15 |
3 |
-1.6976 % |
1,720.6 |
| OpRet |
0.00 % |
0.00 % |
0 |
0.00 |
0 |
-0.3791 % |
2,764.4 |
| SplitShare |
4.66 % |
5.11 % |
60,978 |
3.11 |
3 |
-0.3791 % |
3,239.7 |
| Interest-Bearing |
0.00 % |
0.00 % |
0 |
0.00 |
0 |
-0.3791 % |
2,527.8 |
| Perpetual-Premium |
5.73 % |
5.53 % |
61,765 |
0.08 |
8 |
-0.0397 % |
2,485.6 |
| Perpetual-Discount |
5.49 % |
5.55 % |
76,999 |
14.56 |
30 |
0.1164 % |
2,573.6 |
| FixedReset |
4.76 % |
4.21 % |
180,656 |
16.09 |
74 |
-0.0607 % |
2,133.4 |
| Deemed-Retractible |
5.17 % |
5.29 % |
98,575 |
5.52 |
33 |
-0.0152 % |
2,570.7 |
| FloatingReset |
2.42 % |
3.58 % |
44,365 |
5.96 |
9 |
-0.4563 % |
2,181.7 |
| Performance Highlights |
| Issue |
Index |
Change |
Notes |
| HSE.PR.E |
FixedReset |
-3.41 % |
YTW SCENARIO
Maturity Type : Limit Maturity
Maturity Date : 2045-09-01
Maturity Price : 21.55
Evaluated at bid price : 21.55
Bid-YTW : 5.06 % |
| FTS.PR.M |
FixedReset |
-2.78 % |
YTW SCENARIO
Maturity Type : Limit Maturity
Maturity Date : 2045-09-01
Maturity Price : 20.65
Evaluated at bid price : 20.65
Bid-YTW : 4.14 % |
| BAM.PR.B |
Floater |
-2.78 % |
YTW SCENARIO
Maturity Type : Limit Maturity
Maturity Date : 2045-09-01
Maturity Price : 10.50
Evaluated at bid price : 10.50
Bid-YTW : 4.56 % |
| HSE.PR.C |
FixedReset |
-2.71 % |
YTW SCENARIO
Maturity Type : Limit Maturity
Maturity Date : 2045-09-01
Maturity Price : 20.45
Evaluated at bid price : 20.45
Bid-YTW : 4.92 % |
| TRP.PR.F |
FloatingReset |
-2.58 % |
YTW SCENARIO
Maturity Type : Limit Maturity
Maturity Date : 2045-09-01
Maturity Price : 13.98
Evaluated at bid price : 13.98
Bid-YTW : 4.03 % |
| BAM.PF.F |
FixedReset |
-2.33 % |
YTW SCENARIO
Maturity Type : Limit Maturity
Maturity Date : 2045-09-01
Maturity Price : 22.10
Evaluated at bid price : 22.61
Bid-YTW : 4.21 % |
| PWF.PR.P |
FixedReset |
-1.90 % |
YTW SCENARIO
Maturity Type : Limit Maturity
Maturity Date : 2045-09-01
Maturity Price : 15.47
Evaluated at bid price : 15.47
Bid-YTW : 3.85 % |
| BMO.PR.Q |
FixedReset |
-1.82 % |
YTW SCENARIO
Maturity Type : Hard Maturity
Maturity Date : 2022-01-31
Maturity Price : 25.00
Evaluated at bid price : 21.01
Bid-YTW : 5.18 % |
| BAM.PR.X |
FixedReset |
-1.60 % |
YTW SCENARIO
Maturity Type : Limit Maturity
Maturity Date : 2045-09-01
Maturity Price : 14.76
Evaluated at bid price : 14.76
Bid-YTW : 4.74 % |
| BAM.PF.A |
FixedReset |
-1.60 % |
YTW SCENARIO
Maturity Type : Limit Maturity
Maturity Date : 2045-09-01
Maturity Price : 21.27
Evaluated at bid price : 21.55
Bid-YTW : 4.43 % |
| BAM.PR.C |
Floater |
-1.51 % |
YTW SCENARIO
Maturity Type : Limit Maturity
Maturity Date : 2045-09-01
Maturity Price : 10.41
Evaluated at bid price : 10.41
Bid-YTW : 4.60 % |
| TRP.PR.G |
FixedReset |
-1.34 % |
YTW SCENARIO
Maturity Type : Limit Maturity
Maturity Date : 2045-09-01
Maturity Price : 21.31
Evaluated at bid price : 21.31
Bid-YTW : 4.39 % |
| ENB.PR.A |
Perpetual-Discount |
-1.15 % |
YTW SCENARIO
Maturity Type : Limit Maturity
Maturity Date : 2045-09-01
Maturity Price : 23.75
Evaluated at bid price : 24.06
Bid-YTW : 5.74 % |
| PVS.PR.D |
SplitShare |
-1.07 % |
YTW SCENARIO
Maturity Type : Hard Maturity
Maturity Date : 2021-10-08
Maturity Price : 25.00
Evaluated at bid price : 24.09
Bid-YTW : 5.22 % |
| GWO.PR.G |
Deemed-Retractible |
-1.05 % |
YTW SCENARIO
Maturity Type : Hard Maturity
Maturity Date : 2025-01-31
Maturity Price : 25.00
Evaluated at bid price : 23.50
Bid-YTW : 6.03 % |
| BMO.PR.R |
FloatingReset |
-1.05 % |
YTW SCENARIO
Maturity Type : Hard Maturity
Maturity Date : 2022-01-31
Maturity Price : 25.00
Evaluated at bid price : 22.71
Bid-YTW : 3.56 % |
| RY.PR.N |
Perpetual-Discount |
1.03 % |
YTW SCENARIO
Maturity Type : Limit Maturity
Maturity Date : 2045-09-01
Maturity Price : 24.27
Evaluated at bid price : 24.64
Bid-YTW : 5.06 % |
| MFC.PR.K |
FixedReset |
1.08 % |
YTW SCENARIO
Maturity Type : Hard Maturity
Maturity Date : 2025-01-31
Maturity Price : 25.00
Evaluated at bid price : 19.58
Bid-YTW : 6.36 % |
| BAM.PR.R |
FixedReset |
1.48 % |
YTW SCENARIO
Maturity Type : Limit Maturity
Maturity Date : 2045-09-01
Maturity Price : 16.51
Evaluated at bid price : 16.51
Bid-YTW : 4.84 % |
| MFC.PR.G |
FixedReset |
1.53 % |
YTW SCENARIO
Maturity Type : Hard Maturity
Maturity Date : 2025-01-31
Maturity Price : 25.00
Evaluated at bid price : 22.63
Bid-YTW : 5.01 % |
| PWF.PR.S |
Perpetual-Discount |
2.03 % |
YTW SCENARIO
Maturity Type : Limit Maturity
Maturity Date : 2045-09-01
Maturity Price : 22.25
Evaluated at bid price : 22.61
Bid-YTW : 5.35 % |
| IFC.PR.C |
FixedReset |
2.33 % |
YTW SCENARIO
Maturity Type : Hard Maturity
Maturity Date : 2025-01-31
Maturity Price : 25.00
Evaluated at bid price : 20.62
Bid-YTW : 6.08 % |
| BAM.PF.E |
FixedReset |
2.37 % |
YTW SCENARIO
Maturity Type : Limit Maturity
Maturity Date : 2045-09-01
Maturity Price : 20.75
Evaluated at bid price : 20.75
Bid-YTW : 4.37 % |
| MFC.PR.M |
FixedReset |
2.96 % |
YTW SCENARIO
Maturity Type : Hard Maturity
Maturity Date : 2025-01-31
Maturity Price : 25.00
Evaluated at bid price : 20.85
Bid-YTW : 5.81 % |
| PWF.PR.L |
Perpetual-Discount |
2.97 % |
YTW SCENARIO
Maturity Type : Limit Maturity
Maturity Date : 2045-09-01
Maturity Price : 23.30
Evaluated at bid price : 23.56
Bid-YTW : 5.46 % |
| Volume Highlights |
| Issue |
Index |
Shares
Traded |
Notes |
| TD.PR.T |
FloatingReset |
90,200 |
Nesbitt crossed 70,000 at 22.80.
YTW SCENARIO
Maturity Type : Hard Maturity
Maturity Date : 2022-01-31
Maturity Price : 25.00
Evaluated at bid price : 22.62
Bid-YTW : 3.58 % |
| PWF.PR.I |
Perpetual-Premium |
30,100 |
TD crossed two blocks of 15,000 each, both at 25.25.
YTW SCENARIO
Maturity Type : Call
Maturity Date : 2015-10-01
Maturity Price : 25.00
Evaluated at bid price : 25.25
Bid-YTW : 0.22 % |
| BAM.PF.C |
Perpetual-Discount |
21,299 |
YTW SCENARIO
Maturity Type : Limit Maturity
Maturity Date : 2045-09-01
Maturity Price : 20.71
Evaluated at bid price : 20.71
Bid-YTW : 5.97 % |
| PVS.PR.D |
SplitShare |
18,810 |
Scotia crossed 10,000 at 24.33.
YTW SCENARIO
Maturity Type : Hard Maturity
Maturity Date : 2021-10-08
Maturity Price : 25.00
Evaluated at bid price : 24.09
Bid-YTW : 5.22 % |
| TD.PF.A |
FixedReset |
18,175 |
TD crossed 11,500 at 21.45.
YTW SCENARIO
Maturity Type : Limit Maturity
Maturity Date : 2045-09-01
Maturity Price : 21.44
Evaluated at bid price : 21.44
Bid-YTW : 3.72 % |
| BMO.PR.T |
FixedReset |
17,120 |
YTW SCENARIO
Maturity Type : Limit Maturity
Maturity Date : 2045-09-01
Maturity Price : 21.50
Evaluated at bid price : 21.50
Bid-YTW : 3.68 % |
| There were 11 other index-included issues trading in excess of 10,000 shares. |
| Wide Spread Highlights |
| Issue |
Index |
Quote Data and Yield Notes |
| BIP.PR.A |
FixedReset |
Quote: 21.50 – 25.00
Spot Rate : 3.5000
Average : 1.8989
YTW SCENARIO
Maturity Type : Limit Maturity
Maturity Date : 2045-09-01
Maturity Price : 21.50
Evaluated at bid price : 21.50
Bid-YTW : 5.06 % |
| TRP.PR.F |
FloatingReset |
Quote: 13.98 – 15.00
Spot Rate : 1.0200
Average : 0.7095
YTW SCENARIO
Maturity Type : Limit Maturity
Maturity Date : 2045-09-01
Maturity Price : 13.98
Evaluated at bid price : 13.98
Bid-YTW : 4.03 % |
| HSE.PR.E |
FixedReset |
Quote: 21.55 – 22.50
Spot Rate : 0.9500
Average : 0.6500
YTW SCENARIO
Maturity Type : Limit Maturity
Maturity Date : 2045-09-01
Maturity Price : 21.55
Evaluated at bid price : 21.55
Bid-YTW : 5.06 % |
| IFC.PR.A |
FixedReset |
Quote: 16.83 – 17.55
Spot Rate : 0.7200
Average : 0.4259
YTW SCENARIO
Maturity Type : Hard Maturity
Maturity Date : 2025-01-31
Maturity Price : 25.00
Evaluated at bid price : 16.83
Bid-YTW : 8.22 % |
| PWF.PR.S |
Perpetual-Discount |
Quote: 22.61 – 23.48
Spot Rate : 0.8700
Average : 0.6252
YTW SCENARIO
Maturity Type : Limit Maturity
Maturity Date : 2045-09-01
Maturity Price : 22.25
Evaluated at bid price : 22.61
Bid-YTW : 5.35 % |
| FTS.PR.J |
Perpetual-Discount |
Quote: 21.82 – 22.90
Spot Rate : 1.0800
Average : 0.8775
YTW SCENARIO
Maturity Type : Limit Maturity
Maturity Date : 2045-09-01
Maturity Price : 21.48
Evaluated at bid price : 21.82
Bid-YTW : 5.46 % |