Assiduous Reader prefman alerted me in the comments to the post “DC.PR.C: Coercive Exchange Offer” that the Notice of Special Meeting of Holders of First Preference Shares, Series 4 of Dundee Corporation to be held on January 7, 2016 and Management Information Circular has been published on Dundee’s website.
Update, 2015-12-16: The company announced the mailing of the information circular and published some FAQs on December 10.
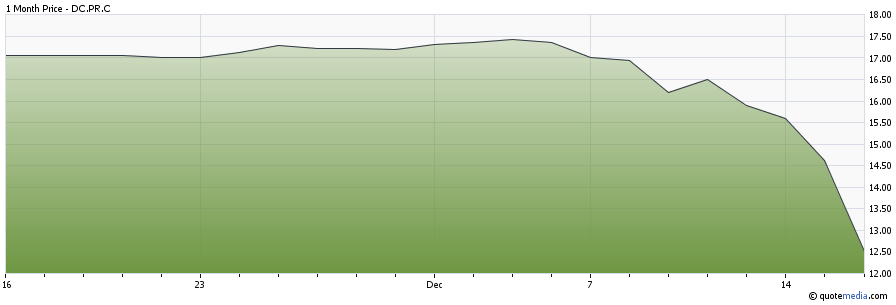
Simultaneously, the market has shown distinct distasted for the plan by giving the issue a good thumping: it closed today at 14.62 with a VWAP of 14.75, which compares to par value of 17.84. The performance of the issue since the November 24 announcement and the Globe story on December 4 doesn’t look very good!
 Click for Big
One thing that is made clear in the Information Circular is that widespread dissent can be fatal to the plan:
Completion of the Arrangement is conditional on the occurrence of the following, each of which may be waived
by the Company to the extent permitted under applicable law:
- • Approval of the Arrangement Resolution. The Arrangement Resolution is approved by not less than two-thirds (662/3%) of the votes cast by the holders of Series 4 Preferred Shares who vote in respect of the Arrangement Resolution in person or by proxy at the Meeting;
- • Interim Order and Final Order. The Interim Order and the Final Order shall have each been obtained on terms acceptable to the Company, and shall not have been set aside or modified in a manner unacceptable to the Company;
- • TSX Approval. The approval of the TSX (including the approval of the TSX for the listing and posting for trading of the Series 5 Preferred Shares to be issued pursuant to the Arrangement on the TSX) is obtained on terms acceptable to the Company;
- • Dissent Rights. Dissent Rights shall not have been validly exercised and not withdrawn with respect to more than 10% of the issued and outstanding Series 4 Preferred Shares;
- • Legality. No applicable law, constitution, treaty, convention, ordinance, code, rule, regulation, order, injunction, judgement, decree ruling or other similar requirement shall be in effect that makes the consummation of the Arrangement illegal or otherwise prohibits or enjoins the Company from consummating the Arrangement; and
- • Board of Directors of the Company. The Board of Directors not having determined not to proceed with the Arrangement.
So while a “no” vote of just over one-third is required to defeat the plan, a “dissent” of just over 10% is sufficient to defeat it.
The company maintains its cheerful outlook:
The Company has received substantial support for the Arrangement based on confidential consultations with representatives of significant holders of the Series 4 Preferred Shares.
… but the meaning of the phrase “substantial support” is rendered dubious by the price action of the issue since the announcement, the fact that the company is including a very substantial payment to advisors who are able to obtain favourable votes, and the fact that the company is not allowing holders to get out on the original terms. Assiduous Readers of PrefBlog will know that such an offer is de rigueur when Split Share Corporations extend term (see, for example, the “Special Retraction Rights” offered on the past FTN.PR.A term extension) and that I get very upset when a Special Retraction is not part of the deal.
Dissent rights may be exercised as follows (emphasis in original removed):
A Beneficial Shareholder who wishes to exercise Dissent Rights should immediately contact the Intermediary with whom the Beneficial Shareholder deals in respect of its Series 4 Preferred Shares and either: (i) instruct the Intermediary to exercise the Dissent Rights on the Beneficial Shareholder’s behalf (which, if the Series 4 Preferred Shares are registered in the name of CDS or other clearing agency, may require that such Series 4 Preferred Shares first be re-registered in the name of the Intermediary), or (ii) instruct the Intermediary to re-register such Series 4 Preferred Shares in the name of the Beneficial Shareholder, in which case the Beneficial Shareholder would be able to exercise the Dissent Rights directly.
A Registered Series 4 Preferred Shareholder who wishes to dissent must provide a written notice of dissent (the “Dissent Notice”) to the Company at 1 Adelaide St. East, Suite 2100, Toronto, Ontario, Canada, M5C 2V9, Attention: Lili Mance, to be received not later than 9:00 a.m. (Toronto time) on January 5, 2016 (or, in the case of any adjournment or postponement of the Meeting, not less than 48 hours (excluding Saturdays, Sundays and holidays) prior to the time of such adjourned or postponed meeting). Failure to properly exercise Dissent Rights may result in the loss or unavailability of the right to dissent.
The filing of a Dissent Notice does not deprive a Registered Series 4 Preferred Shareholder of the right to vote
at the Meeting.
Once dissent has been exercised, we get into the whole back and forth ritual that is such a complete waste of time and money for all concerned:
Within ten days after the holders of Series 4 Preferred Shares adopt the Arrangement Resolution, the Company is required to notify each Dissenting Shareholder that the Arrangement Resolution has been adopted. Such notice is not required to be sent to any holder of Series 4 Preferred Shares who voted FOR the Arrangement
Resolution or who has withdrawn its Dissent Notice.
A Dissenting Shareholder who has not withdrawn its Dissent Notice prior to the Meeting must then, within twenty days after receipt of notice that the Arrangement Resolution has been adopted, or if the Dissenting Shareholder does not receive such notice, within twenty days after learning that the Arrangement Resolution has been adopted, send to the Company, care of the Company’s transfer agent, Computershare Investor Services Inc. (the “Transfer Agent”) at its Toronto office located at 100 University Avenue, 8th Floor, Toronto, Ontario, Canada, M5J 2Y1, a written notice containing his or her name and address, the number of Series 4 Preferred Shares in respect of which it, he or she dissents (the “Dissenting Shares”), and a demand for payment of the fair value of such Series 4 Preferred Shares (the “Demand for Payment”). Within thirty days after sending a Demand for Payment, the Dissenting Shareholder must send to the Company, care of the Transfer Agent, certificates representing the Series 4 Preferred Shares in respect of which he or she dissents.
The Company will or will cause the Transfer Agent to endorse on the applicable Series 4 Preferred Share certificates received from a Dissenting Shareholder a notice that the holder is a Dissenting Shareholder and will forthwith return such Series 4 Preferred Share certificates to the Dissenting Shareholder.
Failure to strictly comply with the requirements set forth in section 185 of the OBCA, as modified by the Plan of Arrangement and Interim Order, may result in the loss of any right to dissent.
One of the many things about the Way We Do Business In Canada that appalls me is the fact that notices such as this continue to babble about certificates. Why does this bother me? Well, let’s look at the original prospectus, available on SEDAR, a public document to which I am not entitled to link because the regulators have no intention or interest in furthering the interests of investor-taxpayer scum. You will have to search for “Dundee Corporation Jun 21 2006 14:01:56 ET Final short form prospectus – English -PDF 336 K”. It will be recalled that this issue was issued as DBC.PR.A; the symbol changed to DC.PR.A, and then DC.PR.C was issued as partial consideration for DC.PR.A. As stated in the original prospectus:
BOOK-BASED SYSTEM
Registration of interests in and transfers of the Series 1 Shares will only be made through the book-based system administered by CDS. On or about the date of closing of this offering, the Corporation will deliver to CDS a certificate evidencing the aggregate number of Series 1 Shares subscribed for under this offering. Series 1 Shares must be purchased, transferred and surrendered for redemption, conversion or retraction through a participant in CDS (a ‘‘CDS Participant’’). All rights of an owner of Series 1 Shares must be exercised through, and all payments or other property to which such owner is entitled will be made or delivered by, CDS or the CDS Participant through which the owner holds Series 1 Shares. Upon a purchase of any Series 1 Shares, the owner will receive only the customary confirmation. References in this short form prospectus to a holder of Series 1 Shares mean, unless the context otherwise requires, the owner of the beneficial interest in such shares.
The ability of a beneficial owner of Series 1 Shares to pledge such shares or otherwise take action with respect to such owner’s interest in such shares (other than through a CDS Participant) may be limited due to the lack of a physical certificate.
The Corporation has the option to terminate registration of the Series 1 Shares through the book-based system, in which event certificates for Series 1 Shares in fully registered form will be issued to the beneficial owners of such shares or their nominees.
When we prudently check the Management Information Circular for the conversion to DC.PR.C [SEDAR, Dundee Corporation Apr 18 2013 16:57:07 ET Management information circular – English PDF 7227 K], we find:
As soon as practicable following the Effective Time, the global certificate formerly representing the Dundee Series 1 Preference Shares registered in the name of CDS will be withdrawn from CDS and replaced with a global certificate representing the Dundee New Series 4 Preference Shares and a global certificate representing the DREAM Series 1 Preference Shares.
So … ain’t no certificates. The politicians can’t be bothered to make a minor change in the law to acknowledge the existence of the 21st century, and the regulators can’t be bothered to make sure that circulars of this type have any degree of relationship to reality. It’s nice work, if you can get it.
So, basically, read the information circular carefully, tell your custodial broker what you want to do, and keep written records of all conversations.
So what happens then?
The Company is required, not later than seven days after the later of the Effective Date or the date on which a Demand for Payment is received from a Dissenting Shareholder, to send to each Dissenting Shareholder who has sent a Demand for Payment an Offer to Pay for its Dissenting Shares in an amount considered by the Board of Directors to be the fair value of the Series 4 Preferred Shares, accompanied by a statement showing the manner in which the fair value was determined. Every Offer to Pay for Series 4 Preferred Shares must be on the same terms. The Company must, subject to applicable law, pay for the Dissenting Shares of a Dissenting Shareholder within ten days after an Offer to Pay has been accepted by a Dissenting Shareholder, but any such offer lapses if the Company does not receive an acceptance within thirty days after the Offer to Pay has been made.
If the Company fails to make an Offer to Pay for Dissenting Shares, or if a Dissenting Shareholder fails to accept an Offer to Pay that has been made, the Company may, within fifty days after the Effective Date or within such further period as a court may allow, apply to a court to fix a fair value for the Dissenting Shares. If the Company fails to apply to a court, a Dissenting Shareholder may apply to a court for the same purpose within a further period of twenty days or within such further period as a court may allow. A Dissenting Shareholder is not required to give security for costs in such an application.
If the Company or a Dissenting Shareholder makes an application to court, the Company will be required to notify each affected Dissenting Shareholder of the date, place and consequences of the application and of its right to appear and be heard in person or by counsel. Upon an application to a court, all Dissenting Shareholders who have not accepted an Offer to Pay will be joined as parties and be bound by the decision of the court. Upon any such application to a court, the court may determine whether any person is a Dissenting Shareholder who should be joined as a party, and the court would then be expected to fix a fair value for the Dissenting Shares of all Dissenting Shareholders. The final order of a court would be expected to be rendered against the Company in favour of each Dissenting Shareholder for the amount of the fair value of its Dissenting Shares as fixed by the court. The court may, in its discretion, allow a reasonable rate of interest on the amount
payable to each Dissenting Shareholder from the Effective Date until the date of payment.
So, if there’s no agreement on what constitutes fair value, it will go to court. In many cases, as I understand it, the court will decide that Fair Value is what everybody else took, which [since it got this far in the first place] will be the new, extended-term shares. However, a good argument could be made that Fair Value is represented by the original deal: you either get your $17.64 in June, 2016, or you get discounted DC.A Subordinate Voting Shares in lieu, if the company would rather pay you that way.
It’s a tangled web and one that is not without risk – by dissenting, a holder is giving up the Consent Payment, for instance, which is one reason why the company is abusing its investors by making the consent payment so high. There may be costs associated with the court case, if the company makes a derisory “Fair Value” offer. On the other hand, the market is clearly showing its distaste for the plan by marking down the market value of DC.PR.C and the current highlighting of junk bond liquidity woes may make institutional holders more diligent in their protection of their investors’ interests.
I make no recommendation; I do investment analysis, not investment law! However, from an investment perspective, I suggest that the dissenting route is worthy of consideration.