A tiny bit of sanity accidentally crept into the Basel III derivatives rules:
The Basel Committee on Banking Supervision, which set out a year ago to block banks from relying too heavily on each other, changed course last week, opting to let firms preserve most derivatives and repurchase agreements among themselves. The panel revised formulas for evaluating exposure and used a broader definition of capital. Those tweaks spare about $1 trillion in deals at seven of the biggest U.S. banks that would have exceeded proposed limits, according to a November study by the Clearing House, an industry group.
…
In March 2013, the Basel committee proposed a new way of calculating how much money banks stood to lose on their derivatives deals. While the panel set a ceiling for total exposure to any one party, including nonfinancial firms, at 25 percent of a bank’s capital, 29 institutions deemed systemically important faced a tighter threshold of 10 percent to 15 percent for dealings with each other.The Clearing House, representing 21 of the largest commercial banks in North America and Europe, released estimates after Basel’s proposal, showing how much seven of the largest banks would collectively exceed exposure limits. The study included scenarios showing the rule’s impact if changes were made to satisfy different objections.
…
The Basel committee’s most significant changes to the proposed methodology last week affected how derivatives and repo exposures are calculated. It picked 15 percent as the limit for systemic banks instead of 10 percent. The panel also chose Tier 1 capital, which includes preferred securities, instead of only common equity as the base for calculating the exposure ratio.On the derivatives side, the proposed methodology would have forced banks to report a sixfold increase in the risks they calculate under their internal models, the Clearing House estimated. The final rule only doubles those figures.
The committee also modified a proposal that would have forced banks to add in their exposure to the issuer of a bond used as collateral in a derivatives trade. If a bank buys a credit-default swap from a hedge fund that posts Italian sovereign bonds as collateral, the bank would be exposed both to the Italian government and the fund. That requirement was eliminated in the final rule unless the collateral is issued by another bank or financial institution.
Well, that last bit is just wrong; if a hedge fund posts Italian sovereigns as collateral, the sovereign exposure only kicks in if the hedge fund defaults. Now, there is certainly an amount of correlation between the two – the hedge fund could be taken down by its Italian exposure – that that correlation is certainly less than 100%.
There’s more news about NY Attorney-General Schneiderman’s crusade against the 21st century – he’s upset with AirBnB:
In an effort to jam the wheels of Airbnb’s juggernaut, Mr. Schneiderman subpoenaed the company in October to hand over data concerning some 15,000 New Yorkers who have advertised rooms on the website’s booking service. The attorney-general isn’t, apparently, chasing legitimate householders offering up a spare room, but those who are violating state laws by renting out multiple rooms in the manner of a hotel or even a brothel.
Or even a Satanic slaughterhouse run by pedophiles, eh, Schneiderman? It’s all for the public good, all for consumer protection … right? Wrong. It’s all box-ticking:
Nearly two-thirds of New York city apartments recently listed on Airbnb were illegal sublets, according to an affidavit from the state Attorney General’s office, the newspaper said.
The affidavit, which is expected to be filed in court on Monday by the AG’s office, shows 64 percent of Airbnb’s 19,500-plus offerings for January 31 cover an “entire apartment,” the NY Post said. (r.reuters.com/sun68v)
More than 200 of the offerings came from just five “hosts,” suggesting third parties were renting out pads on behalf of their owners, the newspaper said.
Schneiderman opened an investigation last year into whether hosts on Airbnb, a Silicon Valley venture capital-backed website that lets people put up spare rooms or couches for rent, are breaking a 2010 law that prohibits renters from subletting their room for less than 30 days.
I often point out that the whole HFT kerfuffle is due to the old-boys having their lunch eaten by the geeky outsiders; I should point out that it is not just the old-boys who prefer to compete by regulation. Very often, it is the new kids on the block who prefer to compete on grounds other than price and performance:
But let me tell you, trailing commissions make previous battles look like minor skirmishes. The industry has drawn a line in the sand and brought out the heavy artillery. With few exceptions, the fund companies, dealers and banks have formed a united front and nobody is stepping out of line. The message is clear – banning embedded commissions will destroy the industry and make it difficult for small investors to get advice. The status quo should be maintained. In other words, “Just let us charge most of our clients too much (unknowingly) so we can subsidize the small clients (thank you, thank you, thank you).”
Yeah, yeah. Your business practices are the only moral ones – in fact, they define morality – and competition should be illegal. Next!
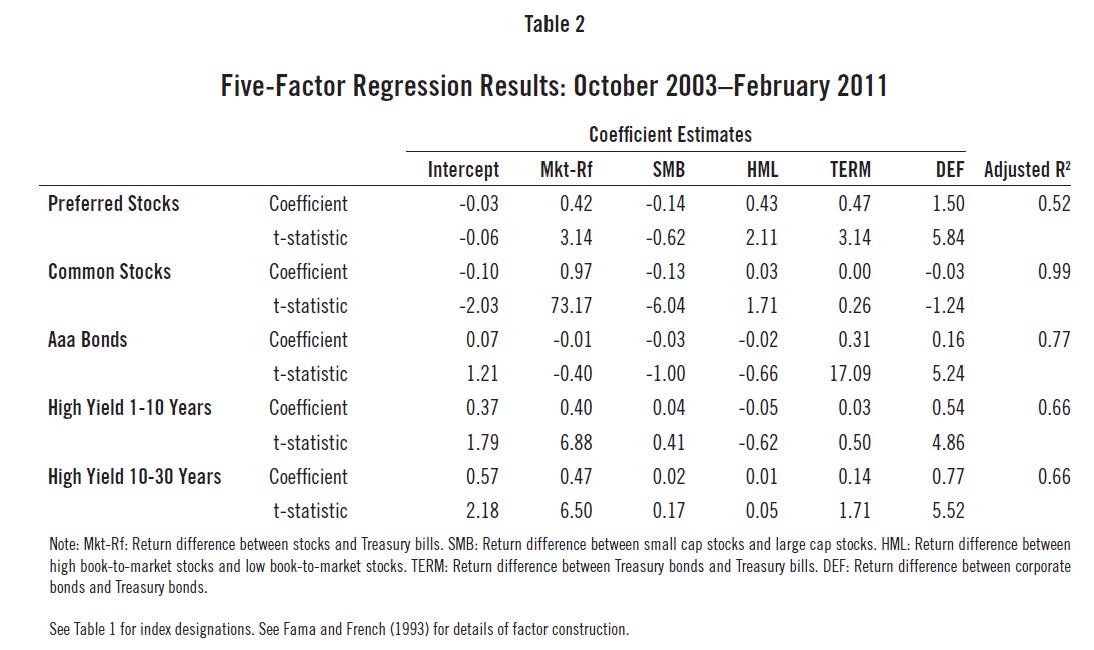
I recently became aware of a piece by Larry Swedroe titled Why you should avoid preferred stocks. It’s not very interesting – the usual qualitative bad points are compared to the usual qualitative good points, and a quantitative decision appears by magic – but it did have one interesting feature:
Of even greater concern is that a five-factor regression shows that not only do preferred shares have significant exposure to equity risk (0.42 loading on the market factor) and significant exposure to value stocks (0.43 loading), but much greater exposure to default risk than high-yield bonds. The loading on default for preferred stocks was 1.5, as compared to the default loading for 1-10 year high-yield bonds of 0.54 and for 10-30 year high-yield bonds of 0.77. (All the figures are statistically significant.) In other words, preferred stocks had about three times the exposure to default risk as 1-10 year high-yield bonds and about twice that of 10-30 year high-yield bonds.
A five-factor regression? Interesting. Mr. Google finds a reference to a paper by Eugene F. Fama and Kenneth R. French titled Common risk factors in the returns on stocks and bonds:
For corporate bonds. shifts in economic conditions that change the likelihood
of default give rise to another common factor in returns. Our proxy for this default factor, DEF, is the difference between the return on a market portfolio of long-term corporate bonds (the Composite portfolio on the corporate bond module of Ibbotson Associates) and the long-term government bond return.
So right away, I’m suspicious. Although comparing returns on long-term corporates vs. long-term governments is reasonable enough in terms of return analysis, it is not particularly focussed on default risk; spreads between the two in terms of yield – and hence on returns, when looking backward – are more of a liquidity indicator than a default-risk indicator.
The factors were used in a piece by James L. Davis of Dimensional Fund Advisors titled Investment Characteristics of Preferred Stock to decompose returns in the American market as:
Click for Big
So – assuming this was Mr. Swedroe’s source – one declared result is that preferred stock returns are relatively uncorrelated with the five magic factors. A lack of correlation is supposed to be good in Modern Portfolio Theory, isn’t it?
It’s an interesting approach and I’ll think about it, but the problem with this kind of ‘Look-Mummy-I-Gotta-Spreadsheet’ investment analysis is that correlations are extremely dependent upon the time period chosen and the sampling frequency. Not only is any given sample period not necessarily representative of any future sample period – which is a standard criticism of virtually any quantitative work – but there is not a jot of evidence presented that these factors are stable even when subjected to small changes in period. I’ll think about this … it might be worth an article.
It was a good day for the Canadian preferred share market, with PerpetualDiscounts winning 19bp, FixedResets up 9bp and DeemedRetractibles gaining 6bp. Volatility was non-existent, even technically, for the second day running, which might even be a record. Volume was extremely low.
| HIMIPref™ Preferred Indices These values reflect the December 2008 revision of the HIMIPref™ Indices Values are provisional and are finalized monthly |
|||||||
| Index | Mean Current Yield (at bid) |
Median YTW |
Median Average Trading Value |
Median Mod Dur (YTW) |
Issues | Day’s Perf. | Index Value |
| Ratchet | 0.00 % | 0.00 % | 0 | 0.00 | 0 | 0.3341 % | 2,407.1 |
| FixedFloater | 4.67 % | 3.90 % | 32,927 | 17.71 | 1 | 0.4938 % | 3,678.1 |
| Floater | 3.03 % | 3.16 % | 49,836 | 19.32 | 4 | 0.3341 % | 2,599.0 |
| OpRet | 4.36 % | -3.90 % | 37,618 | 0.11 | 2 | 0.0582 % | 2,694.2 |
| SplitShare | 4.80 % | 4.29 % | 63,509 | 4.22 | 5 | 0.0715 % | 3,090.1 |
| Interest-Bearing | 0.00 % | 0.00 % | 0 | 0.00 | 0 | 0.0582 % | 2,463.6 |
| Perpetual-Premium | 5.54 % | -6.77 % | 107,295 | 0.09 | 13 | 0.1559 % | 2,390.5 |
| Perpetual-Discount | 5.40 % | 5.35 % | 110,594 | 14.62 | 23 | 0.1923 % | 2,495.8 |
| FixedReset | 4.68 % | 3.61 % | 191,760 | 4.17 | 79 | 0.0913 % | 2,535.2 |
| Deemed-Retractible | 5.03 % | -0.78 % | 146,637 | 0.15 | 42 | 0.0556 % | 2,496.0 |
| FloatingReset | 2.66 % | 2.45 % | 174,323 | 4.24 | 5 | -0.0159 % | 2,481.2 |
| Performance Highlights | |||
| Issue | Index | Change | Notes |
| No individual gains or losses exceeding 1%! | |||
| Volume Highlights | |||
| Issue | Index | Shares Traded |
Notes |
| RY.PR.Z | FixedReset | 166,615 | National bought 10,000 from TD at 25.54. RBC crossed blocks of 50,000 and 49,200, both at 25.54. Scotia crossed 10,900 at 25.54. YTW SCENARIO Maturity Type : Call Maturity Date : 2019-05-24 Maturity Price : 25.00 Evaluated at bid price : 25.52 Bid-YTW : 3.49 % |
| TD.PR.E | FixedReset | 33,452 | Called for redemption. YTW SCENARIO Maturity Type : Call Maturity Date : 2014-05-30 Maturity Price : 25.00 Evaluated at bid price : 24.99 Bid-YTW : 5.38 % |
| BNS.PR.Z | FixedReset | 19,904 | YTW SCENARIO Maturity Type : Hard Maturity Maturity Date : 2022-01-31 Maturity Price : 25.00 Evaluated at bid price : 24.34 Bid-YTW : 3.61 % |
| RY.PR.F | Deemed-Retractible | 19,215 | YTW SCENARIO Maturity Type : Call Maturity Date : 2014-05-24 Maturity Price : 25.50 Evaluated at bid price : 25.69 Bid-YTW : -8.30 % |
| RY.PR.I | FixedReset | 17,089 | TD crossed 10,000 at 25.58. YTW SCENARIO Maturity Type : Call Maturity Date : 2019-02-24 Maturity Price : 25.00 Evaluated at bid price : 25.52 Bid-YTW : 3.00 % |
| BAM.PR.M | Perpetual-Discount | 17,015 | Nesbitt crossed 14,300 at 20.80. YTW SCENARIO Maturity Type : Limit Maturity Maturity Date : 2044-04-22 Maturity Price : 20.81 Evaluated at bid price : 20.81 Bid-YTW : 5.77 % |
| There were 16 other index-included issues trading in excess of 10,000 shares. | |||
| Wide Spread Highlights | ||
| Issue | Index | Quote Data and Yield Notes |
| IFC.PR.A | FixedReset | Quote: 24.06 – 24.48 Spot Rate : 0.4200 Average : 0.2723 YTW SCENARIO |
| RY.PR.C | Deemed-Retractible | Quote: 25.51 – 25.78 Spot Rate : 0.2700 Average : 0.1641 YTW SCENARIO |
| GWO.PR.N | FixedReset | Quote: 22.33 – 22.65 Spot Rate : 0.3200 Average : 0.2435 YTW SCENARIO |
| TRP.PR.C | FixedReset | Quote: 22.35 – 22.67 Spot Rate : 0.3200 Average : 0.2448 YTW SCENARIO |
| HSE.PR.A | FixedReset | Quote: 22.90 – 23.09 Spot Rate : 0.1900 Average : 0.1253 YTW SCENARIO |
| IAG.PR.A | Deemed-Retractible | Quote: 22.43 – 22.70 Spot Rate : 0.2700 Average : 0.2090 YTW SCENARIO |