Canadians are loading up on debt:
Canadians have taken on $80-billion worth of mortgages, personal loans and credit card debt in the past year, Royal Bank of Canada found, with much of that growth coming in the past three months. Household debt totalled $1.82-trillion in January, eclipsing the country’s GDP, which stood at an annualized $1.65-trillion in December.
Most of the growth came from new residential mortgages, which rose 5.4 per cent in January compared to a year earlier, to nearly $1.3-trillion.
…
Homeowners weren’t the only ones taking on new debt. Business credit jumped 8.3 per cent in January, the fastest rate of expansion since 2007 as worries over the oil sector pushed more companies toward short-term loans, RBC said.
With all that, it’s a good thing we’ve all got good jobs!
Several reports have concluded that the country’s job market is not as strong as it looks and now a study from Canadian Imperial Bank of Commerce paints an even worse picture. According to the bank’s analysis, job quality has fallen to its lowest level in more than two decades. A CIBC index that measures 25 years worth of data on part-time versus full-time work, paid versus self-employment and compensation trends, has fallen to its lowest level on record.
…
One notable shift is that a smaller portion of the labour market now has higher bargaining power, or high-paying jobs, while a larger segment has lower bargaining power, [Benjamin Tal, CIBC’s deputy chief economist,] said. “This is the main reason why the income gap is rising, which I believe is the number one economic, social issue facing the country in this decade.”The CIBC index tracks three components, all of which are showing a deterioration. The first indicated that the number of part-time positions has risen “much faster” than that of full-time jobs since the 1980s. (Over the past year, though, some of this has reversed as full-time jobs rose faster). Self-employment is another measure, as economists tend to view it as less stable and, on average, lower paying than salaried employment. The number of self-employed workers has been on a “steeper incline” over the past 25 years, and in the past year grew four times faster than the number of paid employees, the CIBC report said.
On compensation, the bank said low-paying full-time jobs have risen faster than mid-paying jobs over much of the past two decades, which in turn have risen more quickly than high-paying jobs. And in the past year “the job-creation gap between low- and high-paying jobs has widened,” with low-wage full-time paid positions rising at twice the pace of high-paying jobs.
Mark Cuban may not be the most academic of sources, but he probably knows more than I do about the problems of angel investors:
For those who can’t figure out how to be Angels. You can sign up to be part of the new excitement called Equity Crowd Funding. Equity Crowd Funding allows you to join the masses to chase investments with as little as 5k dollars. Oh the possibilities !!
I have absolutely not doubt in my mind that most of these individual Angels and crowd funders are currently under water in their investments. Absolutely none. I say most. The percentage could be higher
Why ?
Because there is ZERO liquidity for any of those investments. None. Zero. Zip.
All those Angel investments in all those apps and startups. All that crowdfunded equity. All in search of their unicorn because the only real salvation right now is an exit or cash pay out from operations. The SEC made sure that there is no market for any of these companies to go public and create liquidity for their Angels. The market for sub 25mm dollar raises is effectively dead. DOA . Gone. Thanks SEC. And with the new Equity CrowdFunding rules yet to be finalized, there is no reason to believe that the SEC will be smart enough to create some form of liquidity for all those widows and orphans who will put their $5k into the dream only to realize they can’t get any cash back when they need money to fix their car.
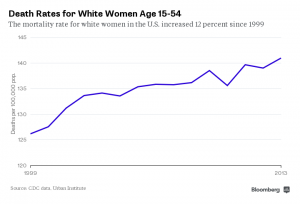
Longevity risk has been a fascination of mine over the past few years; it was briefly mentioned yesterday. But there are interesting wrinkles with respect to women:
Black women have a much higher mortality rate, but it has declined significantly—23 percent since 1999. Hispanic women also posted declines. (Hispanics of all age groups, both men and women, have lower mortality rates than average, a demographic phenomenon known as the Hispanic paradox.)
Part of the jump in the death rate for whites is explained by the epidemic of prescription painkiller abuse and overdoses that disproportionately affected whites. But that accounts for only half the total increase, according to the report. Other causes of death on the rise include suicide and respiratory disease. Some declined, including traffic deaths, homicides, and the cancers most closely linked to smoking.
…
The pattern may reflect “a systematic reversal in the long-term trend of mortality decline” for white women, according to the Urban Institute paper. Such a shift could be linked to social and economic circumstances. Poorer people generally have poorer health for a variety of reasons, and growing inequality could be weighing on death rates.“It’s possible that as this group of women ages, there could be a reversal of a very long-term decline in the death rate,” said Nan Marie Astone, a senior fellow at the Urban Institute and the lead author of the report. America isn’t really used to the idea of declining life expectancy. The next few decades might change that.
It was a quiet, mixed day for the Canadian preferred share market, with PerpetualDiscounts off 7bp, FixedResets down 8bp and DeemedRetractibles gaining 1bp. Enbridge FixedResets were prominent in the bad part of the Performance Highlights table. Volume was quite high, with eight issues breaking the 100,000 barrier.
For as long as the FixedReset market is so violently unsettled, I’ll keep publishing updates of the more interesting and meaningful series of FixedResets’ Implied Volatilities. This doesn’t include Enbridge because although Enbridge has a large number of issues outstanding, all of which are quite liquid, the range of Issue Reset Spreads is too small for decent conclusions. The low is 212bp (ENB.PR.H; second-lowest is ENB.PR.D at 237bp) and the high is a mere 268 for ENB.PF.G.
Remember that all rich /cheap assessments are:
» based on Implied Volatility Theory only
» are relative only to other FixedResets from the same issuer
» assume constant GOC-5 yield
» assume constant Implied Volatility
» assume constant spread
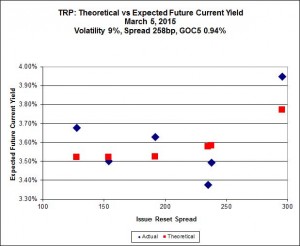
Here’s TRP:
TRP.PR.E, which resets 2019-10-30 at +235, is bid at 24.37 to be $1.38 rich, while TRP.PR.G, resetting 2020-11-30 at +296, is $1.16 cheap at its bid price of 24.70.
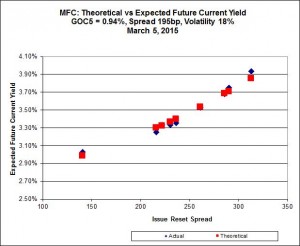
Another excellent fit, but the numbers are perplexing. Implied Volatility for MFC continues to be a conundrum, although it declined substantially today. It is still too high if we consider that NVCC rules will never apply to these issues; it is still too low if we consider them to be NVCC non-compliant issues (and therefore with Deemed Maturities in the call schedule).
Most expensive is MFC.PR.M, resetting at +236 on 2019-12-19, bid at 24.61 to be $0.34 rich, while MFC.PR.H, resetting at +313bp on 2017-3-19, is bid at 25.85 to be $0.55 cheap.
The fit on this series is actually quite reasonable – it’s the scale that makes it look so weird.
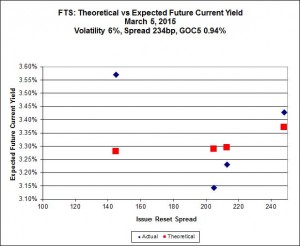
The cheapest issue relative to its peers is BAM.PF.F, resetting at +286bp on 2019-9-30, bid at 25.117 to be $0.26 cheap. BAM.PF.E, resetting at +255bp 2020-3-31 is bid at 24.30 and appears to be $0.54 rich.
This is just weird because the middle is expensive and the ends are cheap but anyway … FTS.PR.H, with a spread of +145bp, and bid at 16.74, looks $1.48 cheap and resets 2015-6-1. FTS.PR.K, with a spread of +205bp and resetting 2019-3-1, is bid at 23.79 and is $1.06 rich.
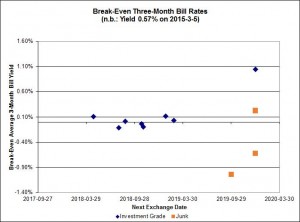
This is rather odd – the investment grade break-even rates are clustered around zero, with one outlier: the TRP.PR.A / TRP.PR.F pair, clocking in at more realistic 1.04%.
Shall we just say that this exhibits a high level of confidence in the continued rapacity of Canadian banks?
| HIMIPref™ Preferred Indices These values reflect the December 2008 revision of the HIMIPref™ Indices Values are provisional and are finalized monthly |
|||||||
| Index | Mean Current Yield (at bid) |
Median YTW |
Median Average Trading Value |
Median Mod Dur (YTW) |
Issues | Day’s Perf. | Index Value |
| Ratchet | 0.00 % | 0.00 % | 0 | 0.00 | 0 | -0.2093 % | 2,396.6 |
| FixedFloater | 0.00 % | 0.00 % | 0 | 0.00 | 0 | -0.2093 % | 4,190.4 |
| Floater | 3.14 % | 3.18 % | 76,141 | 19.22 | 3 | -0.2093 % | 2,547.8 |
| OpRet | 4.07 % | 1.07 % | 107,355 | 0.29 | 1 | 0.0397 % | 2,763.7 |
| SplitShare | 4.48 % | 4.59 % | 56,421 | 4.46 | 5 | 0.1638 % | 3,207.1 |
| Interest-Bearing | 0.00 % | 0.00 % | 0 | 0.00 | 0 | 0.0397 % | 2,527.1 |
| Perpetual-Premium | 5.29 % | -2.04 % | 56,570 | 0.08 | 25 | -0.0219 % | 2,521.2 |
| Perpetual-Discount | 4.95 % | 5.02 % | 156,320 | 15.09 | 9 | -0.0695 % | 2,811.2 |
| FixedReset | 4.42 % | 3.50 % | 238,534 | 16.75 | 80 | -0.0803 % | 2,422.6 |
| Deemed-Retractible | 4.90 % | 0.02 % | 106,692 | 0.09 | 37 | 0.0085 % | 2,659.8 |
| FloatingReset | 2.50 % | 2.92 % | 90,513 | 6.35 | 8 | -0.3666 % | 2,340.7 |
| Performance Highlights | |||
| Issue | Index | Change | Notes |
| ENB.PF.G | FixedReset | -2.18 % | YTW SCENARIO Maturity Type : Limit Maturity Maturity Date : 2045-03-05 Maturity Price : 21.89 Evaluated at bid price : 22.40 Bid-YTW : 4.12 % |
| TRP.PR.F | FloatingReset | -2.02 % | YTW SCENARIO Maturity Type : Limit Maturity Maturity Date : 2045-03-05 Maturity Price : 19.40 Evaluated at bid price : 19.40 Bid-YTW : 3.16 % |
| ENB.PF.A | FixedReset | -1.72 % | YTW SCENARIO Maturity Type : Limit Maturity Maturity Date : 2045-03-05 Maturity Price : 21.89 Evaluated at bid price : 22.35 Bid-YTW : 4.08 % |
| ENB.PF.C | FixedReset | -1.63 % | YTW SCENARIO Maturity Type : Limit Maturity Maturity Date : 2045-03-05 Maturity Price : 21.87 Evaluated at bid price : 22.33 Bid-YTW : 4.08 % |
| TRP.PR.E | FixedReset | -1.54 % | YTW SCENARIO Maturity Type : Limit Maturity Maturity Date : 2045-03-05 Maturity Price : 22.96 Evaluated at bid price : 24.37 Bid-YTW : 3.38 % |
| IFC.PR.A | FixedReset | -1.52 % | YTW SCENARIO Maturity Type : Hard Maturity Maturity Date : 2025-01-31 Maturity Price : 25.00 Evaluated at bid price : 20.10 Bid-YTW : 5.79 % |
| BAM.PR.T | FixedReset | -1.20 % | YTW SCENARIO Maturity Type : Limit Maturity Maturity Date : 2045-03-05 Maturity Price : 21.75 Evaluated at bid price : 22.23 Bid-YTW : 3.65 % |
| PWF.PR.T | FixedReset | -1.20 % | YTW SCENARIO Maturity Type : Limit Maturity Maturity Date : 2045-03-05 Maturity Price : 23.19 Evaluated at bid price : 24.80 Bid-YTW : 3.26 % |
| ENB.PF.E | FixedReset | -1.19 % | YTW SCENARIO Maturity Type : Limit Maturity Maturity Date : 2045-03-05 Maturity Price : 21.93 Evaluated at bid price : 22.44 Bid-YTW : 4.09 % |
| BAM.PF.A | FixedReset | 1.11 % | YTW SCENARIO Maturity Type : Limit Maturity Maturity Date : 2045-03-05 Maturity Price : 23.47 Evaluated at bid price : 25.55 Bid-YTW : 3.64 % |
| GWO.PR.N | FixedReset | 1.37 % | YTW SCENARIO Maturity Type : Hard Maturity Maturity Date : 2025-01-31 Maturity Price : 25.00 Evaluated at bid price : 18.50 Bid-YTW : 5.64 % |
| TRP.PR.B | FixedReset | 1.62 % | YTW SCENARIO Maturity Type : Limit Maturity Maturity Date : 2045-03-05 Maturity Price : 15.09 Evaluated at bid price : 15.09 Bid-YTW : 3.41 % |
| SLF.PR.G | FixedReset | 2.14 % | YTW SCENARIO Maturity Type : Hard Maturity Maturity Date : 2025-01-31 Maturity Price : 25.00 Evaluated at bid price : 18.13 Bid-YTW : 5.89 % |
| BAM.PR.X | FixedReset | 2.37 % | YTW SCENARIO Maturity Type : Limit Maturity Maturity Date : 2045-03-05 Maturity Price : 18.54 Evaluated at bid price : 18.54 Bid-YTW : 3.86 % |
| TRP.PR.C | FixedReset | 3.81 % | YTW SCENARIO Maturity Type : Limit Maturity Maturity Date : 2045-03-05 Maturity Price : 17.71 Evaluated at bid price : 17.71 Bid-YTW : 3.41 % |
| Volume Highlights | |||
| Issue | Index | Shares Traded |
Notes |
| TD.PR.R | Deemed-Retractible | 443,286 | Called for redemption 2015-4-30. YTW SCENARIO Maturity Type : Call Maturity Date : 2015-04-30 Maturity Price : 25.50 Evaluated at bid price : 25.80 Bid-YTW : 0.94 % |
| RY.PR.J | FixedReset | 392,232 | Scotia crossed blocks of 25,000 and 200,000, both at 25.03. TD crossed 10,000 at 25.06. Nesbitt crossed 55,800 at 25.03; RBC crossed 25,000 at the same price. YTW SCENARIO Maturity Type : Limit Maturity Maturity Date : 2045-03-05 Maturity Price : 23.15 Evaluated at bid price : 25.00 Bid-YTW : 3.42 % |
| TRP.PR.B | FixedReset | 218,647 | RBC crossed 176,300 at 15.19. YTW SCENARIO Maturity Type : Limit Maturity Maturity Date : 2045-03-05 Maturity Price : 15.09 Evaluated at bid price : 15.09 Bid-YTW : 3.41 % |
| SLF.PR.G | FixedReset | 206,510 | RBC crossed 177,200 at 18.40. YTW SCENARIO Maturity Type : Hard Maturity Maturity Date : 2025-01-31 Maturity Price : 25.00 Evaluated at bid price : 18.13 Bid-YTW : 5.89 % |
| TRP.PR.G | FixedReset | 182,740 | Recent new issue. YTW SCENARIO Maturity Type : Limit Maturity Maturity Date : 2045-03-05 Maturity Price : 23.02 Evaluated at bid price : 24.70 Bid-YTW : 3.69 % |
| CU.PR.C | FixedReset | 146,811 | RBC crossed 131,300 at 24.10. YTW SCENARIO Maturity Type : Limit Maturity Maturity Date : 2045-03-05 Maturity Price : 23.09 Evaluated at bid price : 23.98 Bid-YTW : 3.34 % |
| GWO.PR.N | FixedReset | 118,601 | RBC crossed 100,000 at 18.70. YTW SCENARIO Maturity Type : Hard Maturity Maturity Date : 2025-01-31 Maturity Price : 25.00 Evaluated at bid price : 18.50 Bid-YTW : 5.64 % |
| MFC.PR.N | FixedReset | 106,500 | Desjardins crossed 100,000 at 24.50. YTW SCENARIO Maturity Type : Hard Maturity Maturity Date : 2025-01-31 Maturity Price : 25.00 Evaluated at bid price : 24.29 Bid-YTW : 3.81 % |
| There were 45 other index-included issues trading in excess of 10,000 shares. | |||
| Wide Spread Highlights | ||
| Issue | Index | Quote Data and Yield Notes |
| ENB.PF.C | FixedReset | Quote: 22.33 – 22.79 Spot Rate : 0.4600 Average : 0.3158 YTW SCENARIO |
| BNS.PR.B | FloatingReset | Quote: 23.89 – 24.24 Spot Rate : 0.3500 Average : 0.2467 YTW SCENARIO |
| PWF.PR.E | Perpetual-Premium | Quote: 25.49 – 25.78 Spot Rate : 0.2900 Average : 0.2017 YTW SCENARIO |
| CU.PR.C | FixedReset | Quote: 23.98 – 24.44 Spot Rate : 0.4600 Average : 0.3818 YTW SCENARIO |
| BNS.PR.P | FixedReset | Quote: 25.40 – 25.64 Spot Rate : 0.2400 Average : 0.1656 YTW SCENARIO |
| ELF.PR.F | Perpetual-Premium | Quote: 25.15 – 25.36 Spot Rate : 0.2100 Average : 0.1406 YTW SCENARIO |
