As noted in MAPF Portfolio Composition: November 2015, the fund now has a large allocation to FixedResets, mostly of relatively low spread.
Many of these were largely purchased with proceeds of sales of DeemedRetractibles from the same issuer; it is interesting to look at the price trend of some of the Straight/FixedReset pairs. We’ll start with GWO.PR.N / GWO.PR.I; the fund sold the latter to buy the former at a takeout of about $1.00 in mid-June, 2014; relative prices over the past year are plotted as:

Click for Big
Given that the November month-end take-out was $7.88, this is clearly a trade that has not worked out very well.
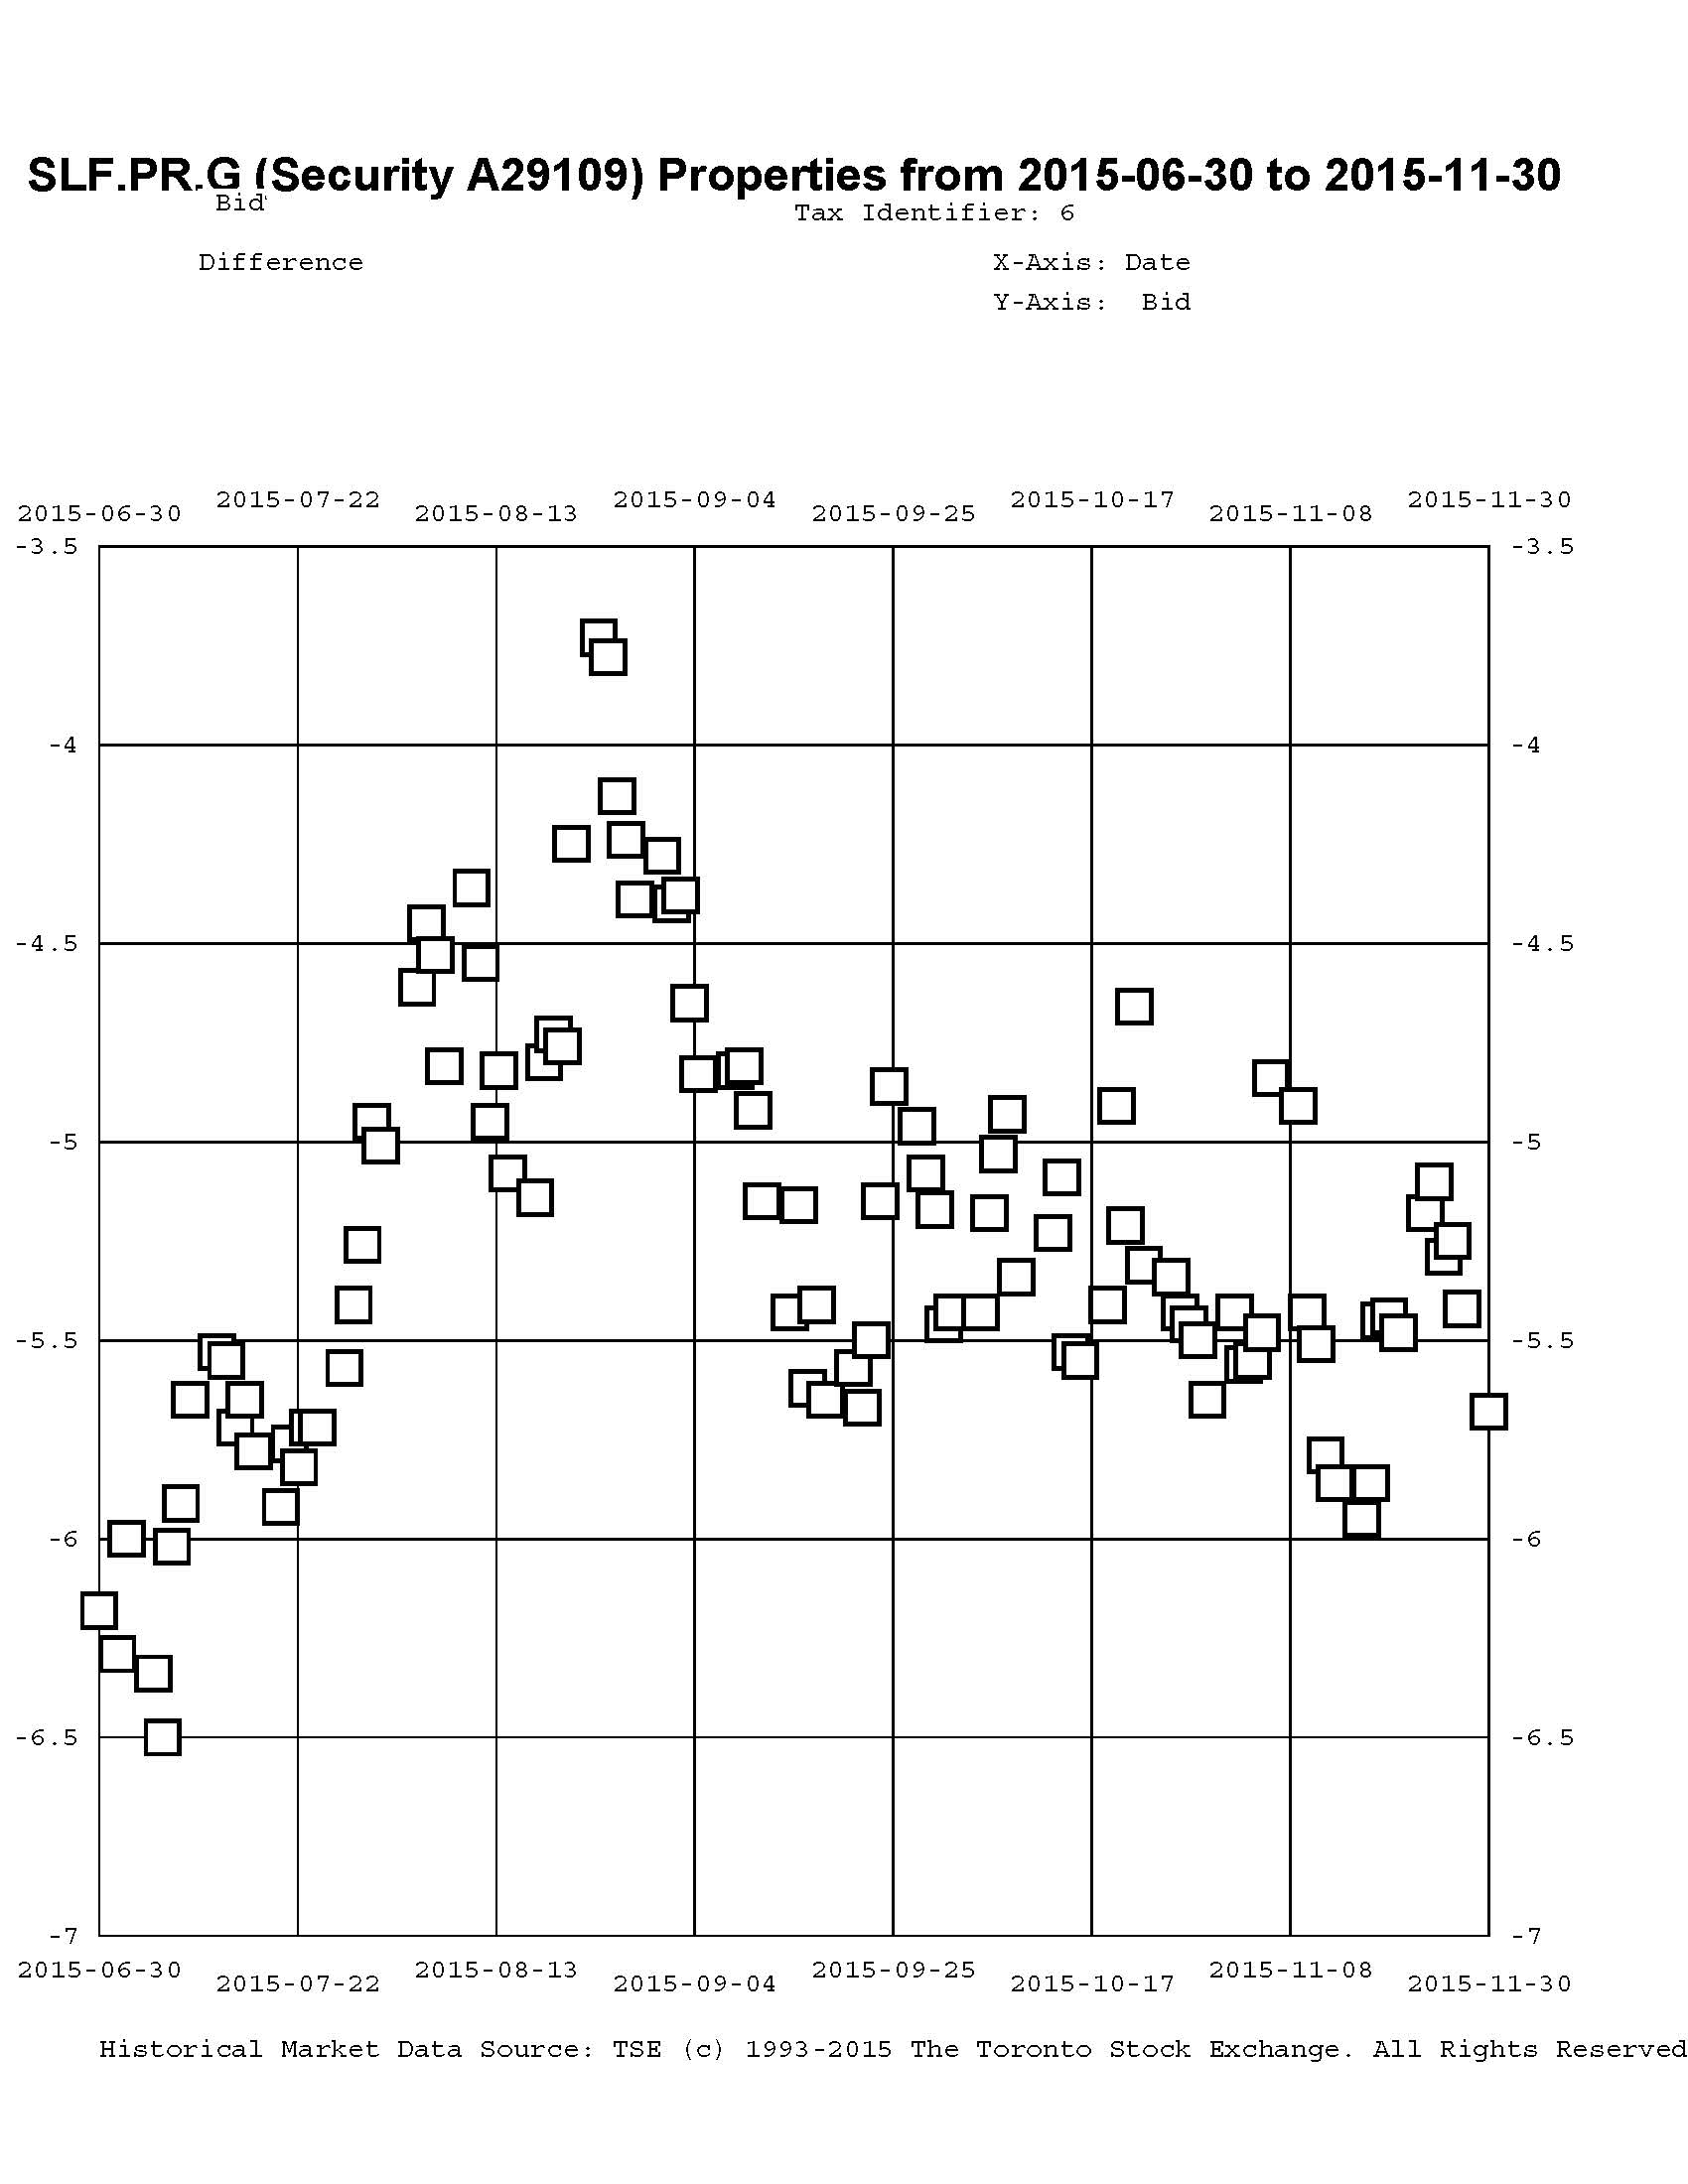
In July, 2014, I reported sales of SLF.PR.D to purchase SLF.PR.G at a take-out of about $0.15:
Click for Big
There were similar trades in August, 2014 (from SLF.PR.C) at a take-out of $0.35. The October month-end take-out (bid price SLF.PR.D less bid price SLF.PR.G) was $5.68, so that hasn’t worked very well either.
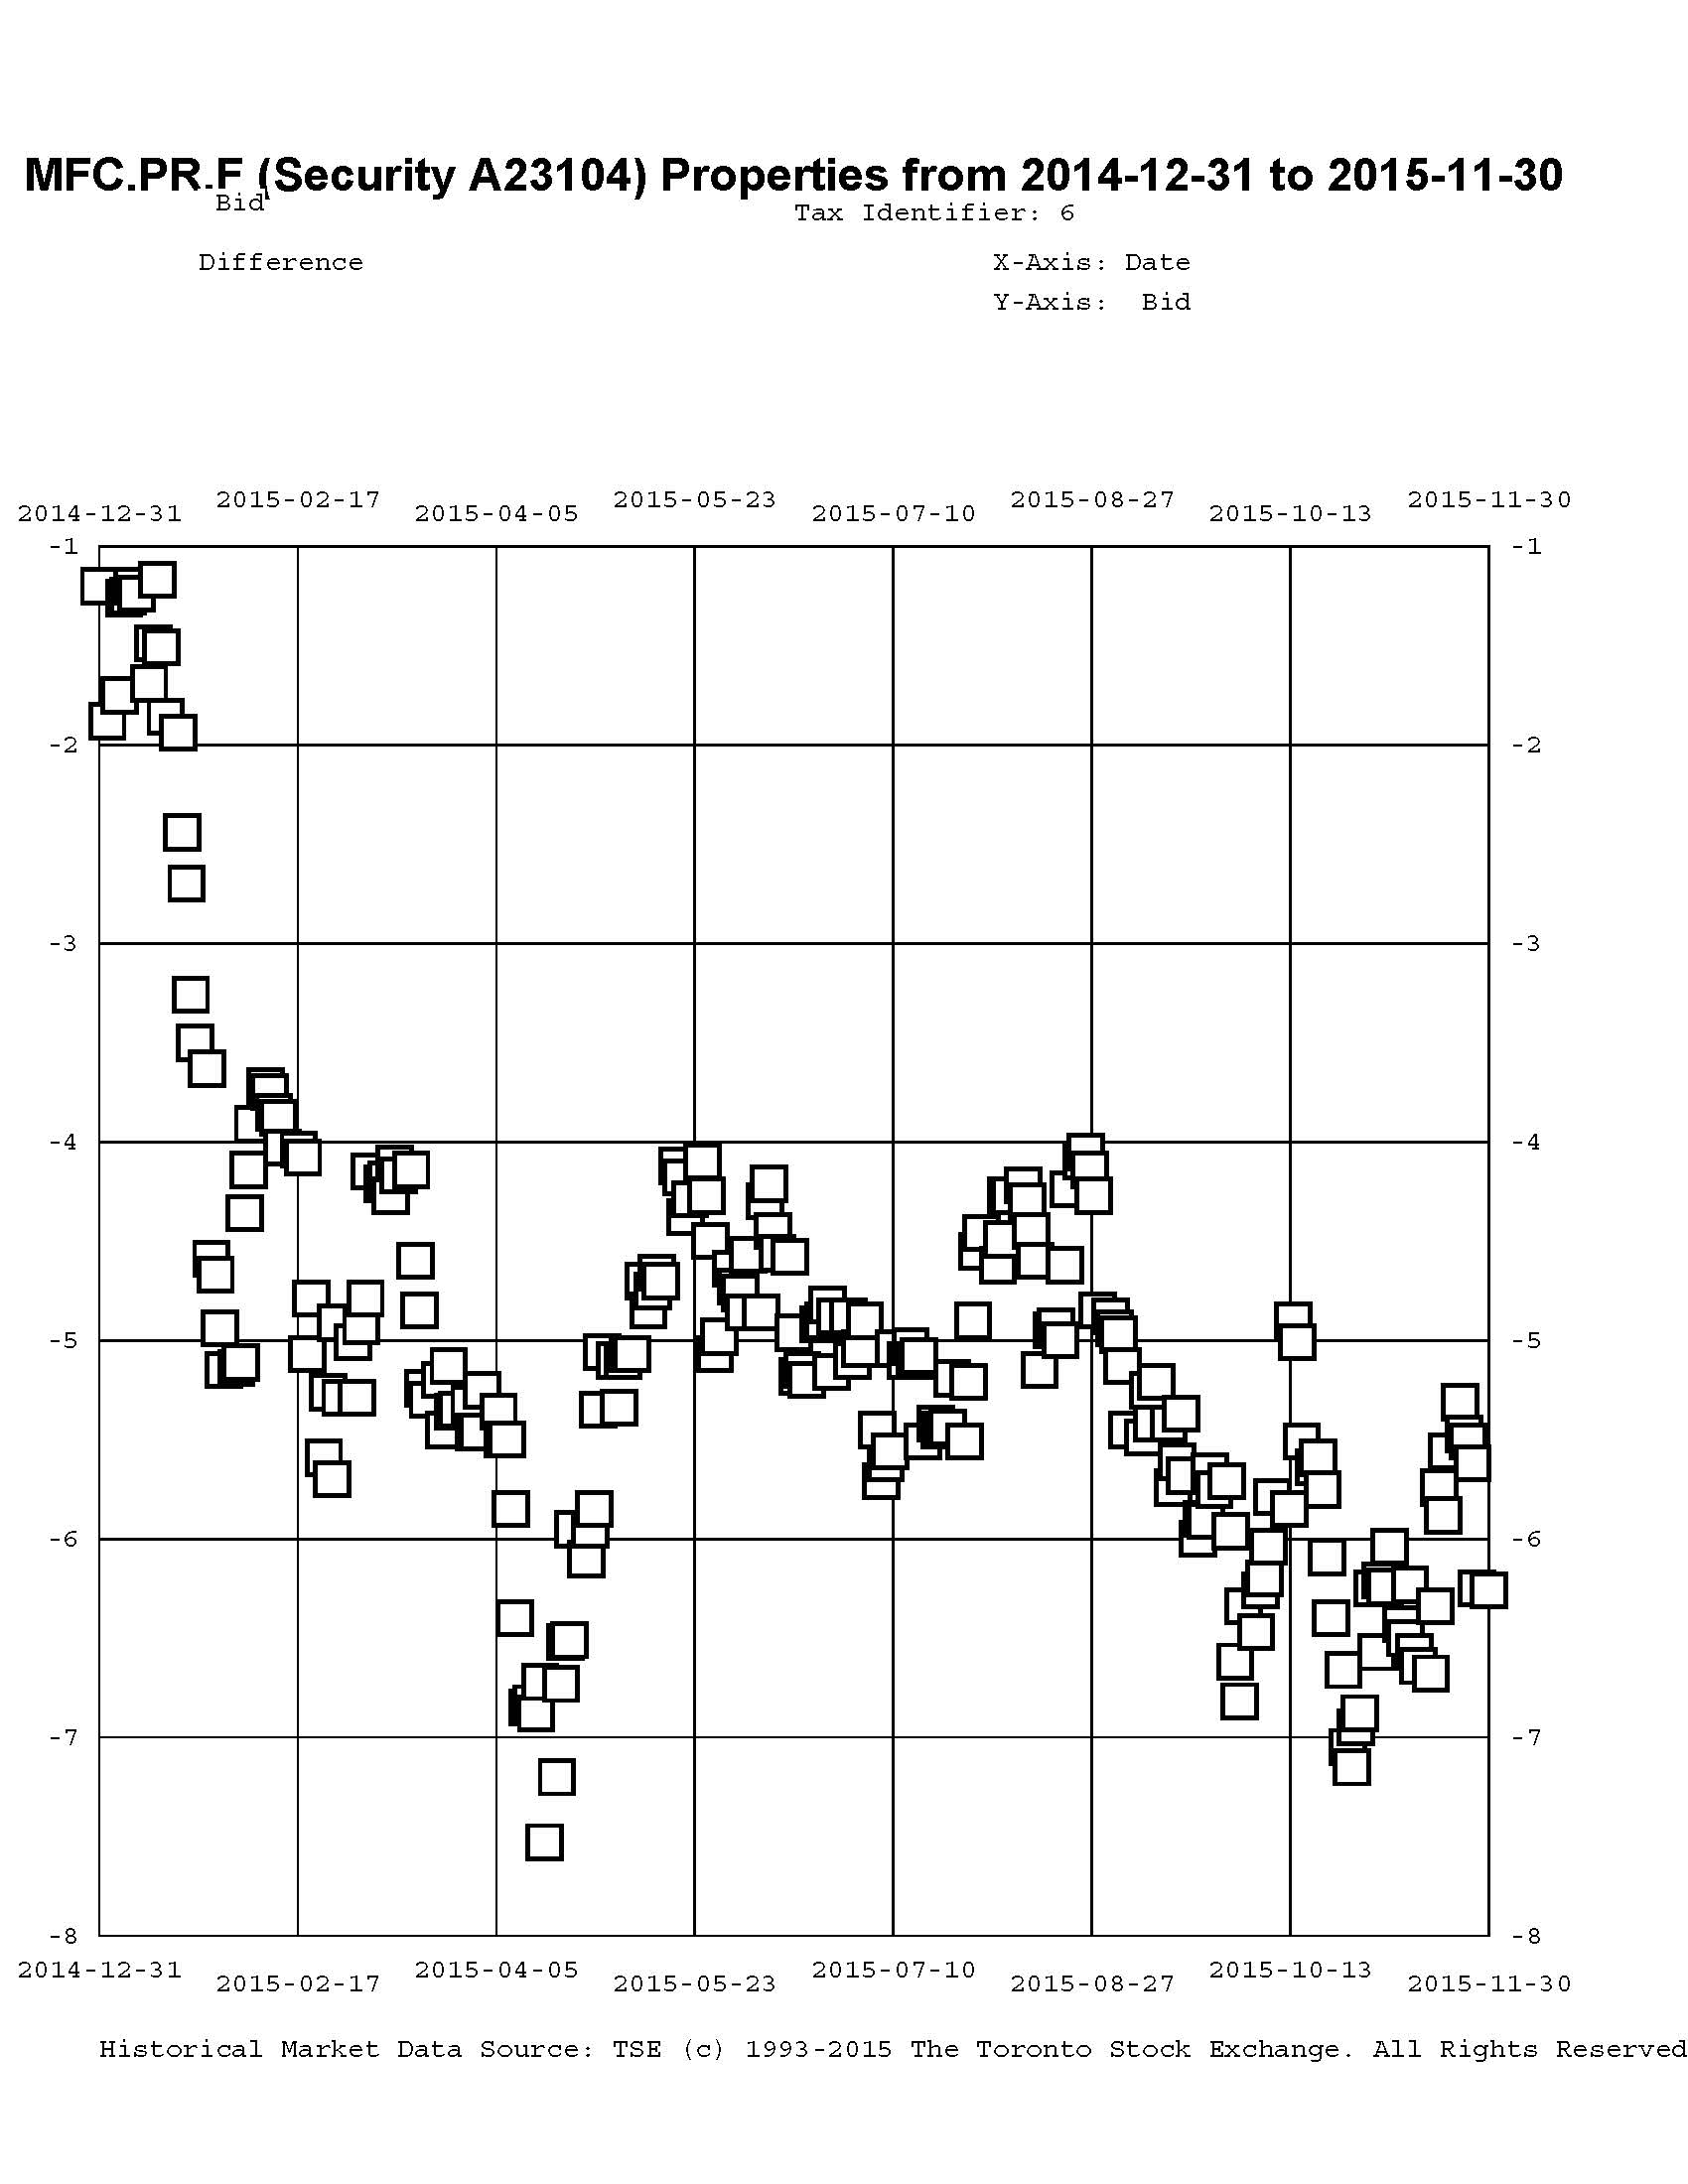
November, 2014, saw the third insurer-based sector swap, as the fund sold MFC.PR.C to buy the FixedReset MFC.PR.F at a post-dividend-adjusted take-out of about $0.85 … given a November month-end take-out of $6.26, that’s another regrettable trade, although another piece executed in December at a take-out of $1.57 has less badly.
Click for Big
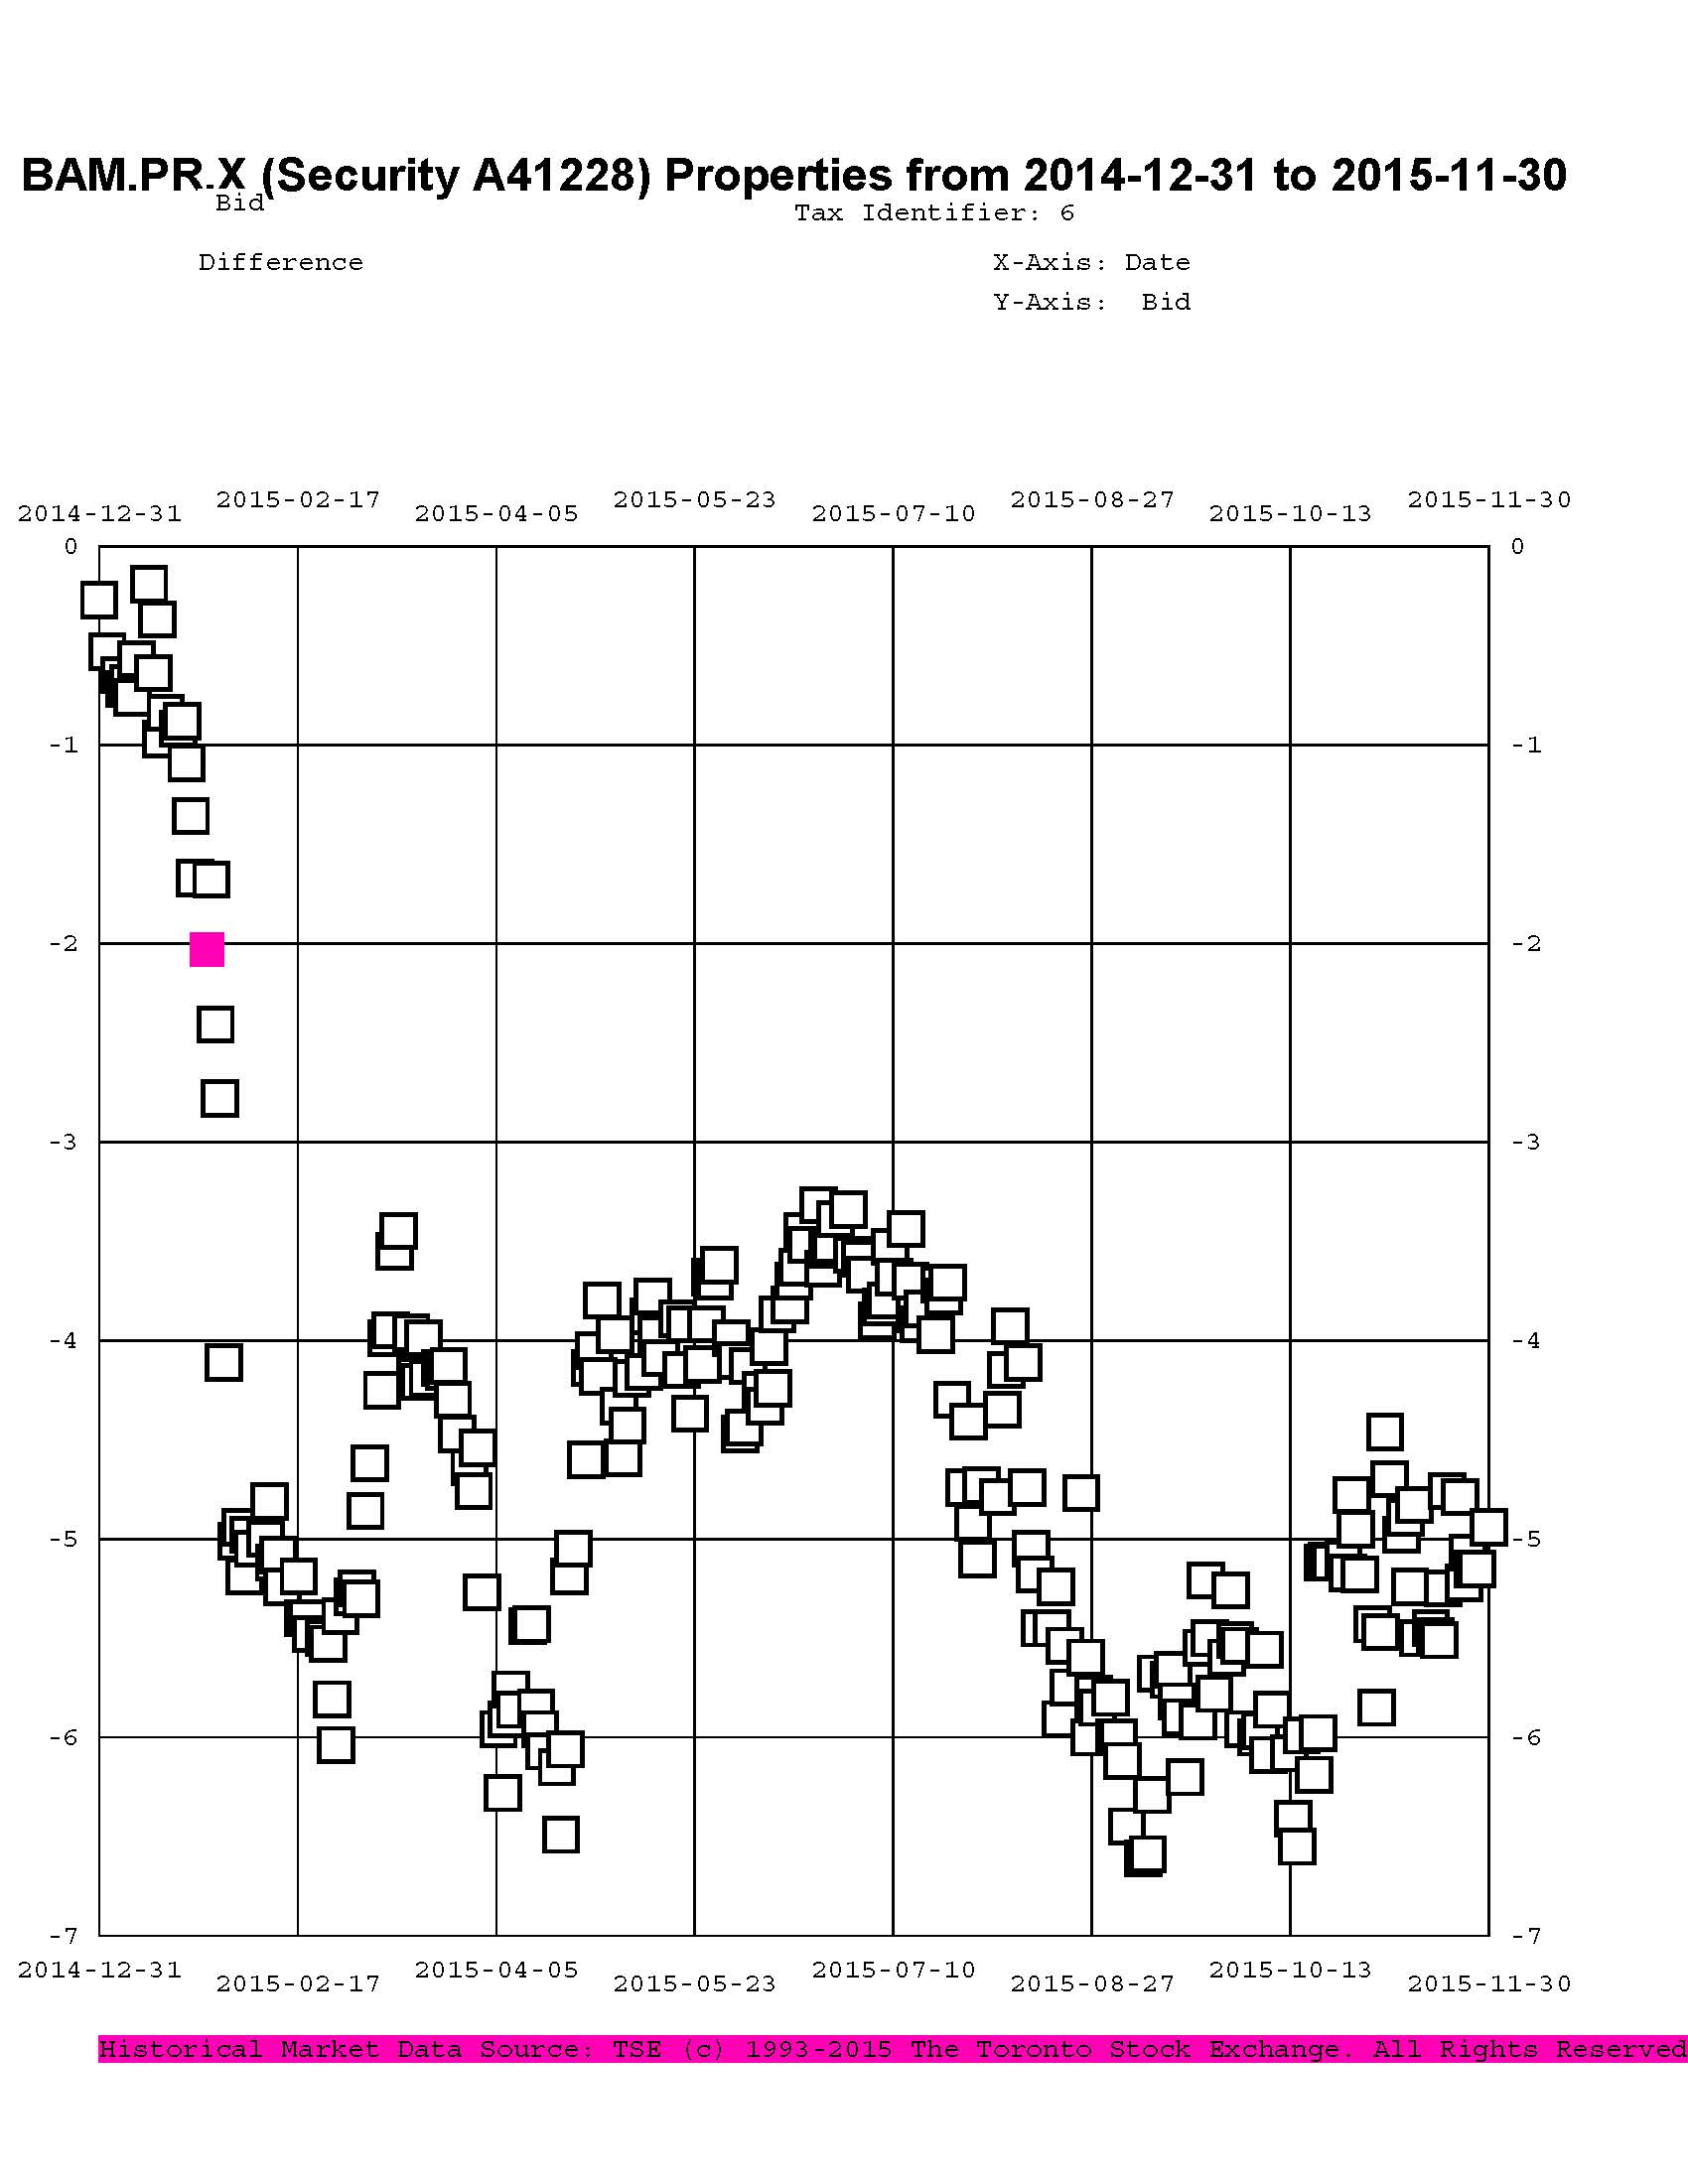
This trend is not restricted to the insurance sector, which I expect will become subject to NVCC rules in the relatively near future and are thus subject to the same redemption assumptions I make for DeemedRetractibles. Other pairs of interest are BAM.PR.X / BAM.PR.N:
Click for Big
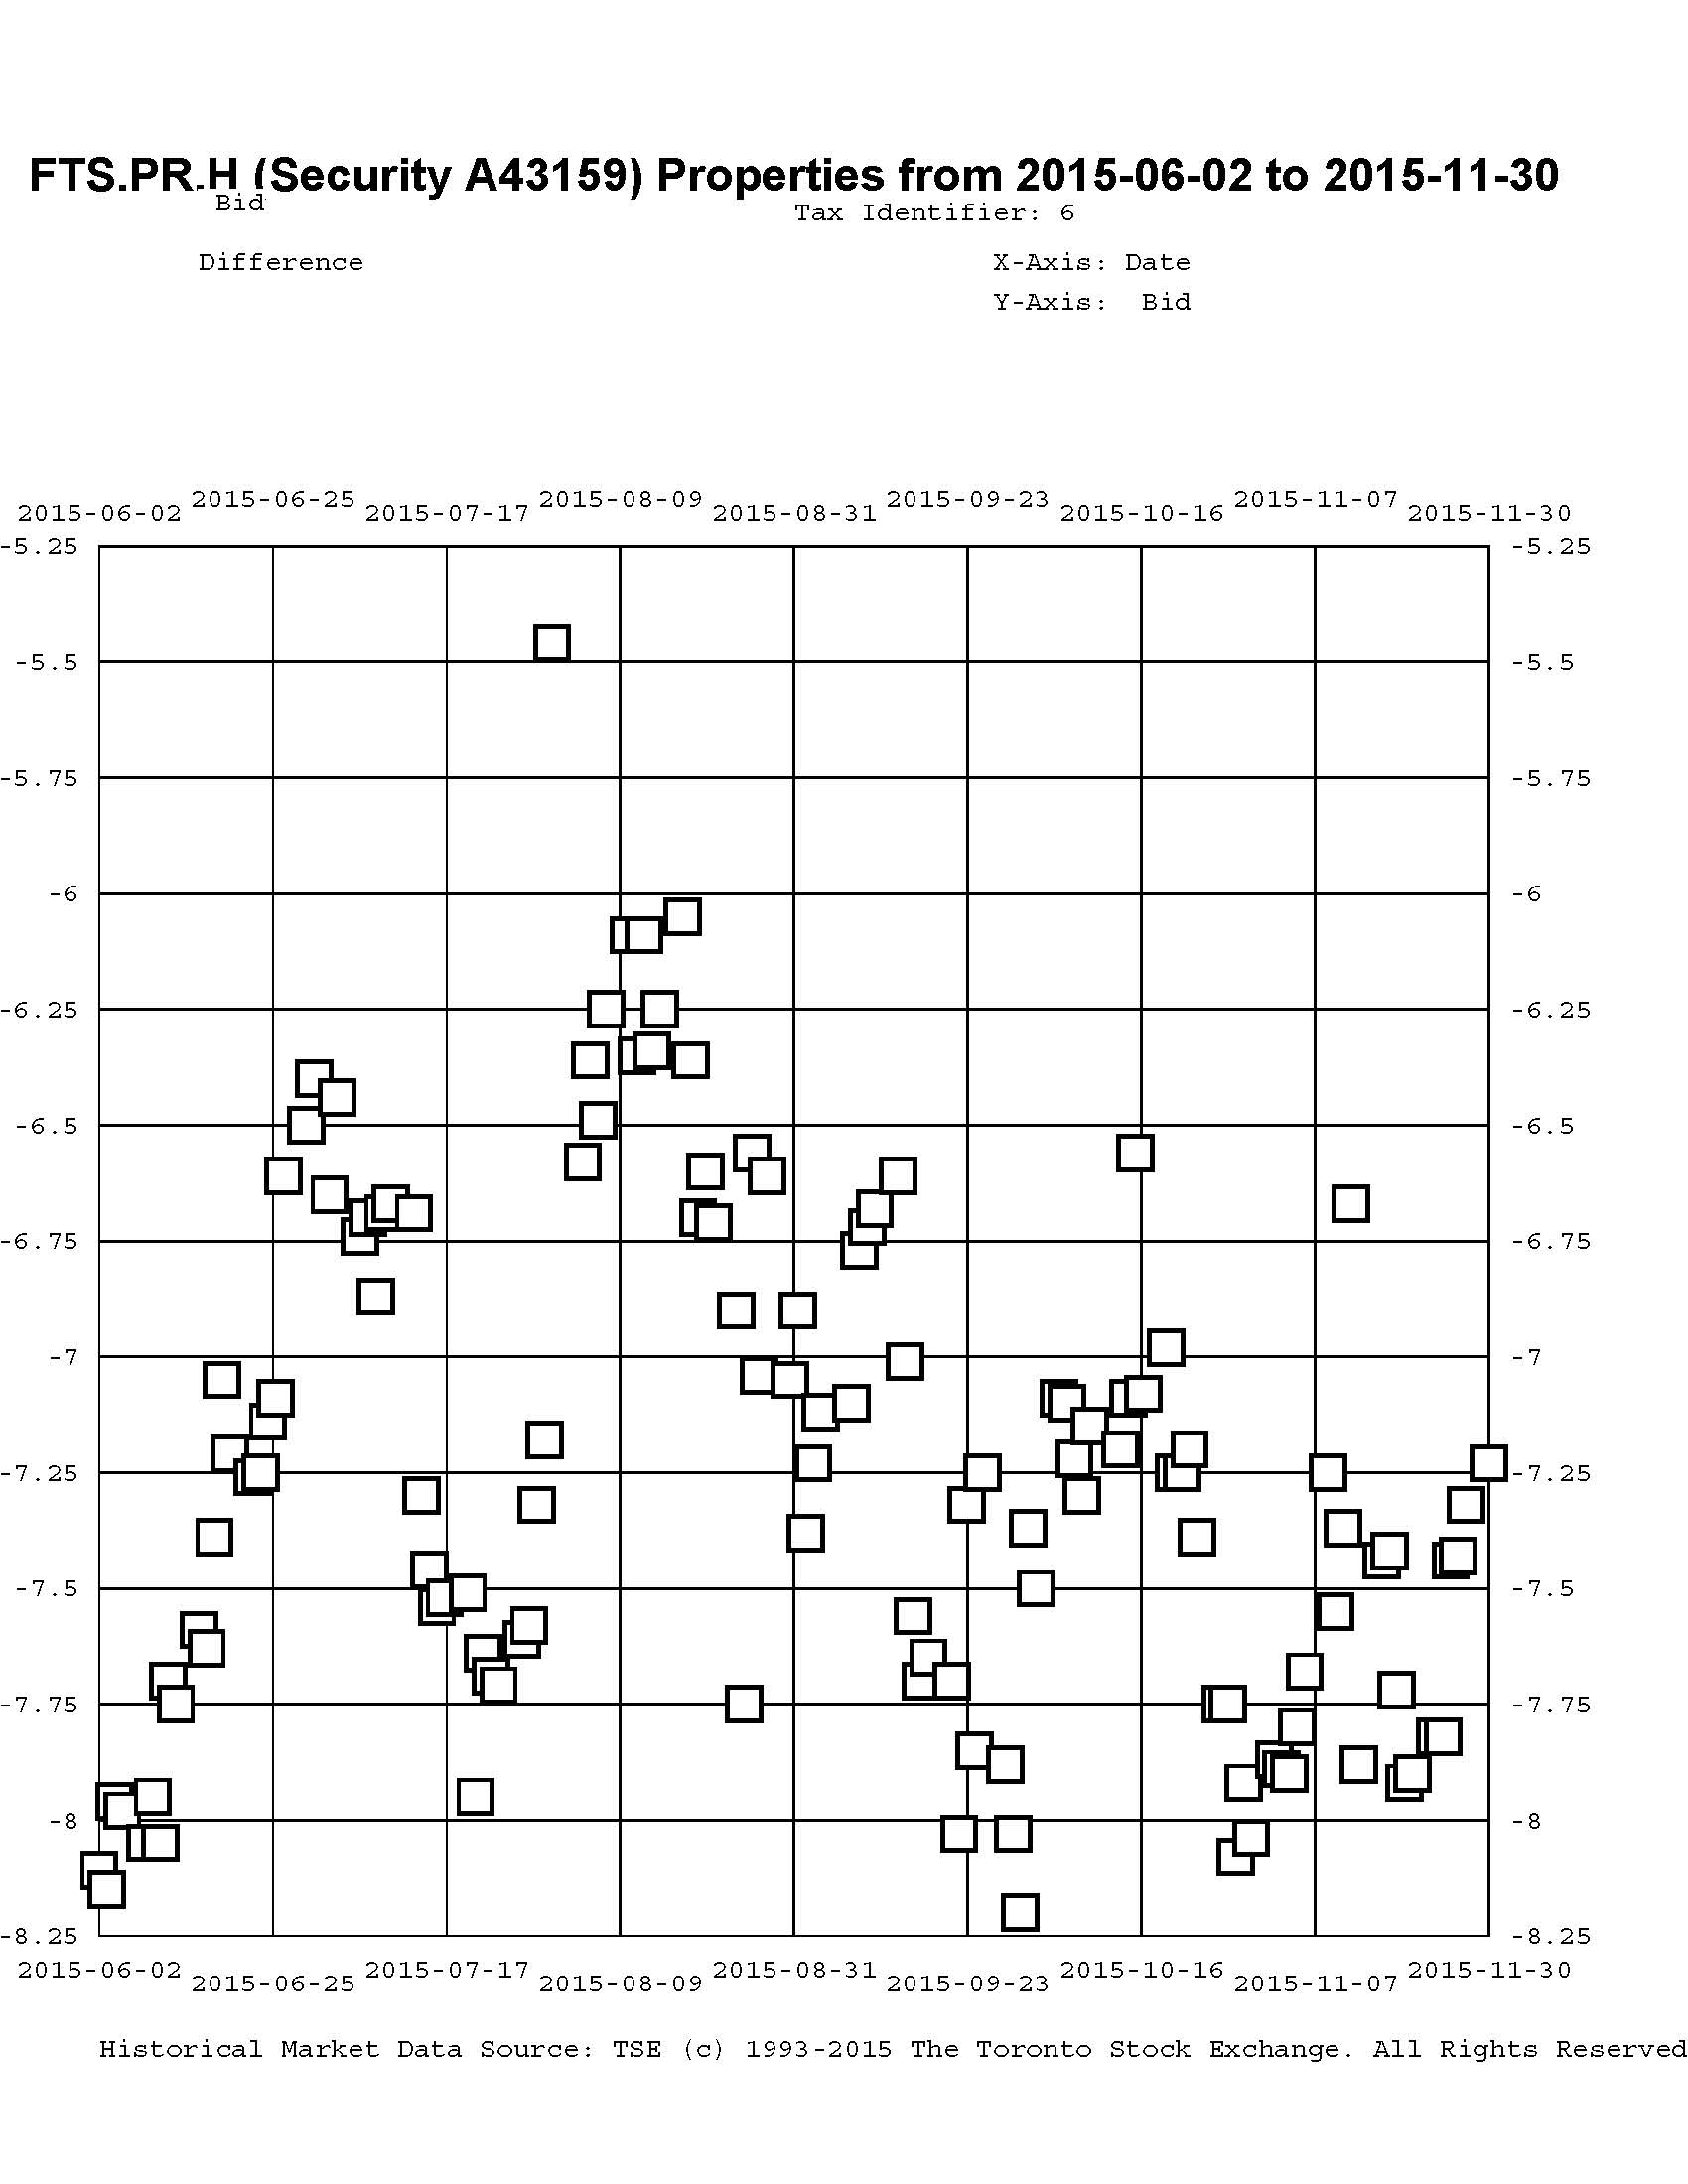
… and FTS.PR.H / FTS.PR.J:
Click for Big
… and PWF.PR.P / PWF.PR.S:
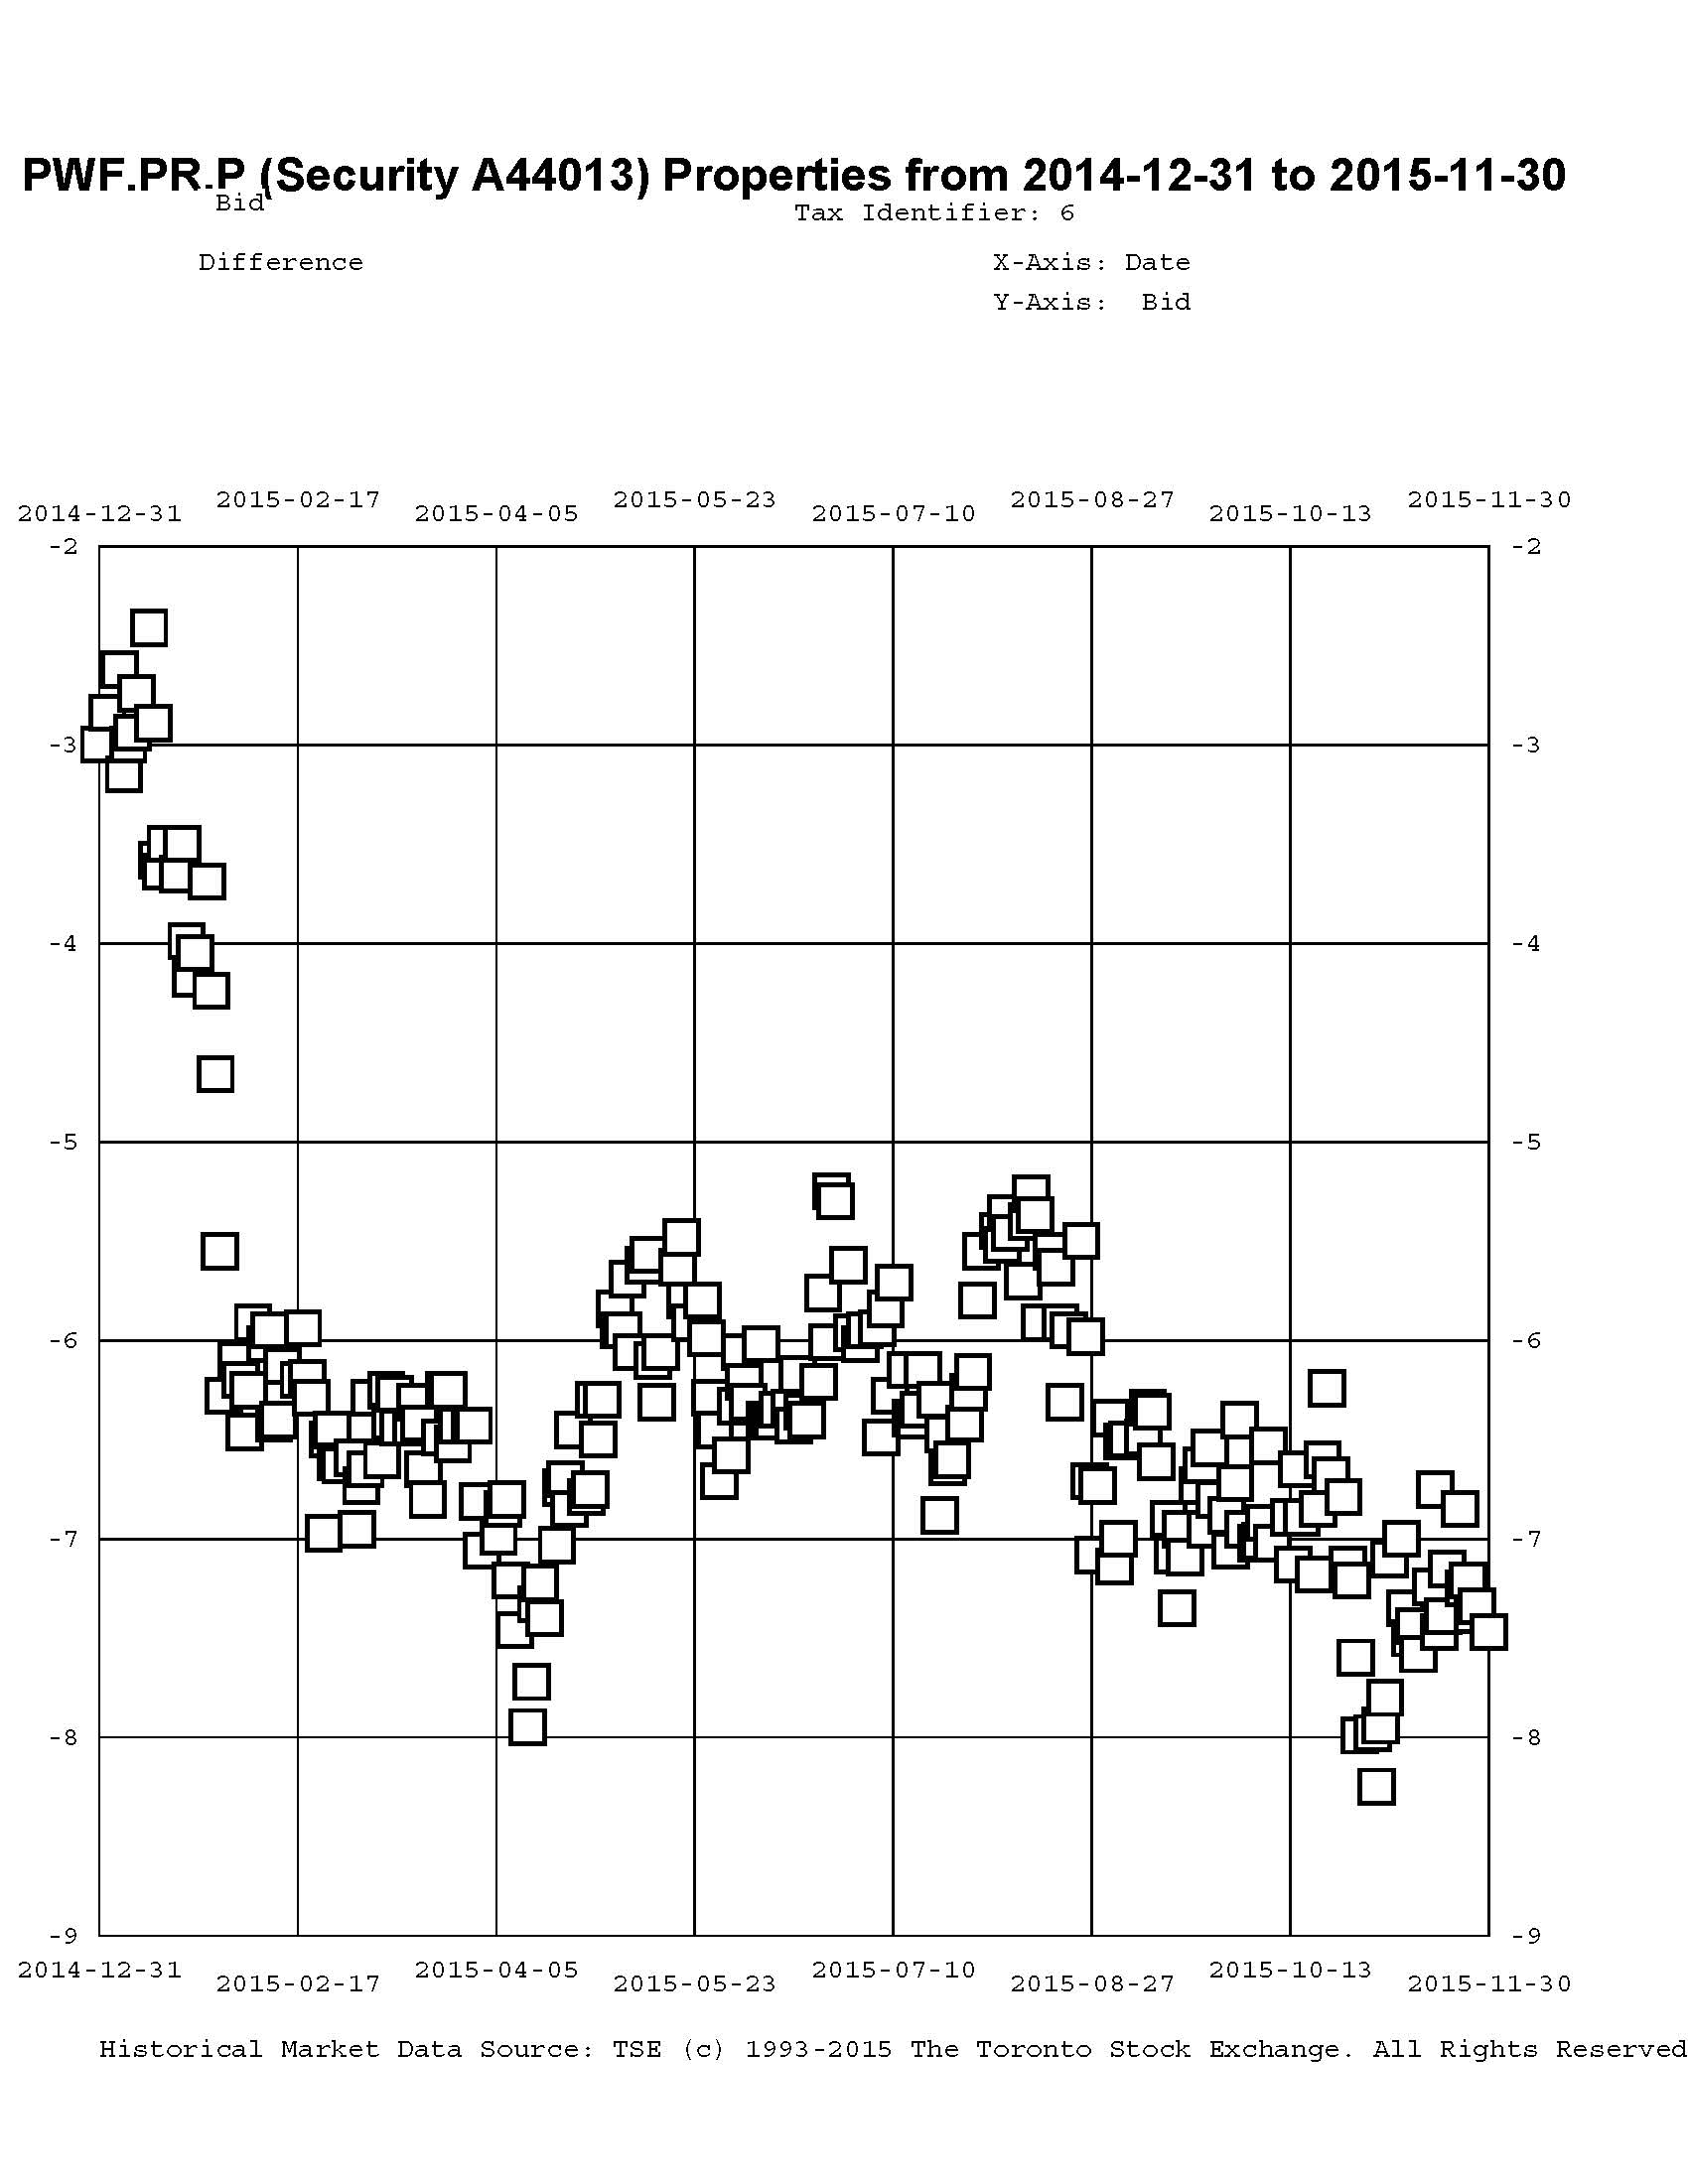
Click for Big
I will agree that the fund’s trades highlighted in this post may be decried as cases of monumental bad timing, but I should point out that in May, 2014, the fund was 63.9% Straight / 9.5% FixedReset while in May 2015 the fund was 12% Straight / 86% FixedReset, FloatingReset and FixedFloater (The latter figures include allocations from those usually grouped as ‘Scraps’). Given that the indices are roughly 30% Straight / 60% FixedReset & FloatingReset, it is apparent that the fund was extremely overweighted in Straights / underweighted in FixedResets in May 2014 but this situation has now reversed. HIMIPref™ analytics have been heavily favouring low-spread issues and the fund’s holdings are overwhelmingly of this type.
Getting back to price spreads between low-spread FixedResets and their Straight Perpetual comparators, we can summarize the data above in tabular form and see:
| FixedReset | Straight | Take-out December 2013 |
Take-out MAPF Trade |
Take-out December 2014 |
October 2015 | November 2015 |
| GWO.PR.N 3.65%+130 |
GWO.PR.I 4.5% |
($0.04) | $1.00 | $2.95 | 7.49 | 7.88 |
| SLF.PR.G 4.35%+141 |
SLF.PR.D 4.45% |
($1.29) | $0.25 | $2.16 | 5.65 | 5.68 |
| MFC.PR.F 4.20%+141 |
MFC.PR.C 4.50% |
($1.29) | $0.86 | $1.20 | 6.88 | 6.26 |
| BAM.PR.X 4.60%+180 |
BAM.PR.N 4.75% |
($2.06) | $0.17 | 5.18 | 4.94 | |
| FTS.PR.H 4.25%+145 |
FTS.PR.J 4.75% |
$0.60 | $5.68 | 8.04 | 7.23 | |
| PWF.PR.P 4.40%+160 |
PWF.PR.S 4.80% |
($0.67) | $3.00 | 7.99 | 7.47 | |
| The ‘Take-Out’ is the bid price of the Straight less the bid price of the FixedReset; approximate execution prices are used for the “MAPF Trade” column. Bracketted figures in the ‘Take-Out’ columns indicate a ‘Pay-Up’ | ||||||
In January, a slow decline due to fears of deflation got worse with Canada yields plummeting after the Bank of Canada rate cut with speculation rife about future cuts although this slowly died away.
And in late March / early April it got worse again, with one commenter attributing at least some of the blame to the John Heinzl piece in which I pointed out the expected reduction in dividend payouts! In May, a rise in the markets in the first half of the month was promptly followed by a slow decline in the latter half; perhaps due to increased fears that a lousy Canadian economy will delay a Canadian tightening. Changes in June varied as the markets were in an overall decline.
In August we saw increased fear of global deflation emanating from China, although the ‘China Effect’ is disputed.
In September the market just collapsed for no apparent reason; in October the market reversed the September collapse for no apparent reason.
All in all, I take the view that we’ve seen this show before: during the Credit Crunch, Floaters got hit extremely badly (to the point at which their fifteen year total return was negative) because (as far as I can make out) their dividend rate was dropping (as it was linked to Prime) while the yields on other perpetual preferred instruments were skyrocketing (due to credit concerns). Thus, at least some investors insisted on getting long term corporate yields from rates based (indirectly and with a lag, in the case of FixedResets) on short-term government policy rates. And it’s happening again!
There is further discussion of the extremely poor performance in the seven months to July 31 of FixedResets in the post eMail to a Client. Things haven’t really changed since that was written; they’ve just gotten ever so much more so.
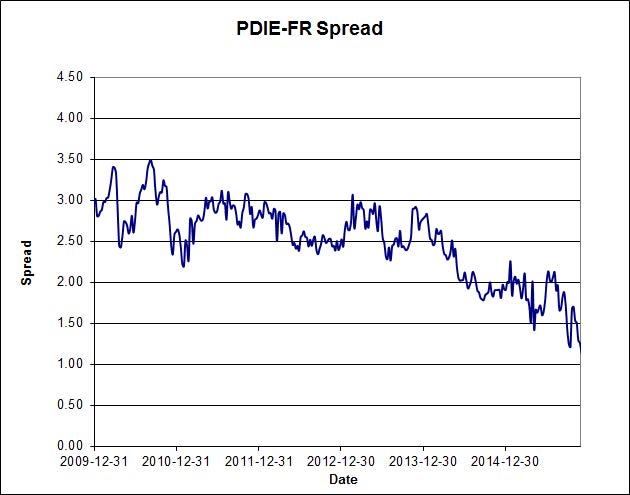
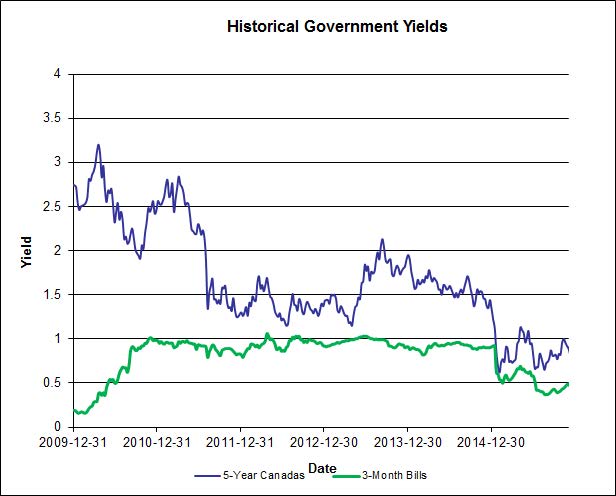
What happened, essentially, is that the software assumes a certain amount of efficiency in the market. For instance, in 2013 PerpetualDiscounts were trading to yield 250-300bp over FixedResets (see the chart “PDIE-FR Spread”, below, for the PerpetualDiscount Interest Equivalent – FixedReset Spread), where the yield-to-perpetuity of FixedResets was calculated using the contemporary five-year Canada yield of 1.50%-2.00% (see the chart “Historical Government Yields”, below, for the historical government yields). The software assumes the market will get the big things right, so it therefore assumed that this 250-300bp spread would be maintained; and that a spread in this range represented fair value. Therefore, it would only purchase FixedResets if they were sufficiently cheap to other FixedResets to give a good chance of making up this fairly large yield difference.
When this spread started increasing in 2014, FixedResets started looking more attractive as the system assumes a certain amount of mean reversion and the system started buying those issues that were cheap to other FixedResets. However, the underlying assumption that the market would get the big things more-or-less right appears to have been unjustified in this instance: incredibly, the market was not accounting for changes in the five-year Canada rate (and therefore for changes in the projected dividend rate on reset) during this period. So we can call this period an episode of structural change in the markets – and no quantitative system can account for future structural change unless that is programmed into the system … in which case the analysis is no longer quantitative.
Click for Big
Click for Big
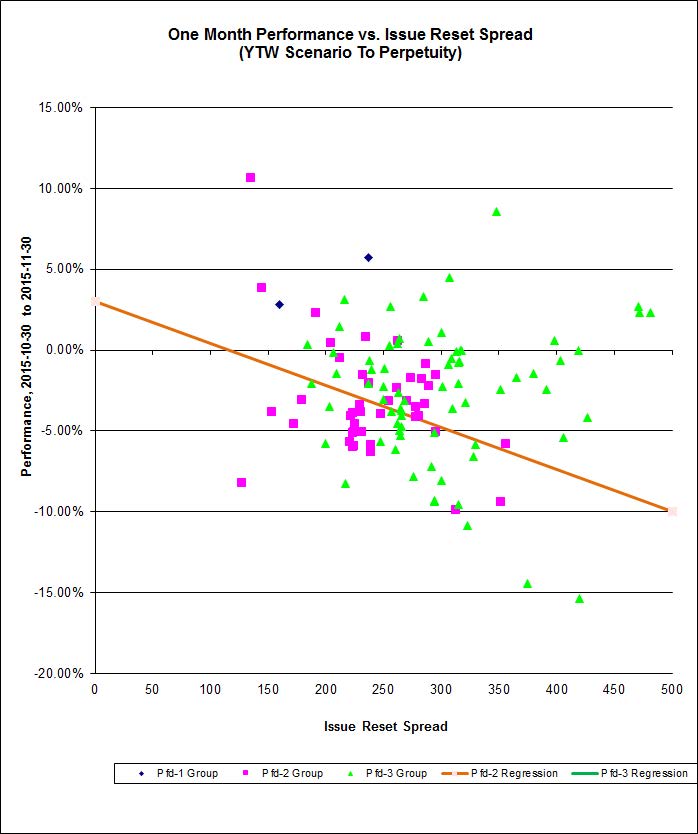
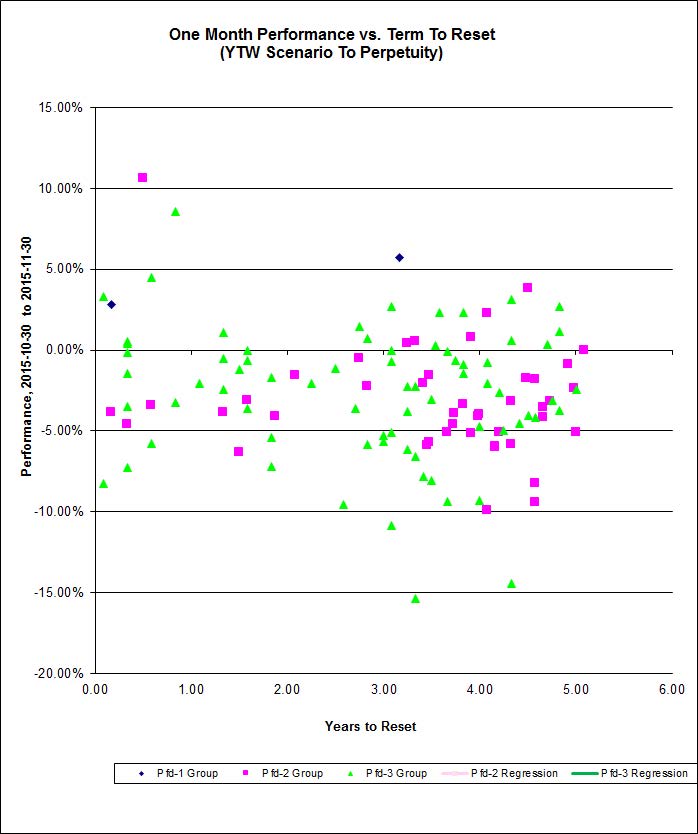
Here’s the November performance for FixedResets that had a YTW Scenario of ‘To Perpetuity’ at mid-month.:
Click for Big
The market was very disorderly in November and correlations of performance are negligible, whether against spread or term-to-reset. However, I have added the regression line for the Pfd-2 group to the above chart, not because the correlation is so great (at only 12%, it isn’t) but because it shows that to the extent that there is a correlation between spreads and returns, the slope is negative.
Click for Big
Three month performance is uncorrelated for both the Pfd-2 and Pfd-3 groups:
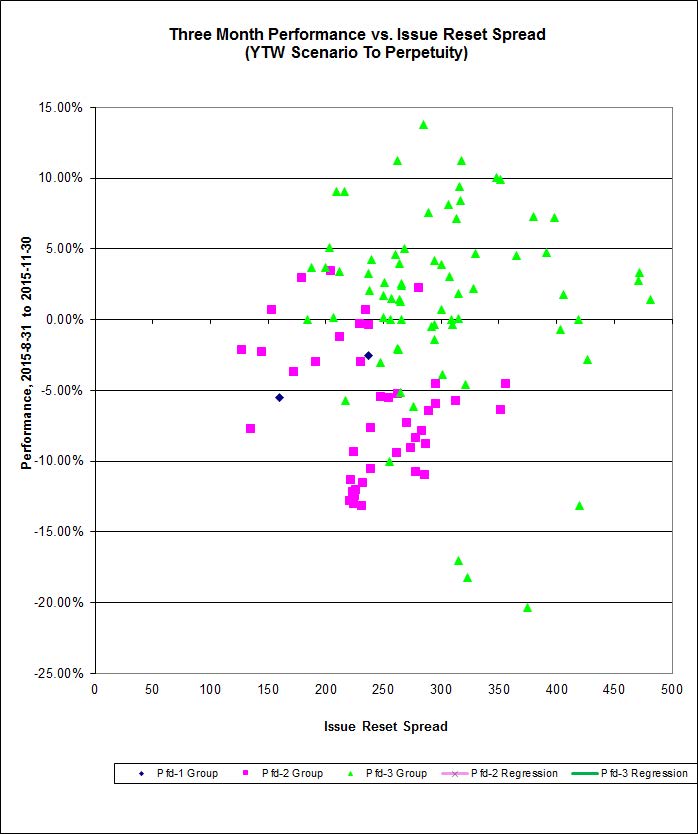
Click for Big
Your charts are as always very interesting. It would appear to my eye, and maybe I am misreading the chart, that your last chart above shows a significantly better performance the last three months for the lower credits (PF3) vs the higher credit (PF2), especially when you eliminate the four PF3 outliers (convenient statistical elimination on my part…sorry). I do not know the universe of issues very well but it seems the bank NVCC issues have been particularly hard hit as the banks are raising NVCC capital in addition to the tightening yield spread with the bank common shares. Investors do not like their bank stocks (common or pref) right now. Odd though that as credit becomes a greater concern in the overall markets that we see this. Or maybe it is a delay in reflecting information in the preferred markets and the relative performance will reverse. I certainly do not know.
last chart above shows a significantly better performance the last three months for the lower credits
Yes.
it seems the bank NVCC issues have been particularly hard hit
They did underperform, but not by much more than was indicated by comparison to other shares with similar characteristics. It just shows up more with the banks’ NVCC-compliant issues, since they have the NVCC non-compliant issues as well, which outperformed.
Odd though that as credit becomes a greater concern in the overall markets that we see this.
The market is not making a great deal of sense! Perhaps now that tax-loss selling season is over, we will see a move towards greater consistency in the market.
Is there an easy way to determine which of the bank prefs are NVCC compliant?
Is there an easy way to determine which of the bank prefs are NVCC compliant?
Easy? No.
I recommend – with a certain amount of self-interest – a subscription to PrefLetter. Or at least a single-issue every now and then.
Another way that’s quicker than most is to look at my free website, PrefInfo.
And yet a third reasonable way is to search for the issues on PrefBlog – just type the ticker symbol into the search box.
I am a new subscriber, actually. Thanks for all the info. But I don’t see it in the letter. I’ll look more closely for the list.
The table of FixedResets starts on page 51 of the PDF of the December edition and, as the note at the end of the table on page 54 states, ““NVCC” [in the column headed ‘Note 2’] means the issue complies with the NVCC rules and hence is not subject to the “Deemed Retraction” of non-compliant issues issued by banks and insurers”.
You can search for mentions of a particular ticker symbol by typingF, typing the symbol into the search box that appears and clicking the ‘Next’ button on the search box.
And thanks for your subscription!
Thanks, I see it now. I guess the assumption is that bank prefs without NVCC will be retracted at some point.
I guess the assumption is that bank prefs without NVCC will be retracted at some point.
Yes. Although the proper word is “redeemed” [when the ISSUER exercises its option].