US equities were on fire today:
The Dow Jones Industrial Average surged the most since 2011 and the Standard & Poor’s 500 Index capped its best two-day gain in three years as global equities rallied on the Federal Reserve’s pledge to be patient on boosting rates.
The S&P 500 added 2.4 percent to 2,061.23 at 4 p.m. in New York. The index climbed 4.5 percent over two days, the most since November 2011. The Dow gained 421.28 points, or 2.4 percent, to 17,778.15, the biggest one-day jump since December 2011.
Canadian stocks rose, capping the biggest three-day surge in more than three years, as consumer-staples and health-care companies led gains amid a global rally following the Federal Reserve’s pledge to be patient on boosting rates.
Nine of the 10 main groups in the Standard & Poor’s/TSX Composite Index (SPTSX) advanced. Alimentation Couche-Tard Inc. surged 8.3 percent to pace gains in consumer shares, while raw-materials stocks jumped 2.1 percent.
The S&P/TSX Index increased 132.87 points, or 0.9 percent, to 14,346.75 at 4 p.m. in Toronto. The equity gauge has surged 4.7 percent in the past three days, the most since November 2011. The index is up 5.3 percent for the year.
Junk seems to have hit a bottom:
Demand for junk-rated debt is bouncing back from a selloff triggered by plunging oil prices on optimism that the Federal Reserve will be in no rush to raise interest rates next year.
The risk premium on the Markit CDX North American High Yield Index, a credit-default swaps benchmark tied to the debt of 100 speculative-grade companies, declined 14.7 basis points to 354.3 basis points. That follows yesterday’s drop resulting in the biggest two-day decline for the index since January 2013. The average yield on speculative-grade debt contracted for the first time this month on Dec. 17 dropping to 7.1 percent, according to Bank of America Merrill Lynch index data.
Treasuries, not so much:
Treasuries fell, with 10-year note yields rising the most during two days in 17 months, after Federal Reserve Chair Janet Yellen suggested a “patient” approach to interest rates may translate into an increase by the middle of next year.
The yield on the 30-year bond touched the highest level in a week as Yellen said yesterday at a news conference that a rate increase won’t take place for “at least the next couple of meetings.” The difference between two- and 30-year yields widened for the first time in six days as longer-maturity Treasuries led declines. Stocks rose by the most in two years. The Treasury auctioned $16 billion of five-year inflation-indexed securities at the highest yield since April 2010.
…
The benchmark 10-year yield rose seven basis points, or 0.07 percentage point, to 2.21 percent at 4:59 p.m. New York time, according to Bloomberg Bond Trader data. The 2.25 percent note maturing in November 2024 fell 20/32, or $6.25 per $1,000 face amount, to 100 3/8. The yield has increased as much as 17 basis points the past two days, the most since July 2013.
…
Thirty-year bond yields added nine basis points to 2.82 percent, reaching the highest level since Dec. 11. Two-year yields gained one basis point to 0.63 percent.Crude oil futures fell 2.8 percent to $54.89 a barrel in New York, after reaching $53.60 on Dec. 16, a five-year low.
Pay attention to the slope of the yield curve! While FixedResets are more-or-less immune to changes in five-year rates, the yield they pay has to compete with fixed rate perpetual instruments! It is not impossible that at some point there may be a reprise of what happened to Floaters in the Credit Crunch.
And Credit Crunch capital destruction due to housing prices might even be rivalled by capital destruction due to oil prices:
In a stunning analysis this week, Goldman Sachs found almost $1 trillion in investments in future oil projects at risk. They looked at 400 of the world’s largest new oil and gas fields — excluding U.S. shale — and found projects representing $930 billion of future investment that are no longer profitable with Brent crude at $70. In the U.S., the shale-oil party isn’t over yet, but zombies are beginning to crash it.
Switzerland has a problem that many might like to have:
Switzerland’s franc weakened the most in 18 months versus the euro after the nation’s central bank introduced negative interest rates to defend the currency’s cap.
The shared currency fell for a second day against the dollar as the Swiss National Bank decision boosted speculation the European Central Bank will expand stimulus measures next year.
…
The franc weakened against all of its 16 major peers as the Zurich-based SNB introduced a negative deposit rate for the first time since the 1970s, saying it was prepared to buy unlimited foreign currency to shield the 1.20-per-euro cap and take further measures if needed.The Swiss currency appreciated to within 0.07 percent of the cap yesterday, reaching the strongest level since September 2012. Pressure on the cap has bolstered speculation the ECB will start a large-scale sovereign-bond buying program, a measure that may weaken the euro against its peers.
SNB President Thomas Jordan cited turmoil in Russia as a “major contributory factor” to its rate decision.
“If money is moving out of these high-risk geopolitical countries, where do they tend to move this money to? Switzerland,” said FXCM’s Song. The rates move was “a way for the SNB to discourage that.”
Is this what they mean by “captive market“?:
Take [journalist Sarah] Koenig’s 40 hours of taped calls with [prisoner Adnan] Syed, a detail she mentions in the second-to-last episode (the finale makes its debut on Thursday morning). In 2013, the top rate for telephone calls to prisons in the U.S. was 89¢ per minute plus a $3.95 per-call charge, according to data collected by the Federal Communications Commission. At that rate, Koenig and Syed conversations could have easily exceeded $2,500. Representatives for “Serial” and Global Tel-Link declined to comment for this story.
…
The market for inmate phone services is unusual, to say the least. The prisons generally sign exclusive contracts with specialized phone carriers. Instead of competing by offering the lowest-priced calls or the best sound quality, companies such as Global Tel-Link win contracts largely by offering to pay the prisons a portion of the money from inmates’ phone bills. Some carriers pay the prisons up to 96 percent of their call revenue, according to the FCC.
There was a good bounce in the Canadian preferred share market today, with PerpetualDiscounts gaining 13bp, FixedResets up 17bp and DeemedRetractibles winning 37bp. There is yet another very lengthy Performance Highlights list. Volume was on the high side of average.
For as long as the FixedReset market is so violently unsettled, I’ll keep publishing updates of the more interesting and meaningful series of FixedResets’ Implied Volatilities. This doesn’t include Enbridge because although Enbridge has a large number of issues outstanding, all of which are quite liquid, the range of Issue Reset Spreads is too small for decent conclusions. The low is 212bp (ENB.PR.H; second-lowest is ENB.PR.D at 237bp) and the high is a mere 268 for ENB.PF.G.
Remember that all rich /cheap assessments are:
- based on Implied Volatility Theory only
- are relative only to other FixedResets from the same issuer
- assume constant GOC-5 yield
- assume constant Implied Volatility
- assume constant spread
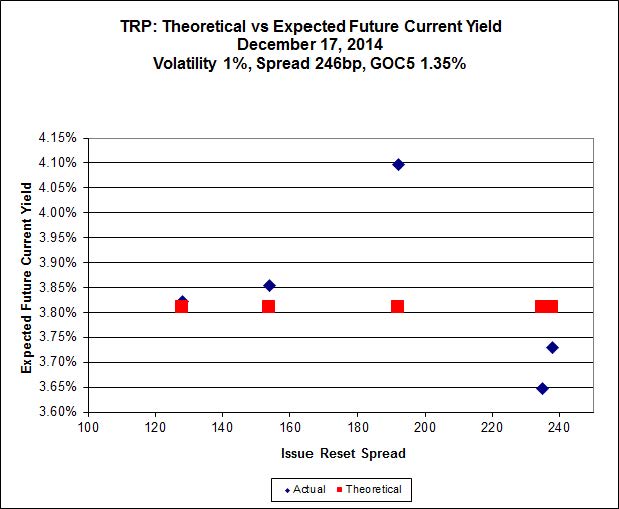
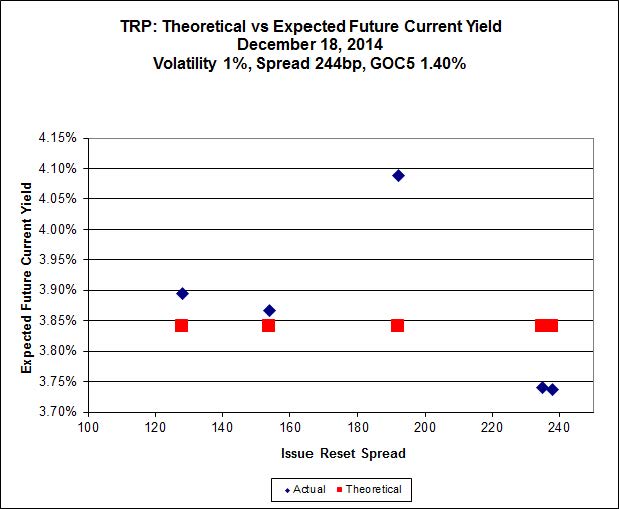
Here’s TRP:
Click for Big
So according to this, TRP.PR.A, bid at 20.30, is $1.31 cheap, but it has already reset (at +192). TRP.PR.D, bid at 25.29 and resetting at +238bp on 2019-4-30 is $0.68 rich and TRP.PR.E, bid at 25.06 and resetting at +235bp on 2019-10-30, is $0.65 rich.
Click for Big
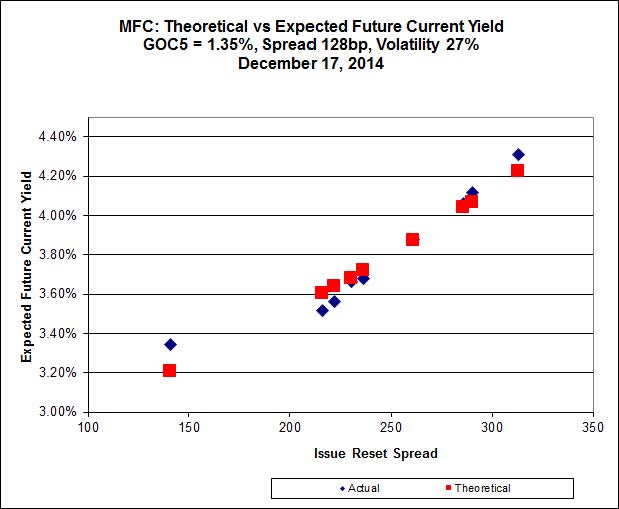
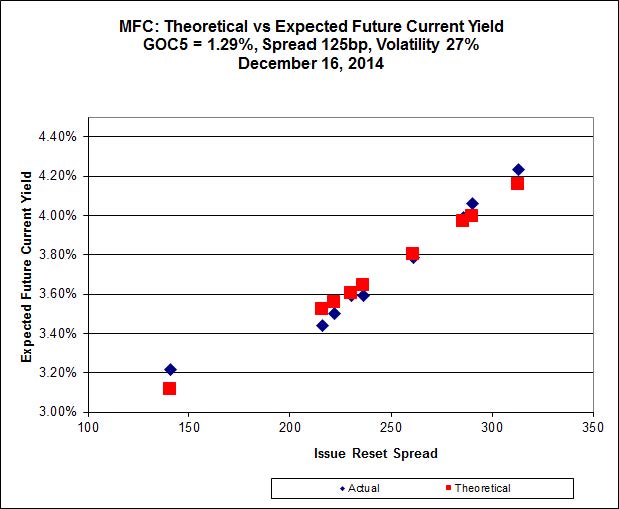
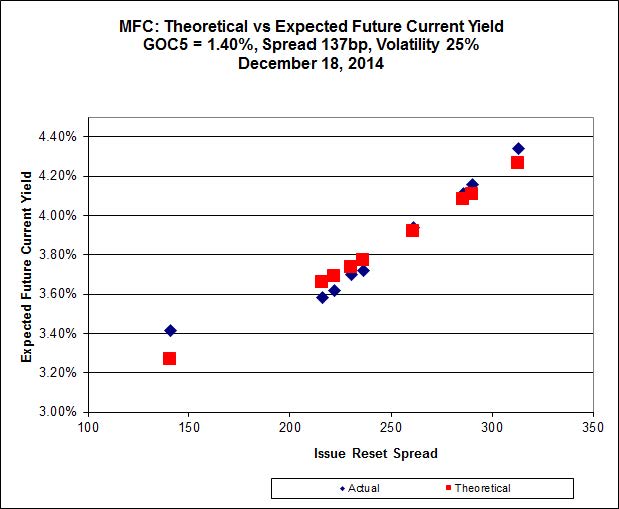
It looks like MFC.PR.F, resetting at 141bp on 2016-06-19 is in another world and distorting results again. It’s the only deep-discount issue, bid at 20.65 – everything else is above or near par.
Click for Big
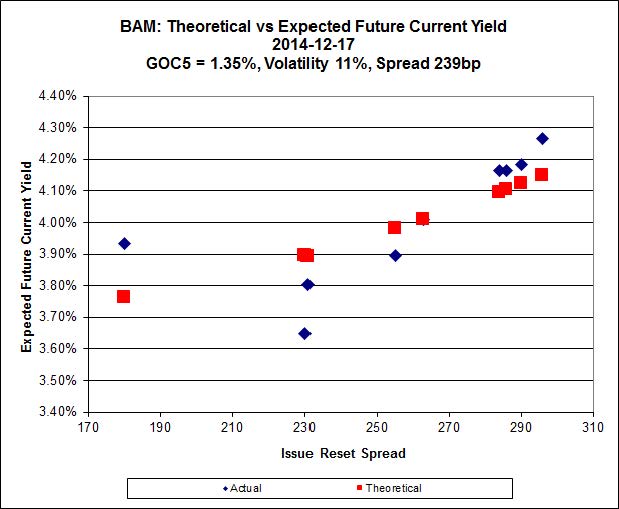
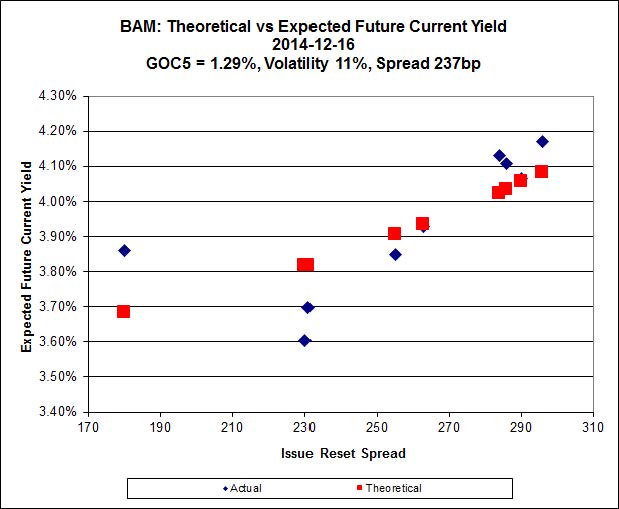
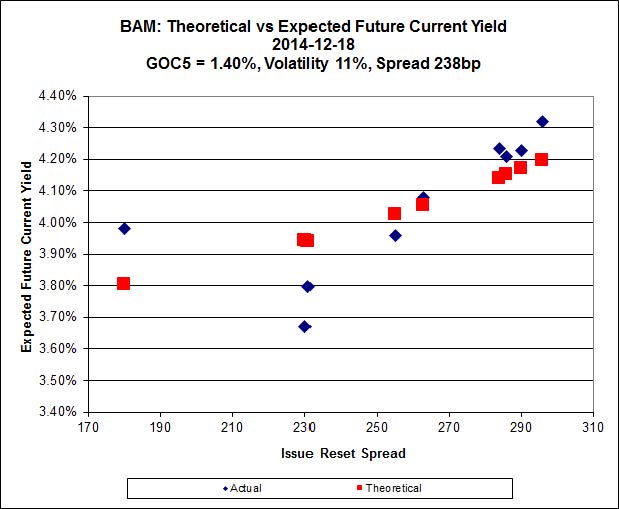
There continues to be extraordinary cheapness in the lowest-spread issue, BAM.PR.X, resetting at +180bp on 2017-6-30, which is bid at 20.10 and appears to be $0.93 cheap, while BAM.PR.R, resetting at +230bp 2016-6-30 is bid at 25.20 and appears to be $1.73 rich.

Click for Big
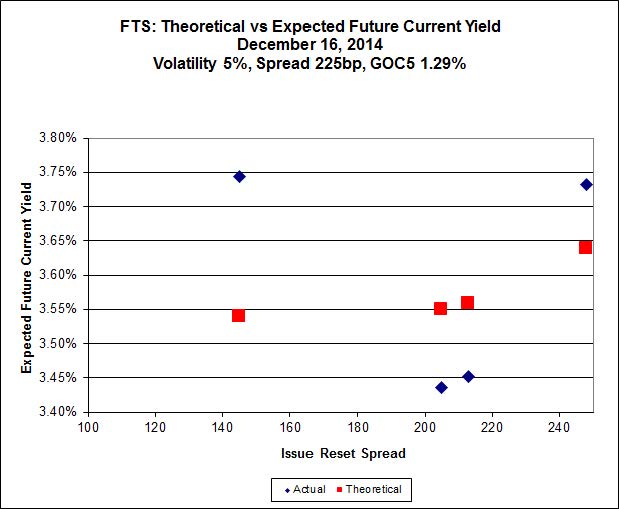
This is just weird because the middle is expensive and the ends are cheap but anyway … FTS.PR.H, with a spread of +145bp, and bid at 18.31, looks $1.37 cheap and resets 2015-6-1. FTS.PR.K, with a spread of +205bp, and bid at 24.85, looks $1.11 expensive and resets 2019-3-1
Click for Big
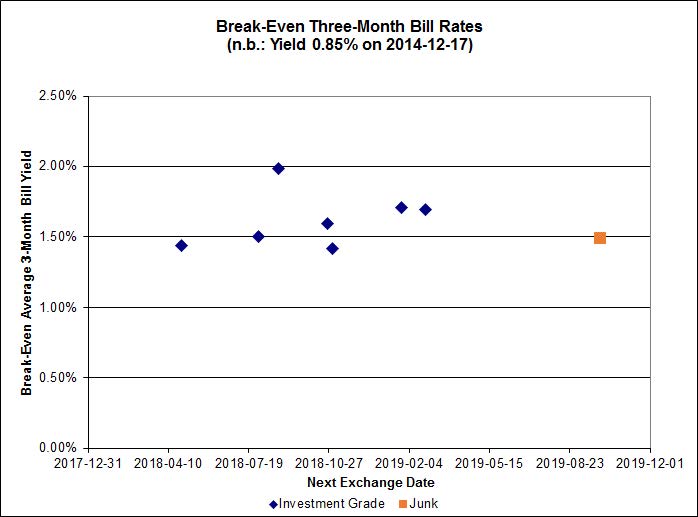
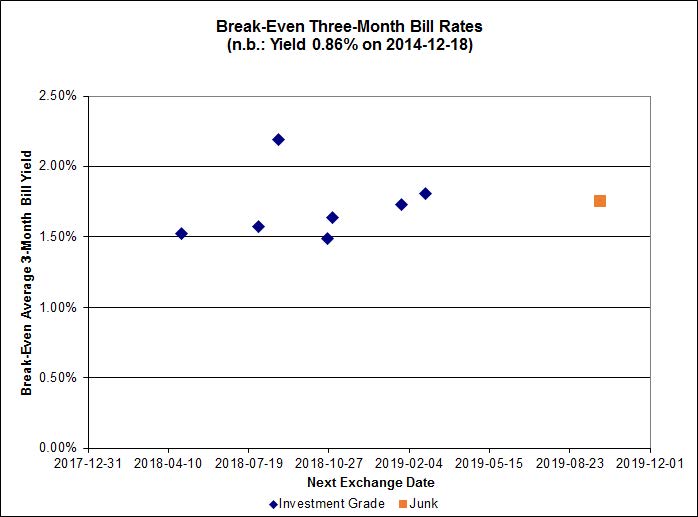
The average break-even rate has declined from 1.80%-2.00% at the time recent conversion decisions were made to a current range of 1.50%-1.70%. This decline means that the estimated profit on TRP.PR.A conversion has declined from $0.48 to a mere $0.16 (at the lower end of the range).
| HIMIPref™ Preferred Indices These values reflect the December 2008 revision of the HIMIPref™ Indices Values are provisional and are finalized monthly |
|||||||
| Index | Mean Current Yield (at bid) |
Median YTW |
Median Average Trading Value |
Median Mod Dur (YTW) |
Issues | Day’s Perf. | Index Value |
| Ratchet | 0.00 % | 0.00 % | 0 | 0.00 | 0 | -0.7600 % | 2,450.8 |
| FixedFloater | 0.00 % | 0.00 % | 0 | 0.00 | 0 | -0.7600 % | 3,880.1 |
| Floater | 3.09 % | 3.14 % | 65,153 | 19.39 | 4 | -0.7600 % | 2,605.3 |
| OpRet | 4.41 % | -2.93 % | 27,667 | 0.08 | 2 | 0.0589 % | 2,748.8 |
| SplitShare | 4.30 % | 4.03 % | 41,093 | 3.71 | 5 | -0.1109 % | 3,182.3 |
| Interest-Bearing | 0.00 % | 0.00 % | 0 | 0.00 | 0 | 0.0589 % | 2,513.5 |
| Perpetual-Premium | 5.44 % | 0.13 % | 73,767 | 0.09 | 20 | 0.1569 % | 2,475.6 |
| Perpetual-Discount | 5.22 % | 5.13 % | 110,103 | 15.19 | 15 | 0.1268 % | 2,637.8 |
| FixedReset | 4.27 % | 3.61 % | 249,079 | 16.56 | 77 | 0.1731 % | 2,513.4 |
| Deemed-Retractible | 4.99 % | 2.78 % | 99,638 | 0.28 | 40 | 0.3651 % | 2,606.8 |
| FloatingReset | 2.56 % | 2.12 % | 64,099 | 3.44 | 5 | 0.2922 % | 2,539.0 |
| Performance Highlights | |||
| Issue | Index | Change | Notes |
| PWF.PR.A | Floater | -5.36 % | This is reasonably real, but on very low volume. Total volume was 1,669 shares, which started the day at 19.26, but there was a trade at 3:06pm for 200 shares at 18.27 and an odd-lot at 18.26. The last quote was 18.00-19.00. YTW SCENARIO Maturity Type : Limit Maturity Maturity Date : 2044-12-18 Maturity Price : 18.00 Evaluated at bid price : 18.00 Bid-YTW : 2.93 % |
| TRP.PR.E | FixedReset | -1.18 % | YTW SCENARIO Maturity Type : Limit Maturity Maturity Date : 2044-12-18 Maturity Price : 23.19 Evaluated at bid price : 25.06 Bid-YTW : 3.70 % |
| ENB.PR.J | FixedReset | -1.05 % | YTW SCENARIO Maturity Type : Limit Maturity Maturity Date : 2044-12-18 Maturity Price : 22.60 Evaluated at bid price : 23.50 Bid-YTW : 4.22 % |
| TRP.PR.D | FixedReset | 1.16 % | YTW SCENARIO Maturity Type : Limit Maturity Maturity Date : 2044-12-18 Maturity Price : 23.31 Evaluated at bid price : 25.29 Bid-YTW : 3.61 % |
| FTS.PR.H | FixedReset | 1.16 % | YTW SCENARIO Maturity Type : Limit Maturity Maturity Date : 2044-12-18 Maturity Price : 18.31 Evaluated at bid price : 18.31 Bid-YTW : 3.83 % |
| BAM.PR.C | Floater | 1.22 % | YTW SCENARIO Maturity Type : Limit Maturity Maturity Date : 2044-12-18 Maturity Price : 16.65 Evaluated at bid price : 16.65 Bid-YTW : 3.15 % |
| SLF.PR.B | Deemed-Retractible | 1.25 % | YTW SCENARIO Maturity Type : Hard Maturity Maturity Date : 2025-01-31 Maturity Price : 25.00 Evaluated at bid price : 24.31 Bid-YTW : 5.16 % |
| TRP.PR.C | FixedReset | 1.39 % | YTW SCENARIO Maturity Type : Limit Maturity Maturity Date : 2044-12-18 Maturity Price : 19.01 Evaluated at bid price : 19.01 Bid-YTW : 3.91 % |
| BAM.PR.K | Floater | 1.52 % | YTW SCENARIO Maturity Type : Limit Maturity Maturity Date : 2044-12-18 Maturity Price : 16.70 Evaluated at bid price : 16.70 Bid-YTW : 3.14 % |
| BAM.PR.T | FixedReset | 1.58 % | YTW SCENARIO Maturity Type : Limit Maturity Maturity Date : 2044-12-18 Maturity Price : 23.29 Evaluated at bid price : 24.43 Bid-YTW : 3.73 % |
| SLF.PR.E | Deemed-Retractible | 1.62 % | YTW SCENARIO Maturity Type : Hard Maturity Maturity Date : 2025-01-31 Maturity Price : 25.00 Evaluated at bid price : 23.20 Bid-YTW : 5.44 % |
| SLF.PR.D | Deemed-Retractible | 1.63 % | YTW SCENARIO Maturity Type : Hard Maturity Maturity Date : 2025-01-31 Maturity Price : 25.00 Evaluated at bid price : 23.12 Bid-YTW : 5.43 % |
| SLF.PR.C | Deemed-Retractible | 1.63 % | YTW SCENARIO Maturity Type : Hard Maturity Maturity Date : 2025-01-31 Maturity Price : 25.00 Evaluated at bid price : 23.11 Bid-YTW : 5.44 % |
| IGM.PR.B | Perpetual-Premium | 1.71 % | YTW SCENARIO Maturity Type : Call Maturity Date : 2017-12-31 Maturity Price : 25.25 Evaluated at bid price : 26.16 Bid-YTW : 4.85 % |
| TRP.PR.A | FixedReset | 1.75 % | YTW SCENARIO Maturity Type : Limit Maturity Maturity Date : 2044-12-18 Maturity Price : 20.30 Evaluated at bid price : 20.30 Bid-YTW : 4.00 % |
| SLF.PR.A | Deemed-Retractible | 1.77 % | YTW SCENARIO Maturity Type : Hard Maturity Maturity Date : 2025-01-31 Maturity Price : 25.00 Evaluated at bid price : 24.20 Bid-YTW : 5.17 % |
| PWF.PR.P | FixedReset | 1.96 % | YTW SCENARIO Maturity Type : Limit Maturity Maturity Date : 2044-12-18 Maturity Price : 20.81 Evaluated at bid price : 20.81 Bid-YTW : 3.64 % |
| MFC.PR.B | Deemed-Retractible | 2.58 % | YTW SCENARIO Maturity Type : Hard Maturity Maturity Date : 2025-01-31 Maturity Price : 25.00 Evaluated at bid price : 23.84 Bid-YTW : 5.28 % |
| Volume Highlights | |||
| Issue | Index | Shares Traded |
Notes |
| CM.PR.P | FixedReset | 364,622 | Recent new issue. YTW SCENARIO Maturity Type : Limit Maturity Maturity Date : 2044-12-18 Maturity Price : 23.05 Evaluated at bid price : 24.70 Bid-YTW : 3.54 % |
| BMO.PR.S | FixedReset | 205,009 | Desjardins bought blocks of 10,000 and 28,900 from Scotia at 25.53, then another 20,000 at 25.51. Desjardins then crossed 75,000 at 25.53 and bought 25,300 from RBC at the same price. YTW SCENARIO Maturity Type : Limit Maturity Maturity Date : 2044-12-18 Maturity Price : 23.36 Evaluated at bid price : 25.50 Bid-YTW : 3.51 % |
| TD.PF.C | FixedReset | 141,790 | Recent new issue. YTW SCENARIO Maturity Type : Limit Maturity Maturity Date : 2044-12-18 Maturity Price : 23.06 Evaluated at bid price : 24.74 Bid-YTW : 3.53 % |
| MFC.PR.M | FixedReset | 90,100 | Scotia crossed blocks of 50,000 and 29,000, both at 25.15. YTW SCENARIO Maturity Type : Call Maturity Date : 2019-12-19 Maturity Price : 25.00 Evaluated at bid price : 25.27 Bid-YTW : 3.68 % |
| ENB.PR.F | FixedReset | 83,698 | Nesbitt bought 30,400 from GMP at 22.60, then crossed 25,000 at the same price. YTW SCENARIO Maturity Type : Limit Maturity Maturity Date : 2044-12-18 Maturity Price : 22.20 Evaluated at bid price : 22.70 Bid-YTW : 4.24 % |
| BMO.PR.Q | FixedReset | 67,833 | Nesbitt bought 55,200 from GMP at 23.90. YTW SCENARIO Maturity Type : Hard Maturity Maturity Date : 2022-01-31 Maturity Price : 25.00 Evaluated at bid price : 24.06 Bid-YTW : 3.46 % |
| There were 35 other index-included issues trading in excess of 10,000 shares. | |||
| Wide Spread Highlights | ||
| Issue | Index | Quote Data and Yield Notes |
| PWF.PR.A | Floater | Quote: 18.00 – 19.00 Spot Rate : 1.0000 Average : 0.6943 YTW SCENARIO |
| ELF.PR.H | Perpetual-Premium | Quote: 25.39 – 26.00 Spot Rate : 0.6100 Average : 0.4119 YTW SCENARIO |
| TRP.PR.E | FixedReset | Quote: 25.06 – 25.50 Spot Rate : 0.4400 Average : 0.3003 YTW SCENARIO |
| NEW.PR.D | SplitShare | Quote: 32.14 – 33.00 Spot Rate : 0.8600 Average : 0.7370 YTW SCENARIO |
| GWO.PR.P | Deemed-Retractible | Quote: 25.41 – 25.90 Spot Rate : 0.4900 Average : 0.3782 YTW SCENARIO |
| FTS.PR.J | Perpetual-Discount | Quote: 23.78 – 24.50 Spot Rate : 0.7200 Average : 0.6131 YTW SCENARIO |