Archive for January, 2011

January 12, 2011

Wednesday, January 12th, 2011

Mark White of OSFI gave a speech titled Basel III: Balancing of Risk and Regulation, in which he said nothing at all.

There’s one one big problem with simple stock screens:

Claymore’s Canadian Dividend exchange-traded fund (CDZ-T …) is designed to track the S&P/TSX Canadian Dividend Aristocrats Index, which is composed of companies that have paid higher dividends for at least five consecutive calendar years.

It’s a great concept. Trouble is, the financial crisis prompted a lot of companies to conserve cash by cutting dividends or holding them steady, and that’s caused the index to shrink dramatically.

However, unlike the iShares ETF, the Claymore fund no longer has any Canadian banks or insurers.

Some are cheering the results of Portugal’s 10-year auction:

The markets heaved a hefty sigh of release today as Portugal pulled off a widely-watched auction of 10-year bonds, €599-million worth at a lower-than-expected yield of 6.716 per cent, below the key level of 7 per cent. It also sold four-year bonds, bringing the todal to €1.25-billion.

Together, Portugal, Ireland and Spain have needs this year of about €300-billion, a combination of maturing debt and additional funding needed to cover deficits, [Scotia economist] Mr. [Derek] Holt calculated.

It’s not apparent just how much yield the recent ECB purchases are worth:

The weekly amount compares with 164 million euros spent the previous week although the figures may not give the full picture as the ECB’s purchases take 2-3 days to be finalised.

The ECB threw Portugal a temporary lifeline on Monday by buying up its bonds, traders said, as market and peer pressure mounted for Lisbon to seek an international bailout soon.

Official disrespect for due process is reaching epidemic proportions:

Ten municipalities in the Lower Mainland have safety inspection programs that send inspectors armed with B.C. Hydro statistics on abnormal energy consumption into homes.

Critics say the safety inspections are a substitute for police raids of suspected grow-ops. Police cannot enter a home without reasonable grounds for believing that they will find illegal activity. However, safety inspectors can just go in and look around. If they find a grow-op, they call police, who are usually waiting at the curb.

And why? Here’s one potential answer:

Municipalities could end up reaping millions of dollars if given 50 per cent of assets seized under proceeds-of-crime legislation, Kevin Falcon said Tuesday.

“I think it’s a great opportunity to involve municipalities in a partnership way going after illegal criminal activity,” Mr. Falcon told reporters.

Mr. Falcon’s commitment is part of a 12-point crime platform released by the former health minister, who is seeking the leadership of the B.C. Liberals in a party vote Feb. 26 that will choose the province’s next premier.

It was a mixed day on above average volume for the Canadian preferred share market, with PerpetualDiscounts gaining 16bp and FixedResets losing 2bp. There was quite a bit of block trading done and not much volatility, with again only one entry in the Performance Highlights Table.

Block trading was dominated by Desjardins, which wrote some very nice-sized tickets. Note that this does not necessarily mean they earned good money on the crosses – some of them could have been internal crosses (with a single manager shuffling issues around his portfolios; not something that should cost a lot of money).

PerpetualDiscounts now yield 5.43%, equivalent to 7.60% interest at the standard equivalency factor of 1.4x. Long Corporates now yield about 5.5% (maybe a bit less) so the pre-tax interest-equivalent spread (also called the Seniority Spread) is now about 210bp, with everything unchanged from the figures reported January 5.

HIMIPref™ Preferred Indices
These values reflect the December 2008 revision of the HIMIPref™ Indices

Values are provisional and are finalized monthly
Index Mean
Current
Yield
(at bid)
Median
YTW
Median
Average
Trading
Value
Median
Mod Dur
(YTW)
Issues Day’s Perf. Index Value
Ratchet 0.00 % 0.00 % 0 0.00 0 -0.1102 % 2,322.1
FixedFloater 4.79 % 3.46 % 28,438 19.21 1 0.3575 % 3,554.7
Floater 2.58 % 2.36 % 45,159 21.32 4 -0.1102 % 2,507.2
OpRet 4.81 % 3.36 % 67,445 2.31 8 -0.1492 % 2,388.6
SplitShare 5.33 % 1.76 % 589,078 0.90 4 -0.1104 % 2,452.7
Interest-Bearing 0.00 % 0.00 % 0 0.00 0 -0.1492 % 2,184.1
Perpetual-Premium 5.66 % 5.26 % 132,211 5.19 20 0.1340 % 2,026.3
Perpetual-Discount 5.39 % 5.43 % 238,474 14.80 57 0.1550 % 2,051.6
FixedReset 5.24 % 3.43 % 288,432 3.07 52 -0.0245 % 2,271.6
Performance Highlights
Issue Index Change Notes
SLF.PR.G FixedReset -1.48 % YTW SCENARIO
Maturity Type : Limit Maturity
Maturity Date : 2041-01-12
Maturity Price : 25.22
Evaluated at bid price : 25.27
Bid-YTW : 3.96 %
Volume Highlights
Issue Index Shares
Traded
Notes
MFC.PR.A OpRet 705,931 Desjardins crossed 697,700 at 25.65. Nice ticket!
YTW SCENARIO
Maturity Type : Soft Maturity
Maturity Date : 2015-12-18
Maturity Price : 25.00
Evaluated at bid price : 25.72
Bid-YTW : 3.54 %
TD.PR.M OpRet 700,021 Desjardins crossed 694,800 at 25.56.
YTW SCENARIO
Maturity Type : Call
Maturity Date : 2011-05-30
Maturity Price : 25.50
Evaluated at bid price : 25.56
Bid-YTW : 3.40 %
TD.PR.N OpRet 392,100 Desjardins crossed 389,700 at 25.56.
YTW SCENARIO
Maturity Type : Call
Maturity Date : 2011-05-30
Maturity Price : 25.50
Evaluated at bid price : 25.56
Bid-YTW : 3.32 %
BAM.PR.B Floater 362,156 RBC crossed 35,000 at 18.63; Desjardins crossed 308,400 at 18.40.
YTW SCENARIO
Maturity Type : Limit Maturity
Maturity Date : 2041-01-12
Maturity Price : 18.45
Evaluated at bid price : 18.45
Bid-YTW : 2.86 %
SLF.PR.D Perpetual-Discount 156,169 Desjardins crossed 149,600 at 20.68.
YTW SCENARIO
Maturity Type : Limit Maturity
Maturity Date : 2041-01-12
Maturity Price : 20.66
Evaluated at bid price : 20.66
Bid-YTW : 5.43 %
GWO.PR.I Perpetual-Discount 143,382 TD crossed 10,000 at 21.70; Desjardins crossed 123,800 at 21.69.
YTW SCENARIO
Maturity Type : Limit Maturity
Maturity Date : 2041-01-12
Maturity Price : 21.46
Evaluated at bid price : 21.73
Bid-YTW : 5.20 %
CM.PR.D Perpetual-Premium 121,745 Nesbitt crossed blocks of 19,200 and 100,000, both at 25.25.
YTW SCENARIO
Maturity Type : Call
Maturity Date : 2011-05-30
Maturity Price : 25.25
Evaluated at bid price : 25.33
Bid-YTW : 4.13 %
TD.PR.I FixedReset 120,496 Desjardins crossed blocks of 50,000 and 49,800, both at 27.40.
YTW SCENARIO
Maturity Type : Call
Maturity Date : 2014-08-30
Maturity Price : 25.00
Evaluated at bid price : 27.31
Bid-YTW : 3.48 %
RY.PR.X FixedReset 106,005 Scotia crossed 50,000 at 27.65. RBC crossed blocks of 23,100 and 25,000, both at 27.66.
YTW SCENARIO
Maturity Type : Call
Maturity Date : 2014-09-23
Maturity Price : 25.00
Evaluated at bid price : 27.66
Bid-YTW : 3.47 %
TD.PR.A FixedReset 103,815 Desjardins crossed blocks of 50,000 and 49,400, both at 26.40.
YTW SCENARIO
Maturity Type : Call
Maturity Date : 2014-03-02
Maturity Price : 25.00
Evaluated at bid price : 26.32
Bid-YTW : 3.10 %
There were 34 other index-included issues trading in excess of 10,000 shares.

January 11, 2011

Tuesday, January 11th, 2011

It had to come. Credit Suisse is starting a new Exchange targetting clients who are little girls:

The venue, Light Pool, will be the first U.S. electronic communications network to be started in five years. The ECN is aimed at institutional investors such as mutual funds, hedge funds, pensions and endowments. Unlike existing exchanges, Light Pool will employ a system to classify users by how they trade as a way to set prices and keep out unwanted speculators.

Development of Light Pool began a year ago as a hedge against potential regulatory restrictions on dark pools. The chief executive officers of exchange operators such as New York- based NYSE Euronext and Nasdaq OMX Group Inc. have urged the SEC to impose more requirements on dark pools, which grew to more than 12 percent of equities trading in November, from less than 9 percent two years earlier, data from Rosenblatt show.

As its regulatory concerns diminished in 2010, Credit Suisse switched its focus to creating a public displayed market for institutional investors worried they weren’t getting optimal executions on exchanges that cater to high-frequency firms.

The broker’s clients and firms accessing Light Pool directly will be automatically classified based on an initial period of trading behavior and placed in one of three categories: contributors, neutral users and opportunistic traders. The criteria for defining a firm will be automated and objective, “with no human intermediation,” as is required for public markets, Galinov said. The aim is to determine whether firms are systematically profiting from their trading activity in ways that could hurt institutional clients, he said.

Opportunistic firms, which Galinov says include some high- frequency trading companies, will be kicked off the platform and prevented from providing orders or executing against bids and offers directly through Light Pool. They’ll instead have to go through the Jersey City, New Jersey-based National Stock Exchange, where Light Pool will also publish its quotes.

Meanwhile, the UK is showing the world how to compete:

Chancellor of the Exchequer George Osborne said he’ll push Britain’s biggest banks to follow state- controlled Royal Bank of Scotland Group Plc in awarding lower bonuses in 2011 and left open the possibility of further action.

Prime Minister David Cameron’s coalition faces the same problem as the previous Labour administration after its 2008 rescue of the banks. The government needs lenders it has stakes in — such as RBS — to succeed, which means paying competitive salaries, while it can’t directly control the compensation paid by other banks — such as Barclays.

If you can’t beat ’em – legislate ’em!

Volume picked up to above average on a good day for the Canadian preferred share market. PerpetualDiscounts were up 18bp, while FixedResets gained 8bp. There was, again, only a lone entry in the Performance Table – and that’s the same issue as yesterday, reversing itself.

HIMIPref™ Preferred Indices
These values reflect the December 2008 revision of the HIMIPref™ Indices

Values are provisional and are finalized monthly
Index Mean
Current
Yield
(at bid)
Median
YTW
Median
Average
Trading
Value
Median
Mod Dur
(YTW)
Issues Day’s Perf. Index Value
Ratchet 0.00 % 0.00 % 0 0.00 0 0.1964 % 2,324.6
FixedFloater 4.75 % 3.48 % 28,341 18.97 1 0.6593 % 3,542.0
Floater 2.57 % 2.37 % 45,277 21.28 4 0.1964 % 2,510.0
OpRet 4.81 % 3.35 % 67,349 2.31 8 0.0482 % 2,392.1
SplitShare 5.32 % 1.32 % 608,781 0.91 4 0.2365 % 2,455.4
Interest-Bearing 0.00 % 0.00 % 0 0.00 0 0.0482 % 2,187.4
Perpetual-Premium 5.66 % 5.30 % 133,542 5.20 20 -0.0335 % 2,023.6
Perpetual-Discount 5.40 % 5.43 % 238,951 14.78 57 0.1812 % 2,048.4
FixedReset 5.24 % 3.39 % 285,699 3.08 52 0.0801 % 2,272.2
Performance Highlights
Issue Index Change Notes
BAM.PR.I OpRet 1.02 % YTW SCENARIO
Maturity Type : Call
Maturity Date : 2011-02-10
Maturity Price : 25.50
Evaluated at bid price : 25.71
Bid-YTW : -2.62 %
Volume Highlights
Issue Index Shares
Traded
Notes
BMO.PR.L Perpetual-Premium 96,410 Nesbitt crossed 45,000 at 25.85; Desjardins crossed 11,000 at the same price. Nesbitt bought 19,500 from TD at the same price again.
YTW SCENARIO
Maturity Type : Call
Maturity Date : 2017-06-24
Maturity Price : 25.00
Evaluated at bid price : 25.81
Bid-YTW : 5.38 %
TD.PR.C FixedReset 93,517 Nesbitt crossed 50,000 at 26.75; Desjardins crossed 30,000 at the same price.
YTW SCENARIO
Maturity Type : Call
Maturity Date : 2014-03-02
Maturity Price : 25.00
Evaluated at bid price : 26.63
Bid-YTW : 3.28 %
TD.PR.Y FixedReset 75,700 Nesbitt crossed 50,000 at 26.40; Desjardins crossed 19,400 at the same price.
YTW SCENARIO
Maturity Type : Call
Maturity Date : 2013-11-30
Maturity Price : 25.00
Evaluated at bid price : 26.36
Bid-YTW : 2.95 %
CM.PR.D Perpetual-Premium 74,781 Nesbitt crossed 60,000 at 25.25.
YTW SCENARIO
Maturity Type : Call
Maturity Date : 2012-05-30
Maturity Price : 25.00
Evaluated at bid price : 25.18
Bid-YTW : 5.01 %
CM.PR.H Perpetual-Discount 70,160 Nesbitt cossed 60,000 at 22.80.
YTW SCENARIO
Maturity Type : Limit Maturity
Maturity Date : 2041-01-11
Maturity Price : 22.60
Evaluated at bid price : 22.80
Bid-YTW : 5.27 %
BAM.PR.B Floater 70,072 TD cossed 50,000 at 18.68; Desjardins crossed 15,000 at 18.63.
YTW SCENARIO
Maturity Type : Limit Maturity
Maturity Date : 2041-01-11
Maturity Price : 18.60
Evaluated at bid price : 18.60
Bid-YTW : 2.84 %
There were 38 other index-included issues trading in excess of 10,000 shares.

EC: L'etat, C'est Nous

Tuesday, January 11th, 2011

The European Commission has released a new package of proposals aimed at eliminating that pesky rule-of-law thing with respect to insolvent banks.

The press release emphasizes that the decisions have been made:

Currently, there are very few rules at EU level which determine which actions can and should be taken by authorities when banks fail and, for reasons of financial stability, cannot be wound up under ordinary insolvency rules. This consultation seeks input on the technical details underpinning the policy issues identified in the Communication of 20 October 2010.

For instance, they are going to give themselves:

resolution tools which empower authorities to take the necessary action, where bank failure cannot be avoided, to manage that failure in an orderly way such as powers to transfer assets and liabilities of a failing bank to another institution or to a bridge bank, and to write down debt of a failing bank to strengthen its financial position and allow it to continue as a going concern subject to appropriate restructuring

Well, I guess we should be pleased that they’re only going to take “necessary” actions, and that all restructurings will be “appropriate”. We can also celebrate the assurance that all burden sharing will be fair:

Fair burden sharing by means of financing mechanisms which avoid use of taxpayer funds. This might include possible mechanisms to write down appropriate classes of the debt of a failing bank to ensure that its creditors bear losses. Any such proposals would not apply to existing bank debt currently in issue. It also includes setting up resolution funds financed by bank contributions. In particular the Consultation seeks views on how a mechanism for debt write down (or ‘bail-in’) might be best achieved, and on the feasibility of merging deposit guarantee funds with resolution funds.

The published FAQs note:

9. What is the proposal to write down creditors (‘bail in’) and how would it work?

The objective is to develop a mechanism for recapitalising failing institutions so that it can continue to provide essential services, without the need for bail out by public funds. Fast recapitalisation would allow the institution to continue as a going concern, avoiding the disruption to the financial system that would be caused by stopping or interrupting its critical services, and giving the authorities time to reorganise it or wind down parts of its business in an orderly manner. In the process, shareholders should be wiped out or severely diluted, and culpable management should be replaced. The consultation seeks views on two broad approaches to achieving this objective.

The first approach would involve a broad statutory power for authorities to write down or convert unsecured debt, including senior debt (subject to the possible exclusions for certain classes of senior debt that may be necessary to preserve the proper functioning of credit markets). It is not envisaged that such a power would apply to existing debt that is currently in issue, as that could be disruptive.

The second approach would require banks to issue a fixed amount of ‘bail-in’ debt that could be written off or converted into equity on a specified trigger linked to the failure of the bank. This requirement would be phased in over an appropriate period and, again, it is not envisaged that any existing debt already in issue would be subject to write down.

Unsurprisingly, the arbitrary nature of this plan is under attack:

In one scenario under consideration, regulators may get the power to write down or convert senior debt, with possible exceptions “to ensure proper functioning of credit markets.” These exceptions may include deposits, secured debt such as covered bonds, short-term debt, and well as trades in derivatives and certain other financial instruments, the commission said.

Another option is to force banks to issue a fixed amount of bonds with contracts stating that they could be written down or converted if certain conditions are met.

‘Danger’

This second option “will give much more clarity and certainty, as banks, regulators and investors will have to address the issues explicitly in advance,” PricewaterhouseCoopers LLP director Patrick Fell said. “There is a danger otherwise that we wait until problems emerge” to clarify how so-called bail-ins, in which investors contribute to shoring up banks in difficulty, would work in practice.

Writedowns or conversions would apply only to debt issued after the measures become law, the commission said.

The idea of bail-ins of all senior debt holders is “an incredibly complicated, difficult and ultimately very politically sensitive thing to do,” Bob Penn, a lawyer at Allen & Overy LLP in London, said in a telephone interview. “It feels to me like an entirely unworkable option,” he said.

Lapdog Carney will be pleased: he’s been urging the elimination of bondholder rights for some time.

What will be most interesting is to see how the European banks finance themselves after these measures become law. I, for one, would be a little leery of investing in financial instruments subject to arbitrary write-down, and that don’t have three hundred years of bankruptcy law behind them – and demand a spread to compensate for the extra uncertainty.

January 10, 2011

Monday, January 10th, 2011

The situation in Europe is slowly getting worse:

The cost of insuring against default on European sovereign debt climbed to records and European stocks fell amid concern Portugal is next in line for a bailout. Portuguese securities reversed declines after three traders with knowledge of the deals said the ECB purchased the government’s bonds.

With European governments including Portugal and Spain due to borrow at least $43 billion this week, attention is shifting to whether Europe is doing enough to stem the crisis. Chancellor Angela Merkel was today forced to deny that Germany was pushing Portugal to seek a bailout to alleviate the market pressure.

The cost of insuring Portuguese bonds against default rose to a record today, while Belgian and Spanish bonds declined on funding concerns. The benchmark Stoxx Europe 600 Index lost 0.9 percent to 278.48 at the 4:30 p.m. close in London, the biggest drop since Dec. 30.

For the first time, investors view western European government bonds as riskier than emerging-market debt, the Markit iTraxx SovX Western Europe Index of credit-default swaps showed last week.

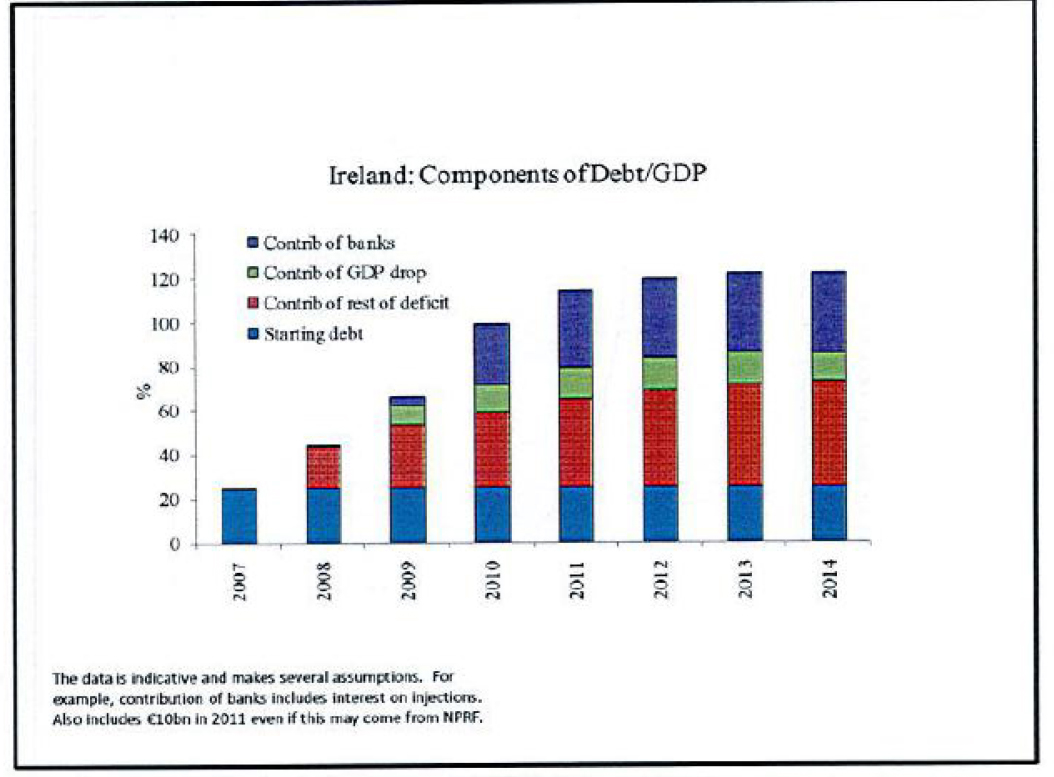
Mr Patrick Honohan, Governor of the Central Bank of Ireland, gave a speech:

The current impact of the banking losses on the economy is not so much via the net long-term taxpayer cost, but comes mainly as a result of the accumulation of debt. The jump in debt associated with these losses is of the same order of magnitude as the rest of the borrowing 2009–10 (Fig. 4). Either of these components would have been unproblematic, together they make the markets and the rating agencies nervous. The fiscal adjustment could possibly have been delayed by a year or two had it not been for the banking losses; now it cannot wait.


Click for big

Sell-side analysis has been worse than usual lately:

Companies in the Standard & Poor’s 500 Index that analysts loved the most rose 73 percent on average since the benchmark for U.S. equity started to recover in March 2009, while those with the fewest “buy” recommendations gained 165 percent, according to data compiled by Bloomberg. Now, banks’ favorites include retailers and restaurant chains, the industry that did best in last year’s rally and that are more expensive than the S&P 500 compared with their estimated 2011 profits.

The brokerage houses are great for data and a good source of ideas. Actionable investment recommendations… not so much.

In another example of “gotcha regulation”, the SEC has commenced proceedings to enforce Rule 105 of Regulation M:

Rule 105 of Regulation M of the Exchange Act provides, in pertinent part:
In connection with an offering of equity securities for cash pursuant to a registration statement. . . filed under the Securities Act of 1933 (“offered securities”), it shall be unlawful for any person to sell short . . . the security that is the subject of the offering and purchase the offered securities from an underwriter or broker or dealer participating in the offering if such short sale was effected during the period (“Rule 105 restricted period”) that is the shorter of the period: (1) Beginning five business days before the pricing of the offered securities; or (2) Beginning with the initial filing of such registration statement . . . and ending with the pricing. … Rule 105 of Regulation M is designed to protect the independent pricing mechanism of the securities market shortly before follow-on or secondary offerings.

For the life of me, I can’t make out why this rule exists, or what useful purpose it might serve.

Bernanke scolded Congress:

However, an important part of the federal budget deficit appears to be structural rather than cyclical; that is, the deficit is expected to remain unsustainably elevated even after economic conditions have returned to normal. For example, under the Congressional Budget Office’s (CBO) so-called alternative fiscal scenario, which assumes that most of the tax cuts enacted in 2001 and 2003 are made permanent and that discretionary spending rises at the same rate as the gross domestic product (GDP), the deficit is projected to fall from its current level of about 9 percent of GDP to 5 percent of GDP by 2015, but then to rise to about 6–1/2 percent of GDP by the end of the decade. In subsequent years, the budget outlook is projected to deteriorate even more rapidly, as the aging of the population and continued growth in health spending boost federal outlays on entitlement programs. Under this scenario, federal debt held by the public is projected to reach 185 percent of the GDP by 2035, up from about 60 percent at the end of fiscal year 2010.

The CBO projections, by design, ignore the adverse effects that such high debt and deficits would likely have on our economy. But if government debt and deficits were actually to grow at the pace envisioned in this scenario, the economic and financial effects would be severe. Diminishing confidence on the part of investors that deficits will be brought under control would likely lead to sharply rising interest rates on government debt and, potentially, to broader financial turmoil. Moreover, high rates of government borrowing would both drain funds away from private capital formation and increase our foreign indebtedness, with adverse long-run effects on U.S. output, incomes, and standards of living.

It is widely understood that the federal government is on an unsustainable fiscal path. Yet, as a nation, we have done little to address this critical threat to our economy. Doing nothing will not be an option indefinitely; the longer we wait to act, the greater the risks and the more wrenching the inevitable changes to the budget will be. By contrast, the prompt adoption of a credible program to reduce future deficits would not only enhance economic growth and stability in the long run, but could also yield substantial near-term benefits in terms of lower long-term interest rates and increased consumer and business confidence. Plans recently put forward by the President’s National Commission on Fiscal Responsibility and Reform and other prominent groups provide useful starting points for a much-needed national conversation about our medium- and long-term fiscal situation. Although these various proposals differ on many details, each gives a sobering perspective on the size of the problem and offers some potential solutions.

The Fed’s reintermediation made a good profit:

The U.S. Federal Reserve System, which includes the Board of Governors in Washington and 12 regional banks based in cities such as New York and San Francisco, returned a record $78.4-billion (U.S.) to the Treasury in 2010 – a remarkable 65-per-cent increase from 2009.

Toronto Mayor Rob Ford is making the right noises:

Toronto Mayor Rob Ford has issued a clear warning to any managers or staff who defy his cost-cutting edicts: Rein in spending or find a new job.

“If they are unable to manage effectively in the best interest of the taxpayers, then we will have to find new managers that can,” Mr. Ford said Monday.

Mr. Ford singled out Toronto police for its proposed 3-per-cent budget increase and summoned Chief Bill Blair to his office at 2 p.m. Monday.

The mayor toned down his rhetoric by the time he and Chief Blair emerged from their hour-and-a-half-long meeting. “I have the utmost confidence in the chief continuing to do the job. We had a very, very constructive meeting and I support the chief 100 per cent,” Mr. Ford said.

I have sent him an eMail, titled “Police Force Gravy Train”:

As you are probably aware, there are many instances of poor personnel management in the Toronto Police Service that are very costly to Toronto taxpayers.

i) Overtime for court appearances. A considerable amount of money is spent on this, with the TPS being unable or unwilling to schedule shifts to match required court appearances. Will you be seeking change in this area, if necessary by increasing the TPS complement so that officers in court can have their duties covered by another officer on straight time?

ii) Paid-Duty. Organizers of special events hire Constables and more senior officers at a high premium to officers’ regular wages, as is entirely normal in any private sector operation. However, the bulk of this premium is paid to the officers directly, instead of being retained by TPS, the contractor. Will you be seeking to arrange matters such that policing for special events is explicitly performed by the TPS, assigning officers on regular shifts as much as possible? Again, I recognize that the TPS complement may need to be increased to facilitate the mandate.

It was a mixed day on the Canadian preferred share market, with PerpetualDiscounts gaining 20bp and FixedResets down 2bp. Volume was average; there is but a single entry on the Performance Highlights table.

HIMIPref™ Preferred Indices
These values reflect the December 2008 revision of the HIMIPref™ Indices

Values are provisional and are finalized monthly
Index Mean
Current
Yield
(at bid)
Median
YTW
Median
Average
Trading
Value
Median
Mod Dur
(YTW)
Issues Day’s Perf. Index Value
Ratchet 0.00 % 0.00 % 0 0.00 0 0.0737 % 2,320.1
FixedFloater 4.78 % 3.51 % 28,448 18.94 1 0.6192 % 3,518.8
Floater 2.58 % 2.37 % 44,676 21.26 4 0.0737 % 2,505.1
OpRet 4.81 % 3.36 % 67,566 2.32 8 -0.1154 % 2,391.0
SplitShare 5.33 % 1.64 % 634,101 0.91 4 0.0201 % 2,449.6
Interest-Bearing 0.00 % 0.00 % 0 0.00 0 -0.1154 % 2,186.3
Perpetual-Premium 5.66 % 5.23 % 131,706 5.20 20 -0.0414 % 2,024.3
Perpetual-Discount 5.41 % 5.43 % 239,475 14.79 57 0.1957 % 2,044.7
FixedReset 5.24 % 3.45 % 288,160 3.08 52 -0.0173 % 2,270.3
Performance Highlights
Issue Index Change Notes
BAM.PR.I OpRet -1.59 % YTW SCENARIO
Maturity Type : Call
Maturity Date : 2011-07-30
Maturity Price : 25.25
Evaluated at bid price : 25.45
Bid-YTW : 4.30 %
Volume Highlights
Issue Index Shares
Traded
Notes
IAG.PR.F Perpetual-Premium 45,200 Desjardins crossed 42,900 at 25.35.
YTW SCENARIO
Maturity Type : Call
Maturity Date : 2019-04-30
Maturity Price : 25.00
Evaluated at bid price : 25.39
Bid-YTW : 5.73 %
SLF.PR.E Perpetual-Discount 44,209 Desjardins bought 20,000 from RBC at 20.95.
YTW SCENARIO
Maturity Type : Limit Maturity
Maturity Date : 2041-01-10
Maturity Price : 20.90
Evaluated at bid price : 20.90
Bid-YTW : 5.43 %
BNS.PR.Q FixedReset 39,025 RBC crossed 33,100 at 26.10.
YTW SCENARIO
Maturity Type : Call
Maturity Date : 2013-11-24
Maturity Price : 25.00
Evaluated at bid price : 26.10
Bid-YTW : 3.25 %
PWF.PR.H Perpetual-Premium 27,600 Scotia crossed 25,000 at 25.20.
YTW SCENARIO
Maturity Type : Call
Maturity Date : 2012-01-09
Maturity Price : 25.00
Evaluated at bid price : 25.00
Bid-YTW : 5.45 %
RY.PR.D Perpetual-Discount 24,800 Desjardins crossed 12,000 at 22.20.
YTW SCENARIO
Maturity Type : Limit Maturity
Maturity Date : 2041-01-10
Maturity Price : 22.06
Evaluated at bid price : 22.19
Bid-YTW : 5.14 %
TRI.PR.B Floater 20,700 Nesbitt crossed 20,000 at 22.50.
YTW SCENARIO
Maturity Type : Limit Maturity
Maturity Date : 2041-01-10
Maturity Price : 22.12
Evaluated at bid price : 22.40
Bid-YTW : 2.32 %
There were 27 other index-included issues trading in excess of 10,000 shares.

ALB.PR.A Refunding Confirmed

Monday, January 10th, 2011

Allbanc Split Corp. II has announced:

that the final condition required to extend the term of the Company for an additional five years to February 28, 2016 has been met as holders of 65.2% of Class A Capital Shares have elected to extend. Class A Capital shareholders previously approved the extension of the term of the Company subject to the condition that a minimum of 2,667,000 Class A Capital Shares remain outstanding after giving effect to the special retraction right (the “Special Retraction Right”).

Under the Special Retraction Right, 2,318,164 Class A Capital Shares were tendered to the Company for retraction on February 28, 2011. The holders of the remaining 4,349,412 Class A Capital Shares will continue to enjoy the benefits of a leveraged participation in the capital appreciation of the Company’s portfolio of publicly listed common shares of selected Canadian chartered banks and will defer realization of any capital gains which would otherwise have been realized on the redemption of their Class A Capital Shares.

The Class A Preferred Shares will be redeemed by the Company on February 28, 2011 in accordance with the redemption provisions as detailed in the January 25, 2006 prospectus. Pursuant to these provisions, the Preferred Shares will be redeemed at a price per share equal to the lesser of $25.00 and the Net Asset Value per Unit. In order to maintain the leveraged “split share” structure of the Company, the Company intends to create and issue a new series of Class B Preferred Shares to be called the Series 1 Preferred Shares, which are expected to be issued following this redemption.

Capital Shares and Preferred Shares of Allbanc Split Corp. II are listed for trading on The Toronto Stock Exchange under the symbols ALB and ALB.PR.A respectively.

ALB.PR.A was last mentioned on PrefBlog when the reorganization proposal was conditionally approved. ALB.PR.A is tracked by HIMIPref™ but is relegated to the Scraps index on credit concerns.

High Frequency Traders and Asset Prices

Sunday, January 9th, 2011

Jaksa Cvitanic, Andrei A. Kirilenko have published a paper titled High Frequency Traders and Asset Prices:

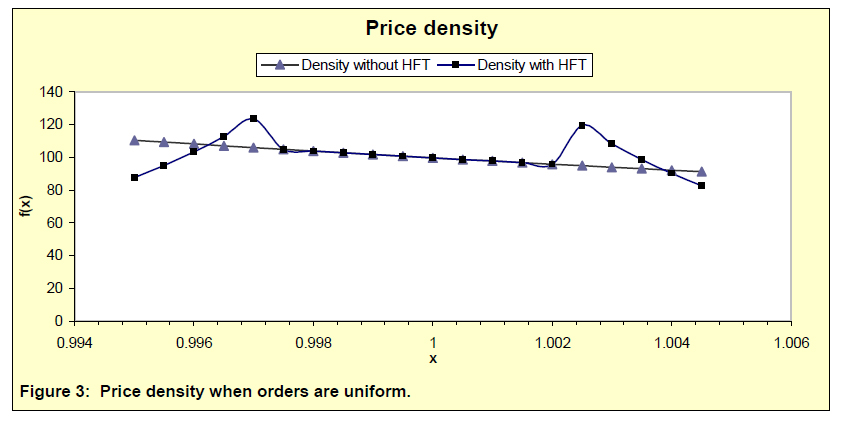
Do high frequency traders affect transaction prices? In this paper we derive distributions of transaction prices in limit order markets populated by low frequency traders (humans) before and after the entrance of a high frequency trader (machine). We find that the presence of a machine is likely to change the average transaction price, even in the absence of new information. We also find that in a market with a high frequency trader, the distribution of transaction prices has more mass around the center and thinner far tails. With a machine, mean intertrade duration decreases in proportion to the increase in the ratio of the human order arrival rates with and without the presence of the machine; trading volume goes up by the same rate. We show that the machine makes positive expected profits by “sniping” out human orders somewhat away from the front of the book. This explains the shape of the transaction price density. In fact, we show that in a special case, the faster humans submit and vary their orders, the more profits the machine makes.

They specify:

Machines are assumed to be strategic uninformed liquidity providers. They have only one advantage over the humans – the speed with which they can submit or cancel their orders. Because of this advantage, machines dominate the trading within each period by undercutting slow humans at the front of the book. This is only one of the strategies used by actual high-frequency traders in real markets, and the only one we focus on.[footnote] In the language of the industry, machines aim to “pick-off” or “snipe out” incoming human orders.

Footnote: Other known high frequency trading strategies include (i) the collection of rebates offered by exchanges for liquidity provision, (ii) cross-market arbitrage, and (iii) “spoofing”- triggering other traders to act.

The guts of the paper is:

We find that the presence of a machine is likely to change the average transaction price, even in the absence of new information. We also find that in the presence of a machine, the shape of the transaction price density remains the same in the middle, between the bid and the ask of the machine, the far tails of the density get thinner, while the parts of the tails closer to the bid and the ask of the machine get fatter. In the presence of the machine, mean intertrade duration decreases in proportion to the increase in the ratio of the human order arrival rates with and without the presence of the machine. Trading volume goes up by the same rate. In other words, if the humans submit orders ten times faster when the machine is present, intertrade duration falls and trading volume increases by a factor of ten.

Second, we compute the optimal bid and ask prices for the machine that optimizes expected profits subject to an inventory constraint. The inventory constraint prevents the machine from carrying a significant open position to the next intra-human-trade period. The optimal bid and the ask for the machine are close to being symmetric around the mean value of the human orders, with the distance from the middle value being determined by the inventory constraint – the less concerned the machine is about the size of the remaining inventory, the closer its bid and the ask prices are to each other. The expected profit of an optimizing machine is increasing in both the variance and the arrival frequency of human orders.

Our two findings are interrelated; one the one hand, an optimizing machine is able to make positive expected profits by “sniping” out human orders somewhat away from the front of the book. On the other hand, execution of the “sniping” order submission strategy results in a transaction price density with bulges near the front and thinner outer tails. In fact, in a special case, the faster humans submit and vary their orders, the more profits the machine makes.


Click for big

The conclusion of interest is:

We also find that a machine that optimizes expected profits subject to an inventory constraint submits orders that are essentially symmetric around the mean value of the human orders. The distance between the machine’s bid and ask prices increases with its concern about the size of the remaining inventory. The expected profit of an optimizing machine increases in both the variance and the arrival frequency of human orders.

Briefly mentioned on October 18 was High Frequency Trading and its Impact on Market Quality:

In this paper I examine the impact of high frequency trading (HFT) on the U.S. equities market. I analyze a unique dataset to study the strategies utilized by high frequency traders (HFTs), their profitability, and their relationship with characteristics of the overall market, including liquidity, price discovery, and volatility. The 26 HFT firms in the dataset participate in 68.5% of the dollar-volume traded. I find the following key results: (1) HFTs tend to follow a price reversal strategy driven by order imbalances, (2) HFTs earn gross trading profits of approximately $2.8 billion annually, (3) HFTs do not seem to systematically engage in a non-HFTr anticipatory trading strategy, (4) HFTs’ strategies are more correlated with each other than are non-HFTs’, (5) HFTs’ trading levels change only moderately as volatility increases, (6) HFTs add substantially to the price discovery process, (7) HFTs provide the best bid and offer quotes for a significant portion of the trading day and do so strategically so as to avoid informed traders, but provide only one-fourth as much book depth as non-HFTs, and (8) HFTs may dampen intraday volatility. These findings suggest that HFTs’ activities are not detrimental to non-HFTs and that HFT tends to improve market quality.

He provides a good discussion of pinging:

Pinging is defined by the SEC as, “an immediate-or-cancel order that can be used to search for and access all types of undisplayed liquidity, including dark pools and undisplayed order types at exchanges and ECNs. The trading center that receives an immediate-or-cancel order will execute the order immediately if it has available liquidity at or better than the limit price of the order and otherwise will immediately respond to the order with a cancelation” (SEC, January 14, 2010). The SEC goes on to clarify, “[T]here is an important distinction between using tools such as pinging orders as part of a normal search for liquidity with which to trade and using such tools to detect and trade in front of large trading interest as part of an ‘order anticipation’ trading strategy” (SEC, January 14, 2010).

Of interest is the section titled “10-Second High Frequency Trading Determinants”:

This section examines the factors that influence HFTs’ buy and sell decisions. I begin by testing a variety of potentially important variables in an ordered logistic regression analysis. The results show the importance of past returns. I carry out a logistic regression analysis distinguishing the dependent variables based on whether the HFTr is buying or selling and whether the HFTr is providing liquidity or taking liquidity. Finally, I include order imbalance in the logit analysis and find that the interaction between past order imbalance and past returns drives HFTr activity and is consistent with HFTs engaging in a short term price reversal strategy.

Also of interest is the section titled “Testing Whether High Frequency Traders Systematically Engage in Anticipatory Trading”:

In this section I test whether HFTs systematically anticipate and trade in front of non-HFTs (“anticipatory trading”) (SEC, January 14, 2010). It may be that HFTs predict and buy (sell) a stock just prior to when a non-HFTr buys (sells) the stock. If this is the case, HFTs are profiting at the expense of non-HFTs.[footnote]

Footnote: Anticipatory trading is not itself an illegal activity. It is illegal when a firm has a fiduciary obligation to its client and uses the client’s information to front run its orders. In my analysis, as HFTs are propriety trading firms, they do not have clients and so the anticipatory trading they may be conducting would likely not be illegal. Where HFT and anticipatory trading may be problematic is if market manipulation is occurring that is used to detect orders. It may be the case that “detecting” orders would fall in to the same category of behavior as that resulted in a $2.3 million fine to Trillium Brokerage Services for “layering”.

Trillium was fined for the following layering strategy: Suppose Trillium wanted to buy stock X at $20.10 but the current offer price was $20.13, Trillium would put in a hidden buy order at $20.10 and then place several limit orders to sell where the limit orders were sufficiently below the bid price to be executed. Market participants would see this new influx of sell orders, update their priors, and lower their bid and offer prices. Once the offer price went to $20.10, Trillium’s hidden order would execute and Trillium would then withdraw its sell limit orders. FINRA found this violated NASD Rules 2110, 2120, 3310, and IM-3310 (now FINRA 2010, FINRA 2020, FINRA 5210, and also part of FINRA 5210).

I don’t have any problems with what Trillium did – it’s just another example of random illegality. By me, that just shows that most traders are little girls with no conception whatsoever of fundamental value and FINRA panders to them. FINRA’s press release states … :

In concluding this settlement, Trillium and the individual respondents neither admitted nor denied the charges, but consented to the entry of FINRA’s findings.

… from which I conclude that FINRA doesn’t think it was a crime either and the whole thing was simply a case of regulatory extortion.

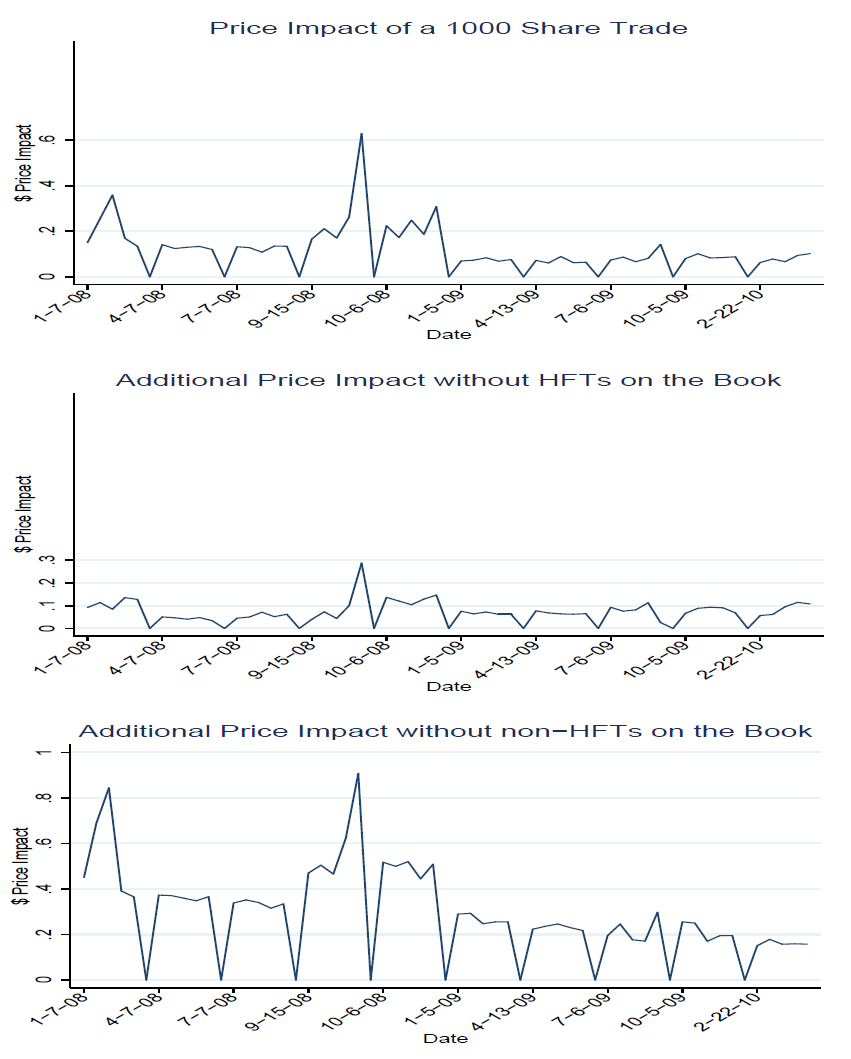
Of great interest is the author’s estimate of the effect of HFT on market impact:

Figure 4: Time Series of High Frequency Traders’ and Non High Frequency Traders’ Book Depth. This Figure analyzes the depth of the order book and how much depth different types of traders provide by analyzing the price impact of a 1000 share trade hitting the order book with and without different types of traders. There are three graphs. The first, Price Impact of a 1000 Share Trade, examines the total price impact a 1000 share trade would have with all available liquidity accessible. The second graph, Additional Price Impact without HFTs on the Book, depicts the additional price impact that would occur from removing HFTs’ limit orders The third graph, Additional Price Impact without non-HFTs on the Book, graphs the additional price impact from removing non-HFTs’ limit orders. The daily dollar price impact value is calculated giving equal weight to each stock. The order book data is available during 10 5-day windows. The X-axis identifies the first day in the 5-day window. That is, The observation 01-07-08 is followed by observations on January 8th, 9th, 10th, and 11th of 2008. The next observation is for April 7, 2008 and is followed by the next four consecutive trading days. To separate the 5-day windows I enter a zero-impact trade, creating the evenly spaced troughs.


Click for big

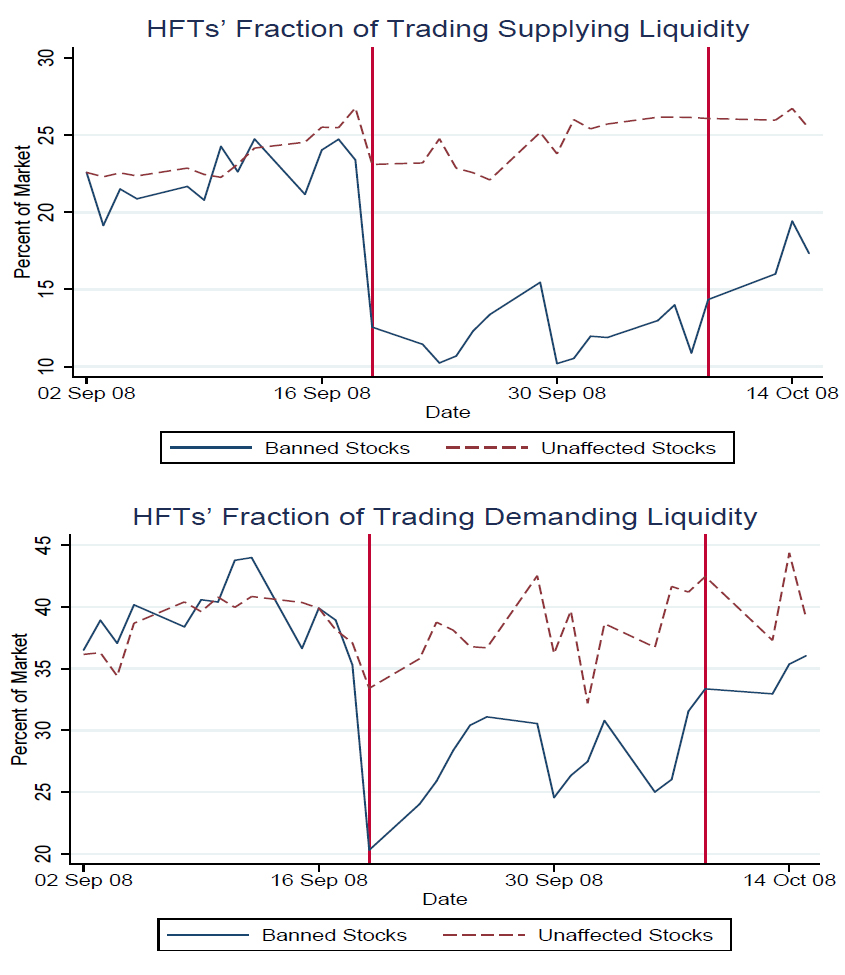
Also of interest was the effect of the short-selling ban on market participation by HFT:

Figure A-1: High Frequency Trading’s Fraction of the Market around the Short-Sale Ban. The figure shows how HFTs’ fraction of dollar-volume trading varied surrounding the September 19, 2008 SEC imposed short-sale ban on many financial stocks. In the HFT dataset, 13 stocks are in the ban. The two graphs plot HFTs’ fraction of dollar-volume traded for the banned stocks and for the unaffected stocks. The first graph reports the fraction of dollar-volume where HFTs supplied liquidity. The second reports the fraction where HFTs demanded liquidity. I normalize the banned stocks’ percent of the market in both graphs so that the affected and unaffected stocks have the same percent of the market on September 2, 2008. The two vertical lines represent the first and last day of the short-sale ban.


Click for Big

Inflation Risk Premium: Adrian & Wu

Sunday, January 9th, 2011

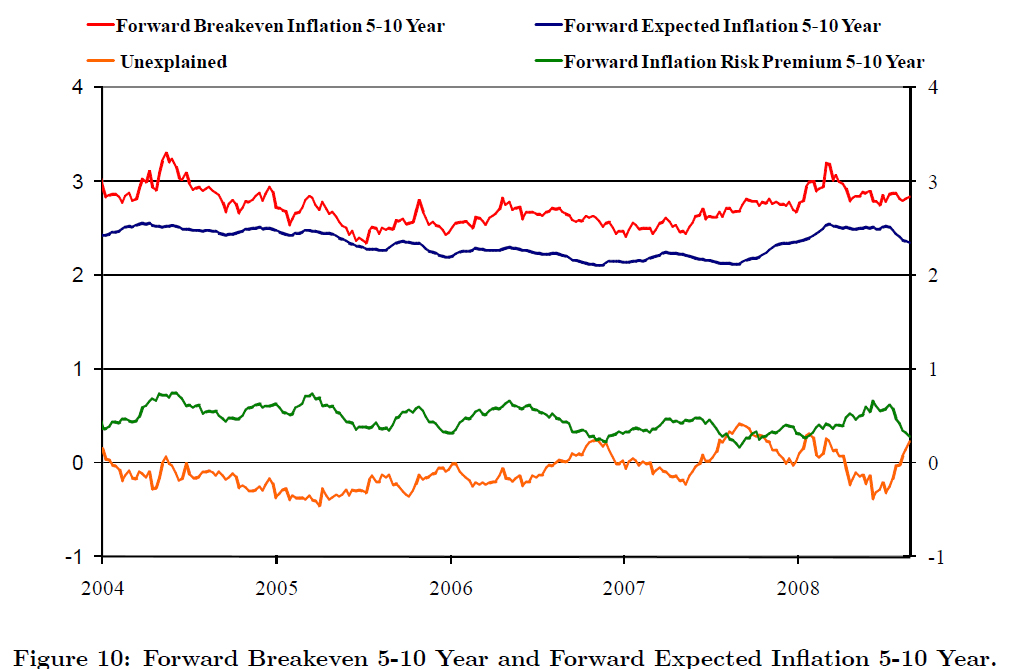
In a working paper published by the Federal Reserve Bank of New York, authored by Tobias Adrian & Hao Wu and titled The Term Structure of Inflation Expectations:

We present estimates of the term structure of inflation expectations, derived from an affine model of real and nominal yield curves. The model features stochastic covariation of inflation with the real pricing kernel, enabling us to extract a time-varying inflation risk premium. We fit the model not only to yields, but also to the yields’ variance-covariance matrix, thus increasing identification power. We find that model-implied inflation expectations can differ substantially from break-even inflation rates when market volatility is high. Our model’s ability to be updated weekly makes it suitable for real-time monetary policy analysis.

They point out:

However, breakeven inflation rates of zero-coupon off-the-run curves (i.e., implied inflation) still are not pure measures of inflation expectations. This is because the absence of arbitrage implies that the difference between zero-coupon nominal and real yields can be decomposed into three components:

Breakeven Inflation = Expected Inflation + Inflation Risk Premium + Convexity

The literature commonly adjust for the convexity effect (see Elsasser and Sack, 2004). However, the adjustment of breakeven inflation for the inflation risk premium requires the estimation of a term structure model.

The paper by Brian P. Sack and Robert Elsasser is titled Treasury Inflation-Indexed Debt: A Review of the U.S. Experience. The convexity complication is explained as:

One complication with interpreting inflation compensation involves the adjustment for convexity. For a given level of the yield on a nominal security, uncertainty about future inflation increases the expected return on that security. This is a mechanical relationship that arises from the convexity of real returns in inflation—specifically, because higher inflation erodes the real return on the security at a slower rate than lower inflation boosts it (see the appendix). This point was originally made by Fischer (1975); a more recent description of the relationship between inflation compensation and future inflation can be found in McCulloch and Kochin (1998).

Although convexity tends to pull down inflation compensation relative to expected inflation, there may be an inflation risk premium that works in the opposite direction.

The methodology of Adrian & Wu is:

In this paper, we develop an affine term structure model that captures the dynamics of real and nominal yields curves, as well as the evolution of their variance-covariance matrix. This is important, as the inflation risk premium is proportional to the conditional covariance of the real pricing kernel and inflation. In order to increase the power for identifying the inflation risk premium, we match both the term structure of the yield curves, and the term structure of variances and covariances.

We find a relatively small and stable inflation risk premium. The order of magnitude of the inflation risk premium is comparable to other recent estimates in studies that use inflation protected bonds over similar sample periods, but it is smaller and less variable than estimates that use nominal bonds and inflation over longer time periods (see Buraschi and Jiltsov, 2005, and Ang, Bekaert, and Wei, 2006).


Click for Big

Inflation Risk Premium: Christensen, Lopez & Rudebusch

Sunday, January 9th, 2011

The Federal Reserve Bank of San Francisco has published a working paper by Jens H. E. Christensen, Jose A. Lopez and Glenn D. Rudebusch titled Inflation Expectations and Risk Premiums in an Arbitrage-Free Model of Nominal and Real Bond Yields:

Differences between yields on comparable-maturity U.S. Treasury nominal and real debt, the so-called breakeven inflation (BEI) rates, are widely used indicators of inflation expectations. However, better measures of inflation expectations could be obtained by subtracting inflation risk premiums from the BEI rates. We provide such decompositions using an estimated affine arbitrage-free model of the term structure that captures the pricing of both nominal and real Treasury securities. Our empirical results suggest that long-term inflation expectations have been well anchored over the past few years, and inflation risk premiums, although volatile, have been close to zero on average.

This contradicts the results of Haubrich, et al, from the FRB-Cleveland, (paper reviewed on PrefBlog) who claimed:

The inflation risk premium on a ten-year bond varied between 38 and 60 basis points during our [1982-2008] sample period.

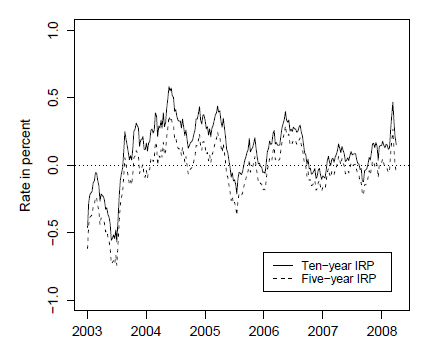
while the FRBNY paper by Adrian & Wu (discussed below) claimed a 0-40bp Inflation Risk Premium for 5-10 year time horizons.

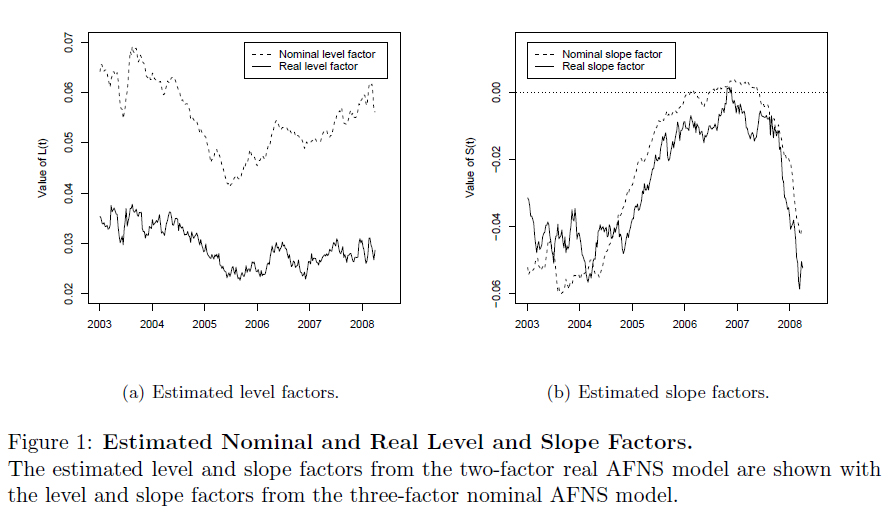
The Christensen group first did a Principal Component Analysis of Treasury yields:

Researchers have typically found that three factors, often referred to as level, slope, and curvature, are sufficient to account for the time variation in the cross section of nominal Treasury yields (e.g., Litterman and Scheinkman, 1991). This characterization is supported by a principal component analysis of our weekly data set, which consists of Friday observations from January 6, 1995, to March 28, 2008, for eight maturities: three months, six months, one year, two years, three years, five years, seven years, and ten years. Indeed, as shown in Table 1, 99.9 percent of the total variation in this set of yields is accounted for by the first three principal components. Furthermore, the loadings across the eight maturities for the first component are quite uniform; thus, like a level factor, a shock to this component will change all yields by a similar amount. The second component has negative loadings for short maturities and positive loadings for long ones; thus, like a slope factor, a shock to this component will steepen or flatten the yield curve. Finally, the third component has U-shaped factor loadings as a function of maturity and is naturally interpreted as a curvature factor.

Only the first two principal components are required to explain real yields – best of all, the “slope” component is well-correlated with that of nominals:


Click for Big

After developing the model, they conclude:

Finally, for our preferred specification, we subtract each model-implied expected inflation rate from the comparable-maturity model-implied BEI rate and obtain the associated inflation risk premium (IRP). At both the five- and ten-year horizons, these premiums are fairly small, as shown in Figure 5.(17) Indeed, during our sample, these inflation premiums have varied in a range around zero of about ±50 basis points.(18)

Footnote 17: This result provides some support for the argument that the gain to the U.S. Treasury from issuing TIPS bonds instead of nominal bonds may be quite limited, as argued in Sack and Elsasser (2004).

Footnote 18: Again, in theory, the sign of the inflation risk premium depends on the covariance between the real stochastic discount factor and inflation, but there are real-world considerations as well. For example, a liquidity premium for holding TIPS instead of nominal Treasury bonds would show up as a negative inflation risk premium.


Click for Big

Finally, the authors conclude:

This paper estimates an arbitrage-free model with four latent factors that can capture the dynamics of both the nominal and real Treasury yield curves well and can decompose BEI rates into inflation expectations and inflation risk premiums. The model-implied measures of inflation expectations are correlated closely with survey measures, while the estimated inflation risk premiums fluctuate in fairly close range around zero. The empirical results suggest that long-term inflation expectations have been well-anchored in the period from year-end 2002 through the first quarter of 2008.

Inflation Risk Premium: Hördahl & Tristani

Sunday, January 9th, 2011

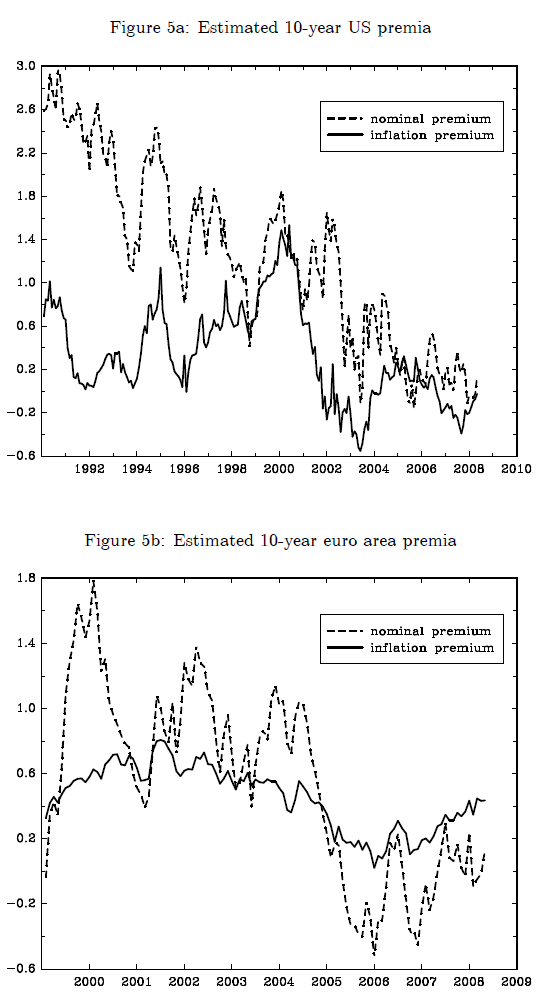
In a working paper published by the Bank for International Settlements, authored by Peter Hördahl and Oreste Tristani, titled Inflation risk premia in the US and the euro area:

We use a joint model of macroeconomic and term structure dynamics to estimate inflation risk premia in the United States and the euro area. To sharpen our estimation, we include in the information set macro data and survey data on inflation and interest rate expectations at various future horizons, as well as term structure data from both nominal and index-linked bonds. Our results show that, in both currency areas, inflation risk premia are relatively small, positive, and increasing in maturity. The cyclical dynamics of long-term inflation risk premia are mostly associated with changes in output gaps, while their high-frequency fluctuations seem to be aligned with variations in inflation. However, the cyclicality of inflation premia differs between the US and the euro area. Long term inflation premia are countercyclical in the euro area, while they are procyclical in the US.

This model is much more macro-oriented than most:

In this paper we focus on modelling and estimating the first of these two components – i.e. the inflation risk premium – in order to obtain a “cleaner” measure of investors; inflation expectations embedded in bond prices. In doing so, we try to reduce the risk that liquidity factors might distort our estimates by carefully choosing when to introduce yields on index-linked bonds in the estimations. We also include survey information on expectations, which should aid us in pinning down the dynamics of key variables in the model. Moreover, in order to understand the macroeconomic determinants of inflation risk premia we employ a joint model of macroeconomic and term structure dynamics, such that prices of real and nominal bonds are determined by the macroeconomic framework and investors’ risk characteristics. More specifically, building on Ang and Piazzesi (2003), we adopt the framework developed in Hördahl, Tristani and Vestin (2006), in which bonds are priced based on the dynamics of the short rate obtained from the solution of a linear forward-looking macro model and using an essentially a¢ ne stochastic discount factor (see Duffie and Kan, 1996; Dai and Singleton, 2000; Duffee, 2002).

They find a rather peculiar difference in the responses of EUR denominated bonds vs Treasuries to output-gap shocks:

There is however one striking di¤erence in the conditional dynamics of risk premia in the two currency areas. While we find that inflation premia always respond positively to upward inflation shocks, the response to output gap shocks di¤er between the US and the euro area. A positive output shock results in a higher inflation premium in the US, while it lowers it in the euro area. The positive relationship for the US could reflect perceptions of a higher risk of inflation surprises on the upside as the output gap widens, while the euro area result is consistent with investors becoming more willing to take on risks – including inflation risks – during booms, while they may require larger premia during recessions.

The model’s detailed results are:

Looking at the results in more detail, Figure 9 shows that a one standard deviation upward shock to the output gap (about 0.4%) in the US pushes the 10-year break-even rate up by around 15 basis points on impact. About two thirds of this e¤ect is due to a rising inflation premium, while one third corresponds to an increase in expected inflation as a result of the expansionary shock. At the 2-year horizon, the effect on the break-even rate is even larger, at around 26 basis points on impact, but now the bulk of this response is due to rising inflation expectations (16 basis points), whereas the inflation premium accounts for the remaining 10 basis points. Hence, a shock to the output gap seems to result in a parallel shift in the inflation premium, while inflation expectations react much more strongly for short horizons than long, reflecting the short- to medium-term persistence of output gap shocks. In the euro area, a positive shock to the output gap also raises expected inflation – and more so at the 2-year horizon than the 10-year horizon – but the inflation premium response is uniformly negative (Fig. 11). Moreover, as the expected inflation response declines with the horizon, the break-even response goes from being positive at the 2-year horizon to being slightly negative at 10 years.

The authors conclude, in part:

Our results show that the inflation risk premium is relatively small, positive, and increasing with the maturity, in the United States as well as in the euro area. Our estimated inflation premia vary over time as a result of changes to the state variables in the model. Specifically, in both economies the output gap and inflation are the main drivers of inflation premia. The broad movements in long-term inflation risk premia largely match those of the output gap, while more high-frequency premia fluctuations seem to be aligned with changes in the level of inflation.


Click for big

Bill C-501

Sunday, January 9th, 2011

Bill C-501 is a Liberal-sponsored bill to amend the Bankruptcy and Insolvency Act and other Acts – although its chief proponent found it impossible to find any support for its provisions in a major speech.

John Manley explains in Bill C-501: Myths & Reality:

The proposed legislation would force bankrupt companies to give so-called “super-priority” status to unfunded pension plan liabilities, on the grounds that this will help to ensure benefits are paid if a company goes out of business.

DBRS Comments on Pension Fund Bill C-501:

Based on present information, the enactment of Bill C-501 would have potentially negative consequences for the ratings of certain Canadian-based companies and would likely add volatility to bond markets on a whole as market participants reacted to the meaningful change. The primary impact would relate to the reality that bondholders of entities with DBs would now rank behind the new senior obligation. Secondary effects would likely include the reality that the overall credit strength of some entities may be weakened by changes that would result in higher funding costs and accentuated liquidity challenges, noting that this would likely be concentrated within weaker credits, particularly during periods of stress.

Douglas Rienzo, a Pension & Benefits partner at Osler, comments:

Extending super-priority status to the entire solvency deficit could place significant additional burdens on the financial capacity of DB plan sponsors, impede their ability to cost-effectively raise capital, adversely affect their ability to invest in Canada’s economy and remain competitive, and, ultimately, impair their ability to fund their pension obligations.

For example, the proposed amendments to the BIA and CCAA could have the following implications:

  • •the elevation of billions of dollars of potential pension claims ahead of lenders in the priority ladder;
  • •the revaluation by credit markets of assets available for security and the deduction of higher-priority claims, thus resulting in a significant reduction of available credit; and
  • •the creation of immediate default situations, based on covenants in existing trust indentures restricting the existence of claims that would have priority over the existing lender.

While the protection of members’ accrued benefits in a restructuring or bankruptcy situation may well be a public policy goal worth pursuing, the unintended consequences of Bill C-501 could include not only the weakening of the financial viability of DB plan sponsors, but possibly the wholesale abandonment of DB plans by corporate Canada.

As far as preferred shares go, this is pretty much a non-issue: the default assumption is that if an operating company defaults at all on its preferreds, that implies a total loss on the preferred shares. The senior bondholders and pension retirees can fight amongst themselves for whatever’s left over.

Update, 2011-6-23: Died on the order paper.