Jaksa Cvitanic, Andrei A. Kirilenko have published a paper titled High Frequency Traders and Asset Prices:
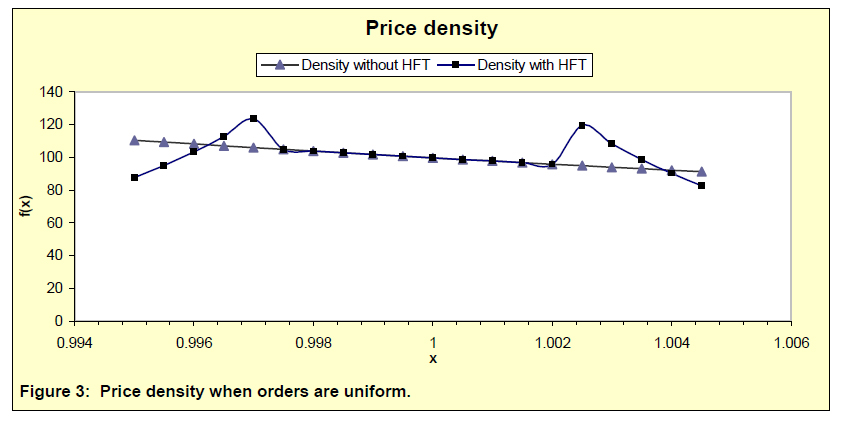
Do high frequency traders affect transaction prices? In this paper we derive distributions of transaction prices in limit order markets populated by low frequency traders (humans) before and after the entrance of a high frequency trader (machine). We find that the presence of a machine is likely to change the average transaction price, even in the absence of new information. We also find that in a market with a high frequency trader, the distribution of transaction prices has more mass around the center and thinner far tails. With a machine, mean intertrade duration decreases in proportion to the increase in the ratio of the human order arrival rates with and without the presence of the machine; trading volume goes up by the same rate. We show that the machine makes positive expected profits by “sniping” out human orders somewhat away from the front of the book. This explains the shape of the transaction price density. In fact, we show that in a special case, the faster humans submit and vary their orders, the more profits the machine makes.
They specify:
Machines are assumed to be strategic uninformed liquidity providers. They have only one advantage over the humans – the speed with which they can submit or cancel their orders. Because of this advantage, machines dominate the trading within each period by undercutting slow humans at the front of the book. This is only one of the strategies used by actual high-frequency traders in real markets, and the only one we focus on.[footnote] In the language of the industry, machines aim to “pick-off” or “snipe out” incoming human orders.
Footnote: Other known high frequency trading strategies include (i) the collection of rebates offered by exchanges for liquidity provision, (ii) cross-market arbitrage, and (iii) “spoofing”- triggering other traders to act.
The guts of the paper is:
We find that the presence of a machine is likely to change the average transaction price, even in the absence of new information. We also find that in the presence of a machine, the shape of the transaction price density remains the same in the middle, between the bid and the ask of the machine, the far tails of the density get thinner, while the parts of the tails closer to the bid and the ask of the machine get fatter. In the presence of the machine, mean intertrade duration decreases in proportion to the increase in the ratio of the human order arrival rates with and without the presence of the machine. Trading volume goes up by the same rate. In other words, if the humans submit orders ten times faster when the machine is present, intertrade duration falls and trading volume increases by a factor of ten.
Second, we compute the optimal bid and ask prices for the machine that optimizes expected profits subject to an inventory constraint. The inventory constraint prevents the machine from carrying a significant open position to the next intra-human-trade period. The optimal bid and the ask for the machine are close to being symmetric around the mean value of the human orders, with the distance from the middle value being determined by the inventory constraint – the less concerned the machine is about the size of the remaining inventory, the closer its bid and the ask prices are to each other. The expected profit of an optimizing machine is increasing in both the variance and the arrival frequency of human orders.
Our two findings are interrelated; one the one hand, an optimizing machine is able to make positive expected profits by “sniping” out human orders somewhat away from the front of the book. On the other hand, execution of the “sniping” order submission strategy results in a transaction price density with bulges near the front and thinner outer tails. In fact, in a special case, the faster humans submit and vary their orders, the more profits the machine makes.
The conclusion of interest is:
We also find that a machine that optimizes expected profits subject to an inventory constraint submits orders that are essentially symmetric around the mean value of the human orders. The distance between the machine’s bid and ask prices increases with its concern about the size of the remaining inventory. The expected profit of an optimizing machine increases in both the variance and the arrival frequency of human orders.
Briefly mentioned on October 18 was High Frequency Trading and its Impact on Market Quality:
In this paper I examine the impact of high frequency trading (HFT) on the U.S. equities market. I analyze a unique dataset to study the strategies utilized by high frequency traders (HFTs), their profitability, and their relationship with characteristics of the overall market, including liquidity, price discovery, and volatility. The 26 HFT firms in the dataset participate in 68.5% of the dollar-volume traded. I find the following key results: (1) HFTs tend to follow a price reversal strategy driven by order imbalances, (2) HFTs earn gross trading profits of approximately $2.8 billion annually, (3) HFTs do not seem to systematically engage in a non-HFTr anticipatory trading strategy, (4) HFTs’ strategies are more correlated with each other than are non-HFTs’, (5) HFTs’ trading levels change only moderately as volatility increases, (6) HFTs add substantially to the price discovery process, (7) HFTs provide the best bid and offer quotes for a significant portion of the trading day and do so strategically so as to avoid informed traders, but provide only one-fourth as much book depth as non-HFTs, and (8) HFTs may dampen intraday volatility. These findings suggest that HFTs’ activities are not detrimental to non-HFTs and that HFT tends to improve market quality.
He provides a good discussion of pinging:
Pinging is defined by the SEC as, “an immediate-or-cancel order that can be used to search for and access all types of undisplayed liquidity, including dark pools and undisplayed order types at exchanges and ECNs. The trading center that receives an immediate-or-cancel order will execute the order immediately if it has available liquidity at or better than the limit price of the order and otherwise will immediately respond to the order with a cancelation” (SEC, January 14, 2010). The SEC goes on to clarify, “[T]here is an important distinction between using tools such as pinging orders as part of a normal search for liquidity with which to trade and using such tools to detect and trade in front of large trading interest as part of an ‘order anticipation’ trading strategy” (SEC, January 14, 2010).
Of interest is the section titled “10-Second High Frequency Trading Determinants”:
This section examines the factors that influence HFTs’ buy and sell decisions. I begin by testing a variety of potentially important variables in an ordered logistic regression analysis. The results show the importance of past returns. I carry out a logistic regression analysis distinguishing the dependent variables based on whether the HFTr is buying or selling and whether the HFTr is providing liquidity or taking liquidity. Finally, I include order imbalance in the logit analysis and find that the interaction between past order imbalance and past returns drives HFTr activity and is consistent with HFTs engaging in a short term price reversal strategy.
Also of interest is the section titled “Testing Whether High Frequency Traders Systematically Engage in Anticipatory Trading”:
In this section I test whether HFTs systematically anticipate and trade in front of non-HFTs (“anticipatory trading”) (SEC, January 14, 2010). It may be that HFTs predict and buy (sell) a stock just prior to when a non-HFTr buys (sells) the stock. If this is the case, HFTs are profiting at the expense of non-HFTs.[footnote]
Footnote: Anticipatory trading is not itself an illegal activity. It is illegal when a firm has a fiduciary obligation to its client and uses the client’s information to front run its orders. In my analysis, as HFTs are propriety trading firms, they do not have clients and so the anticipatory trading they may be conducting would likely not be illegal. Where HFT and anticipatory trading may be problematic is if market manipulation is occurring that is used to detect orders. It may be the case that “detecting” orders would fall in to the same category of behavior as that resulted in a $2.3 million fine to Trillium Brokerage Services for “layering”.
Trillium was fined for the following layering strategy: Suppose Trillium wanted to buy stock X at $20.10 but the current offer price was $20.13, Trillium would put in a hidden buy order at $20.10 and then place several limit orders to sell where the limit orders were sufficiently below the bid price to be executed. Market participants would see this new influx of sell orders, update their priors, and lower their bid and offer prices. Once the offer price went to $20.10, Trillium’s hidden order would execute and Trillium would then withdraw its sell limit orders. FINRA found this violated NASD Rules 2110, 2120, 3310, and IM-3310 (now FINRA 2010, FINRA 2020, FINRA 5210, and also part of FINRA 5210).
I don’t have any problems with what Trillium did – it’s just another example of random illegality. By me, that just shows that most traders are little girls with no conception whatsoever of fundamental value and FINRA panders to them. FINRA’s press release states … :
In concluding this settlement, Trillium and the individual respondents neither admitted nor denied the charges, but consented to the entry of FINRA’s findings.
… from which I conclude that FINRA doesn’t think it was a crime either and the whole thing was simply a case of regulatory extortion.
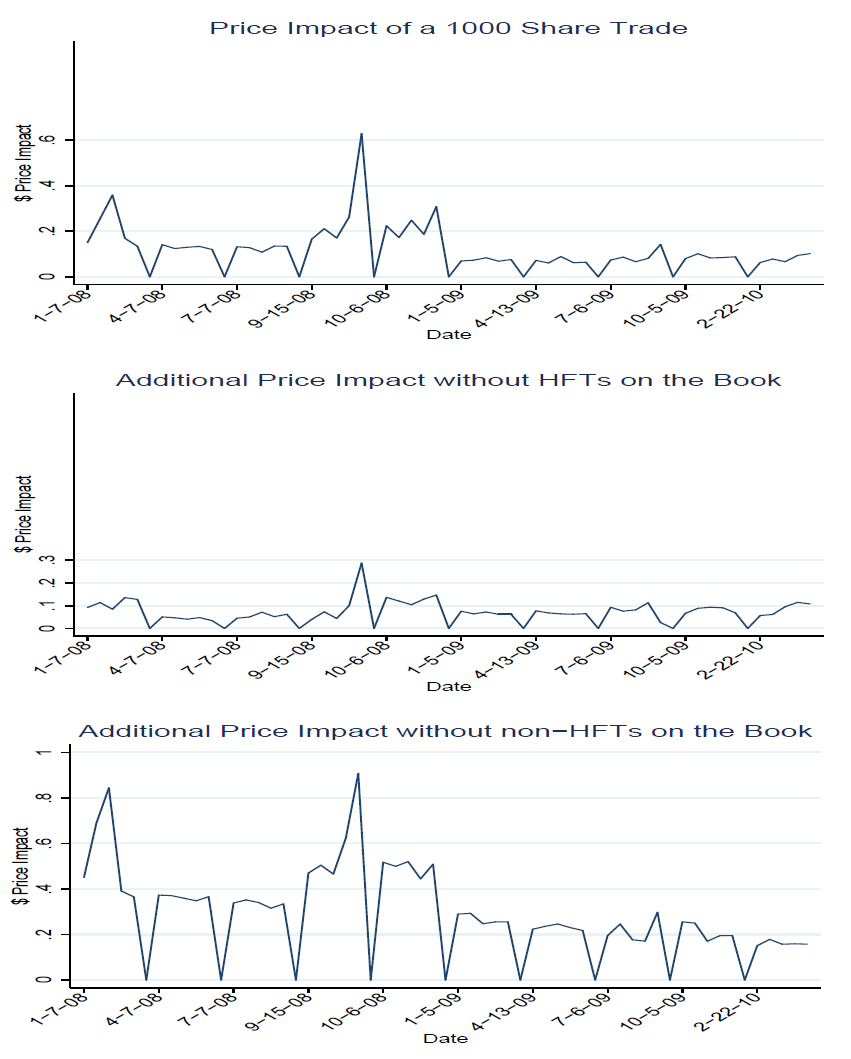
Of great interest is the author’s estimate of the effect of HFT on market impact:
Figure 4: Time Series of High Frequency Traders’ and Non High Frequency Traders’ Book Depth. This Figure analyzes the depth of the order book and how much depth different types of traders provide by analyzing the price impact of a 1000 share trade hitting the order book with and without different types of traders. There are three graphs. The first, Price Impact of a 1000 Share Trade, examines the total price impact a 1000 share trade would have with all available liquidity accessible. The second graph, Additional Price Impact without HFTs on the Book, depicts the additional price impact that would occur from removing HFTs’ limit orders The third graph, Additional Price Impact without non-HFTs on the Book, graphs the additional price impact from removing non-HFTs’ limit orders. The daily dollar price impact value is calculated giving equal weight to each stock. The order book data is available during 10 5-day windows. The X-axis identifies the first day in the 5-day window. That is, The observation 01-07-08 is followed by observations on January 8th, 9th, 10th, and 11th of 2008. The next observation is for April 7, 2008 and is followed by the next four consecutive trading days. To separate the 5-day windows I enter a zero-impact trade, creating the evenly spaced troughs.
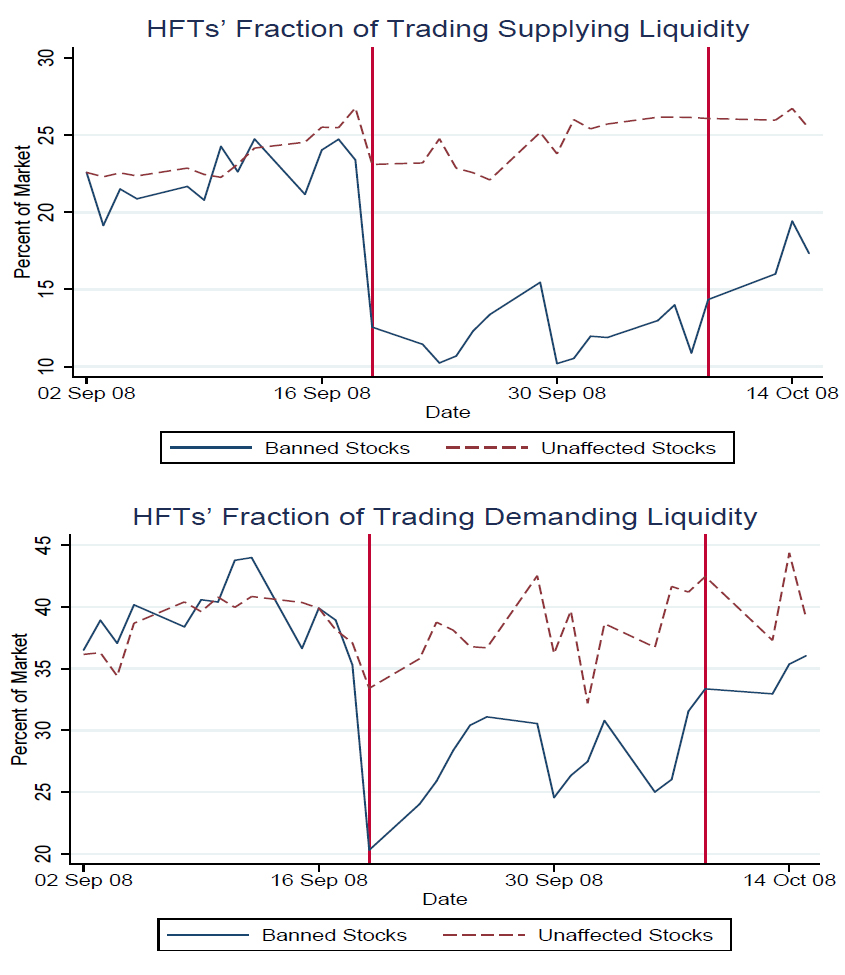
Also of interest was the effect of the short-selling ban on market participation by HFT:
Figure A-1: High Frequency Trading’s Fraction of the Market around the Short-Sale Ban. The figure shows how HFTs’ fraction of dollar-volume trading varied surrounding the September 19, 2008 SEC imposed short-sale ban on many financial stocks. In the HFT dataset, 13 stocks are in the ban. The two graphs plot HFTs’ fraction of dollar-volume traded for the banned stocks and for the unaffected stocks. The first graph reports the fraction of dollar-volume where HFTs supplied liquidity. The second reports the fraction where HFTs demanded liquidity. I normalize the banned stocks’ percent of the market in both graphs so that the affected and unaffected stocks have the same percent of the market on September 2, 2008. The two vertical lines represent the first and last day of the short-sale ban.


