Category: Interesting External Papers

Interesting External Papers

FDIC Addresses Systemic Risk

Bloomberg reported today:

The FDIC board today approved two proposals for overhauling assessments for its deposit insurance fund, including one that would base the fees on banks’ liabilities rather than their domestic deposits. The fee proposal, a response to the Dodd- Frank financial-regulation law, would increase assessments on banks with more than $10 billion in assets.

The measure would increase the largest banks’ share of overall assessments to 80 percent from the present 70 percent, the FDIC said. The assessment increase would be in place by the second quarter of next year, according to the proposal.

“It’s a sea change in that it breaks the link between deposit insurance and deposits for the first time,” Acting Comptroller of the Currency John Walsh said today. “It is significant.”

The proposal would increase assessment rates on banks that hold unsecured debt of other lenders. That step was proposed to address risk that is retained in the system even as it is removed from one bank’s holdings.

It is this last bit that makes me happy. The Basel rules allow banks to risk-weight other banks’ paper as if was issued by the sovereign – which is simply craziness. The FDIC memorandum – which we can only hope will survive the comment period and spread to Canada, if not world-wide – is going to charge them extra deposit insurance premiums on the long-term portion of these assets:

Depositary Institution Debt Adjustment

Staff recommends adding an adjustment for those institutions that hold long-term unsecured liabilities issued by other insured depositary institutions. Institutions that hold this type of unsecured liability would be charged 50 basis points for each dollar of such long-term unsecured debt held. The issuance of unsecured debt by an IDI lesens the potential loss to the [Deposit Insurance Fund] in the event of an IDI’s failure; however, when such debt is hel by other IDIs, the overall risk in the system is not reduced. The intent of the increased assessment, therefore, is to discourage IDIs from purchasing the long-term unsecured debt of other IDIs.

There are many other adjustments and changes; I cannot comment on the specifics of the proposal because the data that would assist with the evaluation of the calibration of the adjustments is not available. The comments on this proposed rule will be most interesting!

Update, 2010-11-10: The FDIC has published the official notice.

Interesting External Papers

Inflation Risk Premia

Joseph G. Haubrich, Peter H. Ritchken, George Pennacchi wrote a paper released in March 2009 titled Estimating Real and Nominal Term Structures Using Treasury Yields, Inflation, Inflation Forecasts, and Inflation Swap Rates:

This paper develops and estimates an equilibrium model of the term structures of nominal and real interest rates. The term structures are driven by state variables that include the short term real interest rate, expected inflation, a factor that models the changing level to which inflation is expected to revert, as well as four volatility factors that follow GARCH processes. We derive analytical solutions for the prices of nominal bonds, inflation-indexed bonds that have an indexation lag, the term structure of expected inflation, and inflation swap rates. The model parameters are estimated using data on nominal Treasury yields, survey forecasts of inflation, and inflation swap rates. We find that allowing for GARCH effects is particularly important for real interest rate and expected inflation processes, but that long-horizon real and inflation risk premia are relatively stable. Comparing our model prices of inflation-indexed bonds to those of Treasury Inflation Protected Securities (TIPS) suggests that TIPS were underpriced prior to 2004 but subsequently were valued fairly. We find that unexpected increases in both short run and longer run inflation implied by our model have a negative impact on stock market returns.

Of most interest to me is the conclusion on the inflation risk premium:

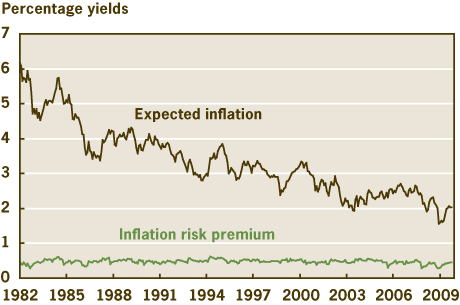
We can also examine how these risk premia varied over time during our sample period. Figure 8 plots expected inflation, the real risk premium, and the inflation risk premium for a 10-year maturity during the 1982 to 2008 period. Interestingly, while inflation expected over 10 years varied substantially, the levels of the real and inflation risk premia did not. The real risk premium for a 10-year maturity bond varied from 150 to 170 basis points, averaging 157 basis points. This real risk premium is consistent with the substantial slope of the real yield curve discussed earlier. The inflation risk premium for a 10-year maturity bond varied from 38 to 60 basis points and averaged 51 basis points. These estimates of the 10-year inflation risk premium fall within the range of those estimated by other studies.[Footnote]

Footnote: For example, a 10-year inflation risk premium averaging 70 basis points and ranging from 20 to 140 basis points is found by Buraschi and Jiltsov (2005). Using data on TIPS, Adrian and Wu (2008) find a smaller 10-year inflation risk premium varying between -20 and 20 basis points.

and

For example, D’Amico et al. (2008) find a large “liquidity premium” during the early years of TIPS’s existence, especially before 2004. They conclude that until more recently, TIPS yields were difficult to account for within a rational pricing framework. Shen (2006) also finds evidence of a drop in the liquidity premium on TIPS around 2004. He notes that this may have been due to the U.S. Treasury’s greater ssuance of TIPS around this time, as well as the beginning of exchange traded funds that purchased TIPS. Another contemporaneous development that may have led to more fairly priced TIPS was the establishment of the U.S. inflation swap market beginning around 2003. Investors may have arbitraged the underpriced TIPS by purchasing them while simultaneously selling inflation payments via inflation swap contracts.

and additionally:

Our estimated model also suggests that shocks to both short run and longer run inflation coincide with negative stock returns. An implication is that stocks are, at best, an imperfect hedge against inflation. This underscores the importance of inflation-linked securities as a means for safeguarding the real value of investments.

Joseph G. Haubrich of the Cleveland Fed provides a primer on the topic at A New Approach to Gauging Inflation Expectations, together with some charts:

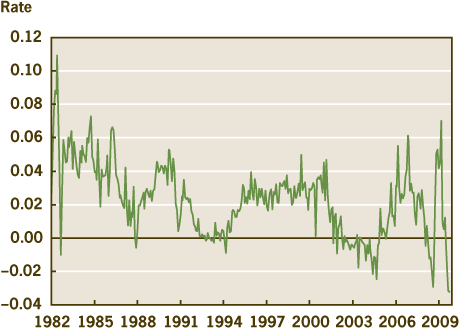
The first chart is the model’s 1-month real interest rate

Click for big

 
Click for big

The methodology is used in the Cleveland Fed Estimates of Inflation Expectations:

The Federal Reserve Bank of Cleveland reports that its latest estimate of 10-year expected inflation is 1.53 percent. In other words, the public currently expects the inflation rate to be less than 2 percent on average over the next decade.

The Cleveland Fed’s estimate of inflation expectations is based on a model that combines information from a number of sources to address the shortcomings of other, commonly used measures, such as the “break-even” rate derived from Treasury inflation protected securities (TIPS) or survey-based estimates. The Cleveland Fed model can produce estimates for many time horizons, and it isolates not only inflation expectations, but several other interesting variables, such as the real interest rate and the inflation risk premium. For more detail, see the links in the See Also box at right.

On October 15, ten-year nominal treasuries yielded 2.50%, while 10-Year TIPS yielded 0.46%, so the Cleveland Fed has decomposed the Break-Even Inflation Rate of 204bp into 1.53% expected inflation and 0.51% Inflation Risk Premium.

I find myself in the uncomfortable position of being deeply suspicious of this decomposition without being able to articulate specific objections to the theory. The paper’s authors claim:

Comparing our model’s implied yields for inflation-indexed bonds to those of TIPS suggests that TIPS were underpriced prior to 2004 but more recently are fairly priced. Hence, the ‘liquidity premium’ in TIPS yields appears to have dissipated. The recent introduction of inflation derivatives, such as zero coupon inflation swaps, may have eliminated this mispricing by creating a more complete market for inflation-linked securities.

but I have great difficulty with the concept that there is no significant liquidity premium in TIPS. The estimation of the 1-month real rate looks way, way too volatile to me. I suspect that the answer to my problems is buried in the estimation methods between the market price of inflation swaps and the forecasts of estimated inflation, but I cannot find it … at least, not yet!

Interesting External Papers

Flash Crash: Order Toxicity?

As reported by Bloomberg, David Easley, Marcos Mailoc Lopez de Prado and Maureen O’Hara have published a paper titled The Microstructure of the ‘Flash Crash’: Flow Toxicity, Liquidity Crashes and the Probability of Informed Trading:

The ‘flash crash’ of May 6th 2010 was the second largest point swing (1,010.14 points) and the biggest one-day point decline (998.5 points) in the history of the Dow Jones Industrial Average. For a few minutes, $1 trillion in market value vanished. In this paper, we argue that the ‘flash crash’ is the result of the new dynamics at play in the current market structure, not conjunctural factors, and therefore similar episodes are likely to occur again. We highlight the role played by order toxicity in affecting liquidity provision, and we provide compelling evidence that the collapse could have been anticipated with some degree of confidence given the increasing toxicity of the order flow in the hours and days prior to collapse. We also show that a measure of this toxicity, the Volume-Synchronized Probability of Informed Trading (the VPIN* informed trading metric), Granger-causes volatility, while the reciprocal is less likely, and that it takes on average 1/10 of a session’s volume for volatility to adjust to changes in the VPIN metric. We attribute this cause-effect relationship to the impact that flow toxicity has on market makers’ willingness to provide liquidity. Since the ‘flash crash’ might have been avoided had liquidity providers remained in the marketplace, a solution is proposed in the form of a ‘VPIN contract’, which would allow them to dynamically monitor and manage their risks.

They make the point:

Providing liquidity in a high frequency environment introduces new risks for market makers. When order flows are essentially balanced, high frequency market makers have the potential to earn razor thin margins on massive numbers of trades. When order flows become unbalanced, however, market makers face the prospect of losses due to adverse selection. The market makers’ estimate of the toxicity (the expected loss from trading with position takers) of the flow directed to them by position takers now becomes a crucial factor in determining their participation. If they believe that this toxicity is too high, they will liquidate their positions and leave the market.

In summary, we see three forces at play in the recent market structure:

  • Concentration of liquidity provision into a small number of highly specialized firms.
  • Reduced participation of retail investors resulting in increased toxicity of the flow received by market makers.
  • High sensitivity of liquidity providers to intraday losses, as a result of the liquidity providers low capitalization, high turnover, increased competition and small profit target.

Quick! Sign up the big banks to provide liquidity through proprietary trading! Oh … wait ….

Further, they make the point about market-making:

To understand why toxicity of order flow can induce such behavior from market makers, let us return to the role that information plays in affecting liquidity in the market. Easley and O’Hara (1992) sets out the mechanism by which informed traders extract wealth from liquidity providers. For example, if a liquidity provider trades against a buy order he loses the difference between the ask price and the expected value of the contract if the buy is from an informed trader. On the other hand, he gains the difference between the ask price and the expected value of the contract if the buy is from an uninformed trader. This loss and gain, weighted by the probabilities of the trade arising from an informed trader or an uninformed trader just balance due to the intense competition between liquidity providers.

[Formula]

If flow toxicity unexpectedly rises (a greater than expected fraction of trades arises from informed traders), market makers face losses. Their inventory may grow beyond their risk limits, in which case they are forced to withdraw from the side of the market that is being adversely selected. Their withdrawal generates further weakness on that side of the market and their inventories keep accumulating additional losses. At some point they capitulate, dumping their inventory and taking the loss. In other words, extreme toxicity has the ability of transforming liquidity providers into liquidity consumers.

The earlier paper by these authors, detailing the calculation of VPIN, was titled Measuring Flow Toxicity in a High Frequency World:

Order flow is regarded as toxic when it adversely selects market makers, who are unaware that they are providing liquidity at their own loss. Flow toxicity can be expressed in terms of Probability of Informed Trading (PIN). We present a new procedure to estimate the Probability of Informed Trading based on volume imbalance (the VPIN* informed trading metric). An important advantage of the VPIN metric over previous estimation procedures comes from being a direct analytic procedure which does not require the intermediate estimation of non-observable parameters describing the order flow or the application of numerical methods. It also renders intraday updates mutually comparable in a frequency that matches the speed of information arrival (stochastic time clock). Monte Carlo experiments show this estimate to be accurate for all theoretically possible combinations of parameters, even for statistics computed on small samples. Finally, the VPIN metric is computed on a wide range of products to show that this measure anticipated the ‘flash crash’ several hours before the markets collapsed

Although the calibration is interesting and perhaps valuable, the underlying theory is pretty simple:

classify each transaction as buy or sell initiated:[Footnote]
a. A transaction i is a buy if either:
i. [Price increases], or
ii. [Price unchanged] and the [previous transaction] was also a buy.
b. Otherwise, the transaction is a sell.

Footnote: According to Lee and Ready (1991), 92.1% of all buys at the ask and 90.0% of all sells at the bid are correctly classified by this simple procedure. See Lee, C.M.C. and M.J. Ready (1991): “Inferring trade direction from intraday data”, The Journal of Finance, 46, 733-746. Alternative trade classification algorithms could be used.

and VPIN is simply the absolute value of the difference between buy-volume and sell-volume, expressed as a fraction of total volume. Yawn.

The VPIN indicator is very similar to Joe Granville’s Technical Analysis indicator On-Balance Volume. While Easley, Lopez de Prado and O’Hara have dressed it up with a little math and illustrated it in the glorious TA tradition of anecdotal cherry picking, they have neither provided anything particularly new nor proved their case.

Interesting External Papers

Tranche Retention: One Size Doesn't Fit All

The Federal Reserve Board has released, as required by the Dodd-Frank Act, a study titled Report to the Congress on Risk Retention:

The study defines and focuses on eight loan categories and on asset-backed commercial paper (ABCP). ABCP can be backed by a variety of collateral types but represents a sufficiently distinct structure that it warrants separate consideration. These nine categories, which together account for a significant amount of securitization activity, are
1. Nonconforming residential mortgages (RMBS)
2. Commercial mortgages (CMBS)
3. Credit cards
4. Auto loans and leases
5. Student loans (both federally guaranteed and privately issued)
6. Commercial and industrial bank loans (collateralized loan obligations, or CLOs)
7. Equipment loans and leases
8. Dealer floorplan loans
9. ABCP

The study also addresses the interaction of credit risk retention and accounting standards, including FAS 166 and 167. Depending on the type and amount of risk retention required, a securitizer could become exposed to potentially significant losses of the issuance entity, which could require accounting consolidation when considered with the securitizer’s decision making power over the issuance entity. Given the earnings and regulatory capital consequences of maintaining assets on–balance sheet, companies may be encouraged to structure securitization to again achieve off-balance-sheet treatment. For example, institutions may cede the power over ABS issuance entities by selling servicing rights or distancing themselves from their customers primarily to avoid consolidating the assets and liabilities of the issuance entities. Alternatively, the potential interaction of accounting treatment, regulatory capital requirements and new credit risk retention standards may make securitization a less attractive form of financing and may result in lower credit availability.

Overall, the study documents considerable heterogeneity across asset classes in securitization chains, deal structure, and incentive alignment mechanisms in place before or after the financial crisis. Thus, this study concludes that simple credit risk retention rules, applied uniformly across assets of all types, are unlikely to achieve the stated objective of the Act—namely, to improve the asset-backed securitization process and protect investors from losses associated with poorly underwritten loans.

Moreover, the Board recommends that that the following considerations should be taken into account by the agencies responsible for implementing the credit risk retention requirements of the Act in order to help ensure that the regulations promote the purposes of the Act without unnecessarily reducing the supply of credit. Specifically, the rulemaking agencies should:
1. Consider the specific incentive alignment problems to be addressed by each credit risk retention requirement established under the jointly prescribed rules.

2. Consider the economics of asset classes and securitization structure in designing credit risk retention requirements.

3. Consider the potential effect of credit risk retention requirements on the capacity of smaller market participants to comply and remain active in the securitization market.

4. Consider the potential for other incentive alignment mechanisms to function as either an alternative or a complement to mandated credit risk retention.

5. Consider the interaction of credit risk retention with both accounting treatment and regulatory capital requirements.

6. Consider credit risk retention requirements in the context of all the rulemakings required under the Dodd–Frank Act, some of which might magnify the effect of, or influence, the optimal form of credit risk retention requirements.

7. Consider that investors may appropriately demand that originators and securitizers hold alternate forms of risk retention beyond that required by the credit risk retention regulations.

8. Consider that capital markets are, and should remain, dynamic, and thus periodic adjustments to any credit risk retention requirement may be necessary to ensure that the requirements remain effective over the longer term, and do not provide undue incentives to move intermediation into other venues where such requirements are less stringent or may not apply.

Gee, it sounds like tranche-retention isn’t a magic bullet after all, eh?

Tranche retention is a silly idea. It is, after all,tranche retention that exacerbated the crisis, since the big banks kept a significant portion of their toxic assets on the books anyway; in addition, it seeks to diminish the role of due diligence on the part of the buyers of these things.

Tranche retention was last discussed on PrefBlog in the post SEC Proposes ABS Tranche Retention Requirement

Interesting External Papers

Flash Crash Blame Game Gets Louder

So let’s review the story so far:

The SEC Report blames Waddell Reed, a mutual fund company; although they were not named there is widespread agreement that it was their order to sell 75,000 eMini contracts as a market order that swamped the liquidity available on a nervous day.

CFTC Chairman Gary Gensler takes this as an indication the executing broker should have refused or adjusted the trade and is musing about increased regulation that would force brokers to take responsibility for their clients’ orders. I think this is just craziness.

Nanex is sticking to its original hypothesis, that the Flash Crash was caused by malignant quote stuffing. I am prepared to accept that this should be investigated further; not that I think the possible quote-stuffing was the trigger-factor, but it is possible that a predatory algorithm did it in order to make a bad situation worse for its own advantage.

Now there are some new snippets: Dave Cummings, Owner & Chairman, Tradebot Systems, Inc. doesn’t mince words: Waddell Stupidity Caused Crash:

Wow! Who puts in a $4.1 billion order without a limit price? The trader at Waddell & Reed showed historic incompetence.

The execution of this sell program resulted in the largest net change in daily position of any trader in the E-Mini since the beginning of the year.

The trader could have easily put a price limit on the order, but recklessly chose not to. The Sell Algorithm performed exactly as it was designed. It angers me when people blame technology for what are clearly lapses in human judgment.

“We did what our fund shareholders rightly would expect of us. There is no evidence to suggest that our trades disrupted the market on May 6,” the company said in a letter to its financial advisers.

Their shareholders probably lost $100 million that day (versus a reasonable execution 3% higher).

After the flash crash but before the CFTC/SEC report came out, Waddell executives were unloading stock in their company. According to SEC filings, Waddell CEO Henry Herrmann sold $2,455,000 and Ivy Asset Strategy Fund Manager Michael Avery dumped $273,600.

Themis, however, has singled out the internalizers for special opprobrium:

Internalizers, a term the SEC is using in its Flash Crash Report, handle individual investor retail market orders.

(For example, you can look on Ameritrade’s 606 report for Q2 2010, and see that 83% of market orders are sold to Citadel for about .0015/share on average.)

Typically, the internalizer then takes the other side of the trade for “a very large percentage” of this flow. On May 6th, the SEC found that there was a departure from this practice (see page 58 of the SEC Report). As the market was falling dramatically, the internalizers (we don’t know which internalization firms the SEC is referring to) continued to short stock to retail market buy orders, but they dramatically stopped internalizing retail market sell orders, and instead flooded the public market with those orders. When the market stopped falling, and rose dramatically almost as quickly as it fell, the internalizers reversed that pattern, and internalized retail sell market orders, and flooded the public market with retail market buy orders. To restate this plainly, the internalizers used their speed advantages to pick and choose for its P/L which orders it wanted to take the other side of. For the ones they did not wish to take the other side of, they routed them to the markets as riskless-principal trades. The practice not only strikes us as patently unfair, but the number of orders that flooded the marketplace was massive. As such it caused data integrity issues (widening the difference between speeds of the CQS public data and the co-located data), further perpetuating the downward cycle in the marketplace.

So let’s take a look at page 58 of the report:

For instance, some OTC internalizers reduced their internalization on sell-orders but continued to internalize buy-orders, as their position limit parameters were triggered. Other internalizers halted their internalization altogether. Among the rationales for lower rates of internalization were: very heavy sell pressure due to retail market and stop-loss orders, an unwillingness to further buy against those sells, data integrity questions due to rapid prices moves (and in some cases data latencies), and intra-day changes in P&L that triggered predefined limits.

Themis’ argument is not only unsupported by the facts as we know them, but reflects a rather bizarre view of the role of internalizers. It is not the responsibility of internalizers to sterilize the market impact of their clients’ orders. It is not the responsibility of internalizers to buy whatever’s thrown at them in a crisis situation. Internalizers exist to make money for their shareholders, full stop.

Even if they had been picking and choosing which orders to satisfy to execute their view of the market – what of it? Nothing illegal with that and nothing wrong with that.

Themis closes by squaring its rot for a good boo-hoo-hoo:

Retail investors were clearly the biggest loser on May 6th. They trusted that their brokers would execute their orders in a fair and efficient manner. However, considering that half of all broken trades were retail trades, and that the arbitrary cutoff was 60% away from pre flash crash levels, the retail investor ended up paying the highest price for the structural failings of our market.

The brokers did, in fact, execute their orders in a fair and eficient manner. These were market orders, the internalizers could not, or would not, equal or beat the external public markets, so they passed them on. While I may be incorrect, I don’t believe the internalizers offer any advice at all: they simply execute orders. Their clients – whether they are direct retail clients of the internalizer, or small brokerages that have contracted for execution services – have explicitly decided they don’t want costly advice.

The “structural failings of our market” is just another bang at the Themis drum. There is no evidence whatsoever that structural failings had anything to do with the Flash Crash – there was simply a large market order that swamped available liquidity. Additionally, it was the clients themselves who decided to put in Stop-Loss orders, as I assume most of these things were. If these clients want to put in the World’s Dumbest Order Type, because they read about “protecting your profits” on the Internet, they have only themselves to blame.

Not satisfied with blaming internalizers, Themis continues with Another May 6th Villain – “Hot Potato” Volume:

Chairman Gensler is acknowledging what we have said repeatedly: volume does not equal liquidity. Our marketplace has become addicted to “hot potato volume”; in fact, we have become hostage to it.

Were HFT firms churning and playing “hot potato” to such an extreme extent, such that they were skewing volume statistics and unnecessarily (and harmfully) driving up volume? In the May 6th E-mini contract example, much has been made about the size of the trade. While it may be true that this was a large trade, shouldn’t the market have been able to absorb a 9% participation rate? In addition, let us dissect the 75,000 contract E-Mini sell order. Only 35,000 of those contracts were sold on the way down; the remaining 40,000 were sold in the rebounding tape. Also, of the 35,000 contracts sold in the down tape, only 18,000 of them were executed aggressively and the remaining 17,000 contracts were executed passively (see footnote 14 on page 16 of the CFTC/SEC report).

This “hot potato” volume is also very similar to what is known as “circular trading”. Circular trading is rampant in India and their regulators have been grappling with it for years. Circular trades happen when a closely knit set of market participants, mainly brokers, buy and sell shares frequently among themselves to effect a security price. These trades do not represent a change in ownership of the security. They are simply being passed back and forth to create the illusion of price movement and volume. “Hot potato” volume is not something that should be just overlooked as harmless since it is only HFT’s trading with each other. Their volume drives institutional decisions, albeit less so going forward, we hope. Most damaging though, is that hot potato volume lulls everyone into an illusion of healthy markets possessing liquidity, when in fact the markets have become shelled out and hollow.

Naturally, if the hot-potato volume was actually the result of collusion between the HFTs, they would be guilty of market manipulation. But there is no evidence that they colluded – as far as is known, each one was trading as principal, trying to squeeze a profit out of a wild marketplace. Themis has been banging its drum for so long they’ve started “lawyering” the markets, rather than “judging” them – lawyers, of course, being paid to find any scrap of possibility that would help their case.

Update: Meanwhile the SEC ponders regulating trading decisions:

Although regulators have rolled out a program to help give a company’s stock a reprieve if it is in freefall, Schapiro said that more needed to be done.

“We really need to do a deeper dive,” Schapiro said at Fortune’s Most Powerful Women Summit. “We are looking at whether these algos ought to have some kind of risk management controls.”

Scott Cleland blames automated index trading:

Simply, automated index trading technology inherently makes financial markets much more crash/crisis-prone than less, because it inherently creates disastrously inefficient market outcomes, where in certain conditions, markets can not possibly clear in a fair and orderly manner.

  • That’s because systemic automated index trading technology by design creates near-instantaneous one-way feedback loops, that when done by enough traders naturally concentrates market momentum in only one direction, creating the disastrous conditions where there is no one else in the market capable or willing to take the other side of all these systemic out-for control automated index trades.

That sounds very fishy. Details, please!

He also blames mass indexing:

Regulators and Congress have yet to confront sufficiently the dark side of systemic automated index trading which is highly prone in certain conditions, to create a huge automated “falling-knife-dynamic” which no one can possibly catch on the way down.

  • Unfortunately, regulators continue to have a crash-prone bias for maximizing trade transactional speed efficiency, rather than focusing first and foremost on the critical importance of true market efficiency, which is ensuring that markets can clear in an orderly manner and not be manipulated by speculation like automated index trading.
  • This regulator blind spot that mass indexing is largely benign, “efficient” and productive, ignores increasing evidence that it is destructive and a predictable recipe for contributing to market failure, like it did in both the Financial Crisis and the Flash Crash.

The link has a provocative abstract, anyway:

Trillions of dollars are invested through index funds, exchange-traded funds, and other index derivatives. The benefits of index-linked investing are well-known, but the possible broader economic consequences are unstudied. I review research which suggests that index-linked investing is distorting stock prices and risk-return tradeoffs, which in turn may be distorting corporate investment and financing decisions, investor portfolio allocation decisions, fund manager skill assessments, and other choices and measures. These effects may intensify as index-linked investing continues to grow in popularity.

Well, sure. It’s well known that correlations are increasing. I think it’s wonderful! If ABC goes up 1% for no other reason than DEF went up 1% … that’s a trading opportunity! As indexing proportions go up, the profitability of the little known technique of “thinking about what you’re doing” goes up, attracting new entrants and driving the indexing proportion down.

But as Mr. Cleland states:

  • At core, all the major trends are concentrating more and more financial resources in the market in fewer and fewer hands, with shorter and shorter time horizons, with more and more automation, and predicated on fewer and fewer core inputs.
  • In other words, information technology efficiencies create unprecedented concentration of money flows that now try to pirouette immediately around on an unprecedented concentration of key external variables.
  • Simply, more people and more money are betting on fewer and fewer core market variables so the automated efficiencies of information technology are blurring the distinction between the indexing “herd” and the “market” itself.
  • The out-of-control use of indexing, means the index herd is a bigger and dumber herd of lemmings that collectively can run off a cliff faster and more efficiently than any supposed market-efficient counter-force that could possibly bring the market into equilibrium.


It is worth noting that John Bogle, Vanguard’s Founder, and the “father’ of index investing, called my 6-11-09 thesis that indexing was one of the root causes of the Financial Crisis — “nuts.”

At some point in the not too distant future, regulators and Congress will have to confront the unpleasant and increasingly undeniable reality that the capital markets that everyone depends on for capital formation, wealth creation, economic growth and job creation are no longer working as designed and as necessary, but have been hijacked by the mindless lemming herd of automated indexers that somehow all blindly still believe that others can still carry them all to value creation long term.

  • Arbitrage can work when a few do it, but not when the arbitrageurs collectively and effectively become the market itself.
Interesting External Papers

Nanex & Themis Respond to Flash Crash Report

Nanex, whose initial report on the Flash Crash was discussed on August 9, has published a new and improved timeline and summary of their version of events. According to them:

It appears that the event that sparked the rapid sell off at 14:42:44:075 was an immediate sale of approximately $125 million worth of June 2010 CME eMini futures contracts followed 25ms later by the immediate sale of over $100 million worth of the top ETF’s such as SPY, DIA, QQQQ, IVV, IWM, SDS, XLE, and EEM. Both the eMini and ETF sales were sudden and executed at prevailing bid prices. The orders appeared to hit the bids.

Quote Saturation (see item 1 on chart)

Approximately 400ms before the eMini sale, the quote traffic rate for all NYSE, NYSE Arca, and Nasdaq stocks surged to saturation levels within 75ms. This is a new and surprising discovery. Previouisly, when we looked at time frames below 1 second, we thought the increase in quote traffic coincided with the heavy sales, but we now know that the surge in quotes preceded the trades by about 400ms. The discovery is surprising, because nearly all the trades in the eMini and ETFs occurred at prevailing bid prices (a liquidity removing event).

While searching previous days for similarities to the time period at the start of the May 6th drop, we found a very close match starting at 11:27:46.100 on April 28, 2010 — just a week and a day before May 6th. We observed it had the same pattern — high, saturating quote traffic, then approximately 500ms later a sudden burst of trades on the eMini and the top ETF’s at the prevailing bid prices, leading to a delay in the NYSE quote and a sudden collapse in prices. The drop only lasted a minute, but the parallels between the start of the drop and the one on May 6th are many. Details on April 28, 2010

The quote traffic surged again during the ETF sell event and remained at saturation levels for nearly 500ms. Additional selling waves began seconds later sending quote traffic rates back to saturation levels. This tidal wave of data caused delays in many feed processing systems and networks. We discovered two notable delays: the NYSE network that feeds into CQS (the "NYSE-CQS Delay"), and the calculation and dissemination of the Dow Jones Indexes (DOW Delay).

Now, this is interesting, because according to the SEC / CFTC Report:

At 2:32 p.m., against this backdrop of unusually high volatility and thinning liquidity, a large fundamental5 trader (a mutual fund complex) initiated a sell program to sell a total of 75,000 E-Mini contracts (valued at approximately $4.1 billion) as a hedge to an existing equity position.

However, on May 6, when markets were already under stress, the Sell Algorithm chosen by the large trader to only target trading volume, and neither price nor time, executed the sell program extremely rapidly in just 20 minutes.

Notice that? The time designated by Nanex as the start of the alleged hanky-panky is slap bang in the middle of the execution of the large trade. What’s more:

HFTs and intermediaries were the likely buyers of the initial batch of orders submitted by the Sell Algorithm, and, as a result, these buyers built up temporary long positions. Specifically, HFTs accumulated a net long position of about 3,300 contracts. However, between 2:41 p.m. and 2:44 p.m., HFTs aggressively sold about 2,000 E-Mini contracts in order to reduce their temporary long positions.

In the four-and-one-half minutes from 2:41 p.m. through 2:45:27 p.m., prices of the E-Mini had fallen by more than 5% and prices of SPY suffered a decline of over 6%.

The second liquidity crisis occurred in the equities markets at about 2:45 p.m. Based on interviews with a variety of large market participants, automated trading systems used by many liquidity providers temporarily paused in reaction to the sudden price declines observed during the first liquidity crisis. These built-in pauses are designed to prevent automated systems from trading when prices move beyond pre-defined thresholds in order to allow traders and risk managers to fully assess market conditions before trading is resumed.

So here’s something for the conspiracy theorists to chew on (this is me here, not Nanex): We can take the existence of Waddell Reed’s sell order for 75,000 contracts ($4.1-billion notional) as a fact, and we can take the start time of 2:32 as a fact. It also seems reasonable to suppose that there was a change in the tone of the market at 2:42, about the time that the HFTs filled up to their position limit of about 3,000 contracts – but that’s speculation which must be investigated. We know that they started selling aggressively – presumably willing to take a loss on their trade rather than keep the exposure – at 2:41: the SEC says so and we can take their statements of fact as accurate (although there will be some who disagree).

So here’s the conspiracy theory: was there quote-stuffing by a predatory algorithm? It seems likely that it is possible to determine that there is a single large, simple algorithm selling contracts; by 2:42 it had been operating for ten minutes, which is a lifetime. Since the algo was provided by Barclays, it is probably quite widespread and has probably been taken apart by a large number of HFTs – maybe even by looking at the source code, perhaps by reverse engineering. But there are a lot of predatory algos that look for signatures of herbivorous algos and eat them alive – that’s common knowledge.

So here’s the hypothetical structure of a hypothetical predatory algo:

  • Identify a large selling algo
  • Boost surveillance of the market and identify the exhaustion point of the major liquidity providers
  • Quote-stuff to drive out the remaining liquidity providers
  • Take advantage of the large selling algo with no competition. Do it right and you can max out your position limit on this just a hair above the CME circuit-breaker point

While the SEC / CFTC report dismissed quote-stuffing as the actual cause of the Flash Crash, a careful reading of what they said shows it cannot be ruled out as a possible deliberate accellerator of the decline. It will be most interesting to see how this plays out. I think the critical thing to examine is who bought the contracts in between the onset of order saturation and the tripping of the CME circuit-breaker.

One way or another, Eric Hunsader of Nanex is sticking to his guns:

But Hunsader said regulators largely ignored his ‘quote-stuffing’ theory which argued that high-frequency traders had contributed to the crash by flooding the market with so many orders that it delayed the posting of prices to the consolidated quote system.

‘It just seemed to me too much ink was devoted to try to discredit theories without any evidence, without any basis, other than just, ‘We looked at it, we talked to these people, and now, we dismissed it,” Hunsader said.

‘Obviously they didn’t follow up. I felt everything I sent to them went into a black hole,’ said Hunsader, who runs Nanex, a four-person data provider shop in Chicago.

Not only did regulators dismiss his observations, Hunsader said, they made a hash of trading data that exchanges provided them because they relied on one-minute intervals — a far too simplistic approach to understanding the market, he said.

‘When we first did this, we did it on a one-second basis and we didn’t really see the relationship between the trades and the quote rates until we went under a second,’ Hunsader said.

‘Clearly they didn’t have the dataset to do it in the first place. One-minute snapshot data, you can’t tell what happened inside of that minute,’ he said.

Themis doesn’t have much to say:

We had anticipated in our previously released paper that the core of their fix would be coordinated circuit breakers with a limit up/limit down feature, and that is in fact where they are leaning in this report. We see no mention at all of order cancellation fees, addressing the validity of rebate maker/taker model, or fiduciary language. We see little language in the way of criticizing a system that involves fifty-plus destinations connected at insane speeds, with different speeds for the public information and the co-located bought-and-paid for information.

We see nothing outside the circuit breakers addressed meaningfully. We were hoping for more in the way of solutions, rather than just post-mortems. Having said that, we have faith in Chairman Schapiro, and realize that this must be the first step, and that we all must be patient. This is a report presented to the advisory committee; recommendations are to come from them.

Update: One totally fascinating snippet I didn’t mention above is detailed with cool charts by Nanex:


Click for big

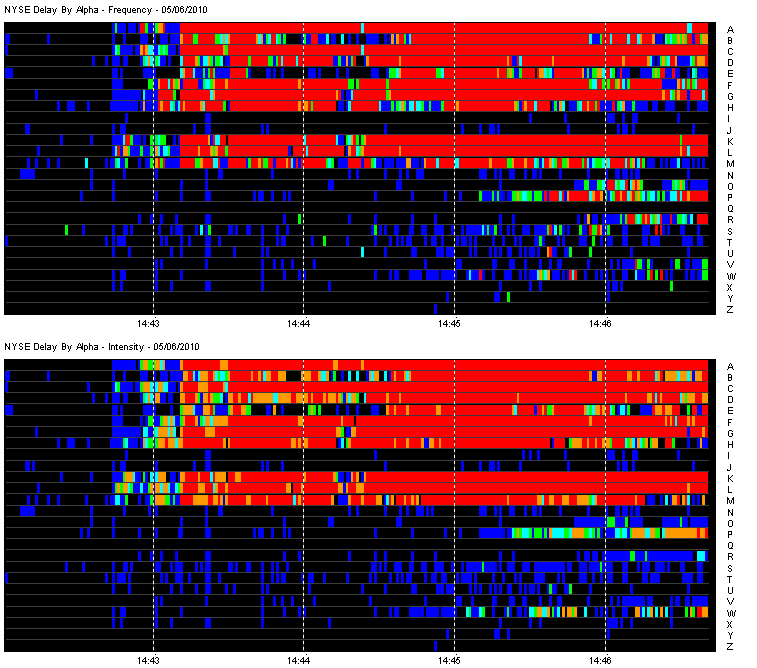
The chart above shows the frequency and intensity of the delay in NYSE’s quote sent to CQS grouped by the symbol’s first character. Stocks beginning with letters A through M, except for I and J saturate to higher levels, and more quickly than stocks beginning with other letters. The stock symbol GE was found to have reached a delay of 24 seconds.

It would be fascinating to learn whether the bifurcation was due to the NYSE’s inputs, or due to their internal computer systems.

Interesting External Papers

Flash Crash: Incompetence, Position Limits, Retail

The SEC & CFTC have released the FINDINGS REGARDING THE MARKET EVENTS OF MAY 6, 2010:

At 2:32 p.m., against this backdrop of unusually high volatility and thinning liquidity, a large fundamental5 trader (a mutual fund complex) initiated a sell program to sell a total of 75,000 E-Mini contracts (valued at approximately $4.1 billion) as a hedge to an existing equity position.

This large fundamental trader chose to execute this sell program via an automated execution algorithm (“Sell Algorithm”) that was programmed to feed orders into the June 2010 E-Mini market to target an execution rate set to 9% of the trading volume calculated over the previous minute, but without regard to price or time.

As noted by Bloomberg, the identity of the seller is no mystery:

While the report doesn’t name the seller, two people with knowledge of the findings said it was Waddell & Reed Financial Inc. The mutual-fund company’s action may not have caused a crash if there weren’t already concern in the market about the European debt crisis, the people said.

“When you don’t put a limit price on orders, that’s what can happen,” said Paul Zubulake, senior analyst at Boston-based research firm Aite Group LLC. “This is not a manipulation or an algorithm that ran amok. It was told to be aggressive and not use a price. The market-making community actually absorbed a lot of the selling, but then they had to hedge their own risk.”

According to a recent press release:

At June 30, 2010, the company had approximately $68 billion in total assets under management.

So my questions for Waddel Reed are:

  • Why is the sale of $4.1-bilion (about 6% of AUM) in securities a binary decision?
  • Why are you putting in market orders for $4.1-billion?
  • Is there anybody there with any brains at all?

So this is simply the old market-impact costs rigamarole writ large: Bozo Trader wakes up one morning, finds his big toe hurts and concludes that he should sell X and buy Y. At the market! No further analysis needed.

Back to the report. Amusingly:

However, on May 6, when markets were already under stress, the Sell Algorithm chosen by the large trader to only target trading volume, and neither price nor time, executed the sell program extremely rapidly in just 20 minutes.(footnote)

Footnote: At a later date, the large fundamental trader executed trades over the course of more than 6 hours to offset the net short position accumulated on May 6.

I guess his big toe wasn’t hurting the following week. Still, from a market perspective, I think it’s pretty impressive that the market was able to absorb that much selling while limiting the market impact to what was actually experienced.

HFTs and intermediaries were the likely buyers of the initial batch of orders submitted by the Sell Algorithm, and, as a result, these buyers built up temporary long positions. Specifically, HFTs accumulated a net long position of about 3,300 contracts. However, between 2:41 p.m. and 2:44 p.m., HFTs aggressively sold about 2,000 E-Mini contracts in order to reduce their temporary long positions. At the same time, HFTs traded nearly 140,000 E-Mini contracts or over 33% of the total trading volume. This is consistent with the HFTs’ typical practice of trading a very large number of contracts, but not accumulating an aggregate inventory beyond three to four thousand contracts in either direction.

The Sell Algorithm used by the large trader responded to the increased volume by increasing the rate at which it was feeding the orders into the market, even though orders that it already sent to the market were arguably not yet fully absorbed by fundamental buyers or cross-market arbitrageurs. In fact, especially in times of significant volatility, high trading volume is not necessarily a reliable indicator of market liquidity.

3,300 contracts is about $180-million. So now we know how much money the HFT guys are prepared to risk.

Still lacking sufficient demand from fundamental buyers or cross-market arbitrageurs, HFTs began to quickly buy and then resell contracts to each other – generating a “hot-potato” volume effect as the same positions were rapidly passed back and forth. Between 2:45:13 and 2:45:27, HFTs traded over 27,000 contracts, which accounted for about 49 percent of the total trading volume, while buying only about 200 additional contracts net.

At this time, buy-side market depth in the E-Mini fell to about $58 million, less than 1% of its depth from that morning’s level.

So they’re saying that total depth in the morning was $5.8-billion, but it is certainly possible that a lot of that was duplicates. There is not necessarily a high correlation between the amount of bids you have on the table and the amount of money you’re prepared to risk: you might intend on pulling some orders as others get filled, or immediately hedging your exposure as each order is executed in turn.

[Further explanation added 2010-10-2: For instance, we might have two preferred share issues trading, A & B, both quoted at 23.00-20. I want to sell A and buy B, but since I have a functioning brain cell I want to do this at a fixed spread. For purposes of this example, I want to execute the swap as long as I can do both sides at the same price. I don’t care much what that price is.

What I might do is enter an offer on A at 23.20 and a bid on B at 23.00. If one side of the order is executed, I will then change the price of the other. If things work out right, I’ll get a bit of my trade done. It could be that only one side of the trade will execute and the other won’t – that’s simply part of the risks of trading and that’s what I get paid to judge and control: if I get it right often enough, my clients will make more money than they would otherwise.

The point is that my bid on B is contingent. If the quote on A moves, I’m going to move my bid on B. If the market gets so wild that I judge that I can’t count on executing either side at a good price after the first side is executed, I’m going to pull the whole thing and wait until things have settled down. I do not want to change my total exposure to the preferred share market, I only want to swap within it.

Therefore, you can not necessarily look at the order book of B, see my bid order there, and conclude that it’s irrevocably part of the depth that will prevent big market moves.

Once you start to become suspicious that you cannot, in fact, lay off your exposure instantly, well then, the first thing you do is start cancelling your surplus orders…

Between 2:32 p.m. and 2:45 p.m., as prices of the E-Mini rapidly declined, the Sell Algorithm sold about 35,000 E-Mini contracts (valued at approximately $1.9 billion) of the 75,000 intended. During the same time, all fundamental sellers combined sold more than 80,000 contracts net, while all fundamental buyers bought only about 50,000 contracts net, for a net fundamental imbalance of 30,000 contracts. This level of net selling by fundamental sellers is about 15 times larger compared to the same 13-minute interval during the previous three days, while this level of net buying by the fundamental buyers is about 10 times larger compared to the same time period during the previous three days.

In the report, they provide a definition:

We define fundamental sellers and fundamental buyers as market participants who are trading to accumulate or reduce a net long or short position. Reasons for fundamental buying and selling include gaining long-term exposure to a market as well as hedging already-existing exposures in related markets.

They would have been better off sticking to the street argot of “Real money” and “hot money”. Using the word “fundamental” implies the traders know what they’re doing, when I suspect most of the are simply cowboys and high-school students, marketting their keen insights into quantitative momentum-based computer-driven macro-strategies.

Many over-the-counter (“OTC”) market makers who would otherwise internally execute as principal a significant fraction of the buy and sell orders they receive from retail customers (i.e., “internalizers”) began routing most, if not all, of these orders directly to the public exchanges where they competed with other orders for immediately available, but dwindling, liquidity.

Even though after 2:45 p.m. prices in the E-Mini and SPY were recovering from their severe declines, sell orders placed for some individual securities and ETFs (including many retail stop-loss orders, triggered by declines in prices of those securities) found reduced buying interest, which led to further price declines in those securities.

OK, so a lot of stop-loss orders were routed through internalizers. Remember that; we’ll return to this point.

However, as liquidity completely evaporated in a number of individual securities and ETFs,11 participants instructed to sell (or buy) at the market found no immediately available buy interest (or sell interest) resulting in trades being executed at irrational prices as low as one penny or as high as $100,000. These trades occurred as a result of so-called stub quotes, which are quotes generated by market makers (or the exchanges on their behalf) at levels far away from the current market in order to fulfill continuous two-sided quoting obligations even when a market maker has withdrawn from active trading.

Stub quotes have to represent yet another triumph of the box-tickers. I mean, if you’re asking for continuous two-way markets as the price of privilege … shouldn’t you ensure that they’re meaningful two-way markets?

The summary briefly mentions the latency problem:

Although we do not believe significant market data delays were the primary factor in causing the events of May 6, our analyses of that day reveal the extent to which the actions of market participants can be influenced by uncertainty about, or delays in, market data.

The latency problem was discussed on August 9.

Now back to stop-losses:

For instance, some OTC internalizers reduced their internalization on sell-orders but continued to internalize buy-orders, as their position limit parameters were triggered. Other internalizers halted their internalization altogether. Among the rationales for lower rates of internalization were: very heavy sell pressure due to retail market and stop-loss orders, an unwillingness to further buy against those sells, data integrity questions due to rapid prices moves (and in some cases data latencies), and intra-day changes in P&L that triggered predefined limits.

As noted previously, many internalizers of retail order flow stopped executing as principal for their customers that afternoon, and instead sent orders to the exchanges, putting further pressure on the liquidity that remained in those venues. Many trades that originated from retail customers as stop-loss orders or market orders were converted to limit orders by internalizers prior to routing to the exchanges for execution. If that limit order could not be filled because the market continued to fall, then the internalizer set a new lower limit price and resubmitted the order, following the price down and eventually reaching unrealistically-low bids. Since internalizers were trading as riskless principal, many of these orders were marked as short even though the ultimate retail seller was not necessarily short.51 This partly helps explain the data in Table 7 of the Preliminary Report in which we had found that 70-90% of all trades executed at less than five cents were marked short.

That had really bothered me, so I’m glad that’s cleared up.

Detailed analysis of trade and order data revealed that one large internalizer (as a seller) and one large market maker (as a buyer) were party to over 50% of the share volume of broken trades, and for more than half of this volume they were counterparties to each other (i.e., 25% of the broken trade share volume was between this particular seller and buyer). Furthermore, in total, data show that internalizers were the sellers for almost half of all broken trade share volume. Given that internalizers generally process and route retail trading interest, this suggests that at least half of all broken trade share volume was due to retail customer sell orders.

In summary, our analysis of trades broken on May 6 reveals they were concentrated primarily among a few market participants. A significant number of those trades were driven by sell orders from retail customers sent to internalizers for immediate execution at then-current market prices. Internalizers, in turn, routed these orders to the public exchanges for execution at the NBBO. However, for those securities in which market makers had withdrawn their liquidity, there was insufficient buy interest, and many trades were executed at very low (and sometimes very high) prices, including stub quotes.

Stop-Loss: the world’s dumbest order-type.

In summary, this just shows that while the pool of hot money acting as a market-making buffer on price changes is very large, it can be exhausted … and when it’s exhausted, the same thing happens as when any buffer runs out.

Update: The Financial Post picked up a Reuters story:

The so-called flash crash sent the Dow Jones industrial average down some 700 points in minutes, exposing flaws in the electronic marketplace dominated by high-frequency trading.

I see no support for this statement at all. This was, very simply, just another case of market impact cost, distinguished only by its size. But blaming the HFT guys is fashionable this week…

Themis Trading has predicted:

  • Alter the existing single stock circuit breaker to include a limit up/down feature….
  • Eliminate stop-loss market orders….
  • Eliminate stub quotes and allow one-sided quotes (a stub quote is basically a place holder that a market maker uses in order to provide a two-sided quote)…Exchanges also recently proposed a ban on stub quotes. They requested that all market makers be mandated to quote no more than 8% away from the NBBO for stocks in the circuit breaker pilot program and during the hours that the circuit breakers are in effect (9:45am-3:35pm ET). Exchanges proposed that market makers be mandated to quote no further than 20% away from the NBBO during the 15 minutes after the opening and 25 minutes before the close….
  • Increase market maker requirements, including a minimal time for market makers to quote on the NBBO…..In addition, the larger HFTs believe that market makers should have higher capital requirements. Some smaller HFTs have not supported these proposed obligations, however. They fear that the larger HFTs will be able to meet these obligations and, in return, the larger HFTs will receive advantages from the exchanges that market makers usually enjoy. According to these smaller HFT’s, these advantages would include preferential access to the markets, lower fees and informational advantages. Smaller HFTs have warned that competition could be degraded and barriers to entry could be raised.

Ah, the good old compete-via-regulatory-capital-requirements game. Very popular, particularly in Canada.

And there’s at least one influential politician, Paul E. Kanjorski (D-PA), who wants to use the report to further his completely unrelated agenda:

“The SEC and CFTC report confirms that faster markets do not always lead to better markets,” said Chairman Kanjorski. “While automated, high-frequency trading may provide our markets with some benefits, it can also carry the potential for serious harm and market mischief. Extreme volatility of the kind we experienced on May 6 could happen again, as demonstrated by the volatility in individual stocks since then. To limit recurrences of that roller-coaster day and to bolster individual investor confidence, our regulators must expeditiously review and revise the rules governing market structure. Congress must also conduct oversight of these matters and, if necessary, put in place new rules of the road to ensure the fair, orderly and efficient functioning of the U.S. capital markets. The CFTC-SEC staff report will greatly assist in working toward these important policy goals.”

Update: FT Alphaville points out:

The CFTC, which wrote the report alongside the SEC, had previously downplayed that version of events but said it was looking into Nanex’s data. But Friday’s report explicitly contradicts Nanex’s take.

The Nanex explanation was last discussed on PrefBlog on August 17. The relevant section of the report, highlighted by FT Alphaville, is:

Some market participants and firms in the market data business have analyzed the CTS and CQS data delays of May 6, as well as the quoting patterns observed on a variety of other days. It has been hypothesized that these delays are due to a manipulative practice called “quote-stuffing” in which high volumes of quotes are purposely sent to exchanges in order to create data delays that would afford the firm sending these quotes a trading advantage.

Our investigation to date reveals that the largest and most erratic price moves observed on May 6 were caused by withdrawals of liquidity and the subsequent execution of trades at stub quotes. We have interviewed many of the participants who withdrew their liquidity, including those who were party to significant numbers of buys and sells that occurred at stub quote prices. As described throughout this report each market participant had many and varied reasons for its specific actions and decisions on May 6. For the subset of those liquidity providers who rely on CTS and CQS data for trading decisions or data- integrity checks, delays in those feeds would have influenced their actions. However, the evidence does not support the hypothesis that delays in the CTS and CQS feeds triggered or otherwise caused the extreme volatility in security prices observed that day.

Update: The report has some very cool graphs of market depth – some of the Accenture ones are:
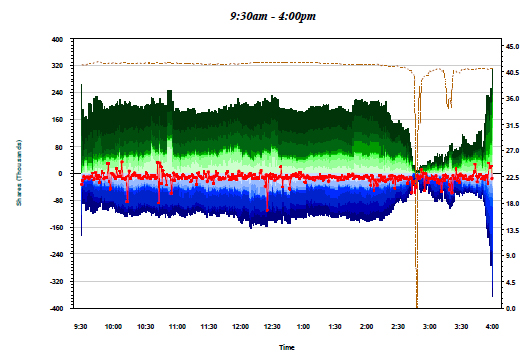

Accenture Order Book Depth – Day
Click for big
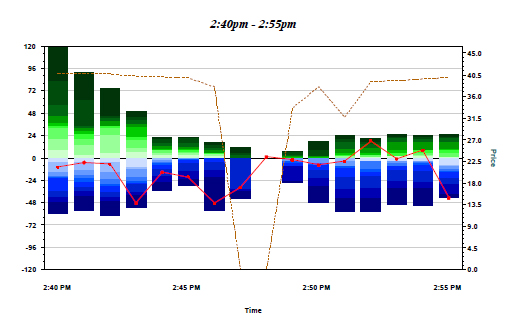

Accenture Order Book Depth – Close-up
Click for big


Legend
Click for big

Update, 2010-10-3: The report notes:

Some firms use multiple data sources as inputs to their data-integrity checks, and when those sources do not agree, a pause can be triggered. As discussed in Section 3, latency issues regarding a subset of pricing data on the consolidated market data feeds for NYSE-traded stocks triggered data-integrity checks in the systems of some firms. We refer to these as “feed-driven integrity pauses.”

Whenever data integrity was questioned for any reason, firms temporarily paused trading in either the offending security, or in a group of securities. As a firm paused its trading, any liquidity the firm may have been providing to the market became unavailable, and other firms that were still providing liquidity to the markets had to absorb continued order flow. To the extent that this led to more concentrated price pressure, additional rapid price moves would in turn trigger yet more price-driven integrity pauses.

Most market makers cited data integrity as a primary driver in their decision as to whether to provide liquidity at all, and if so, the manner (size and price) in which they would do so. On May 6, a number of market makers reported that rapid price moves in the E-Mini and individual securities triggered price-driven integrity pauses. Some, who also monitor the consolidated market data feeds, reported feed-driven integrity pauses. We note that even in instances where a market maker was not concerned (or even knowledgeable) about external issues related to feed latencies, or declarations of self-help, the very speed of price moves led some to question the accuracy of price information and, thus, to automatically withdraw liquidity. According to a number of market makers, their internal monitoring continuously triggered visual and audio alarms as multiple securities breached a variety of risk limits one after another.

For instance, market makers that track the prices of securities that are underlying components of an ETF are more likely to pause their trading if there are price-driven, or data feed-driven, integrity questions about those prices.37 Moreover, extreme volatility in component stocks makes it very difficult to accurately value an ETF in real-time. When this happens, market participants who would otherwise provide liquidity for such ETFs may widen their quotes or stop providing liquidity (in some cases by using stub quotes) until they can determine the reason for the rapid price movement or pricing irregularities.

This points to two potentially useful regulatory measures: imposing data-throughput minima on the exchanges providing data feeds; and the imposition of short trading halts (“circuit-breakers”) under certain conditions.

Update, 2015-4-22: The UK arrest of Navinder Singh Sarao has brought some interesting incompetence to light:

When Washington regulators did a five-month autopsy in 2010 of the plunge that briefly erased almost $1 trillion from U.S. stock prices, they didn’t consider individuals manipulating the market with fake orders because they used incomplete data.

Their analysis was upended Tuesday with the arrest of Navinder Singh Sarao — a U.K.-based trader accused by U.S. authorities of abusive algorithmic trading dating back to 2009. The episode shows fundamental cracks in the way some of the world’s most important markets are regulated, from the exchanges that get to police themselves to the government departments that complain they don’t have adequate resources to do their jobs.

It turns out regulators may have missed Sarao’s activity because they weren’t looking at the right data, according to former CFTC Chief Economist Andrei Kirilenko, who co-authored the report. He said in an interview that the CFTC and SEC based their study of the sorts of futures Sarao traded primarily on completed transactions, which wouldn’t include the thousands of allegedly deceitful orders that Sarao submitted and immediately canceled.

On the day of the flash crash, Sarao used “layering” and “spoofing” algorithms to enter orders for thousands of futures on the Standard & Poor’s 500 Index. The orders amounted to about $200 million worth of bets that the market would fall, a trade that represented between 20 percent and 29 percent of all sell orders at the time. The orders were then replaced or modified 19,000 times before being canceled in the afternoon. None were filled, according to the affidavit.

SEC Commissioner Michael Piwowar, speaking Wednesday at an event in Montreal, said there needs to be a full investigation into whether the SEC or CFTC botched the flash crash analysis.

“I fully expect Congress to be involved in this,” he said.

Senator Richard Shelby, the Alabama Republican who heads the banking committee, said in a statement Wednesday that he intends to look into questions raised by Sarao’s arrest.

Mark Wetjen, a CFTC commissioner speaking at the same event, echoed Piwowar’s concerns about regulators’ understanding of the events.

“Everyone needs to have a deeper, better understanding of interconnections of derivatives markets on one hand and whatever related market is at issue,” Wetjen said. “It doesn’t seem like that was really addressed or looked at in that report.”
Interesting External Papers

FRBB Looks at Dynamic Provisioning

The Federal Reserve Bank of Boston has released Working Paper No. QAU10-4 by José L. Fillat and Judit Montoriol-Garriga titled Addressing the pro-cyclicality of capital requirements with a dynamic loan loss provision system:

The pro-cyclical effect of bank capital requirements has attracted much attention in the post-crisis discussion of how to make the financial system more stable. This paper investigates and calibrates a dynamic provision as an instrument for addressing pro-cyclicality. The model for the dynamic provision is adopted from the Spanish banking regulatory system. We argue that, had U.S. banks set aside general provisions in positive states of the economy, they would have been in a better position to absorb their portfolios’ loan losses during the recent financial turmoil. The allowances accumulated by means of the hypothetical dynamic provision during the cyclical upswing would have reduced by half the amount of TARP funds required. However, the cyclical buffer for the aggregate U.S. banking system would have been depleted by the first quarter of 2009, which suggests that the proposed provisioning model for expected losses might not entirely solve situations as severe as the one experienced in recent years.

This is a useful, if not particularly earth-shattering, paper. If the banks had held more reserves prior to the crisis, they would have had more reserves during the crisis. So?

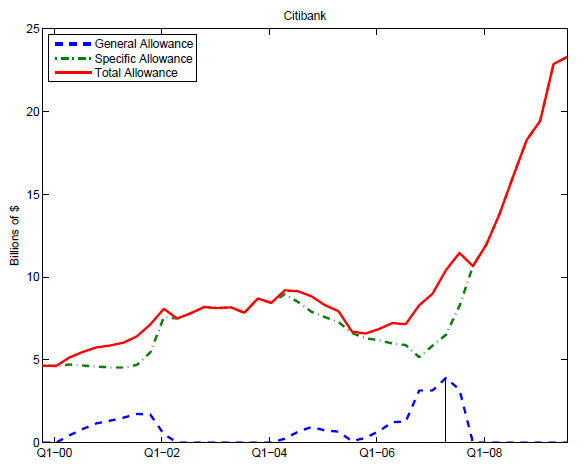
What I found interesting was the discussion of Citibank:

Figure 8, shows that Citibank would have depleted the newly created general allowance in the fourth quarter of 2007—much earlier than the rest of the institutions and earlier than the aggregate of the U.S. financial system. From that date on, Citibank would have been in the same situation as without the dynamic provision. That is, total provisions for loan losses would be equal to the specific allowance (ALLL) during the last 2 years, as observed. The results are driven by a relatively poor performance of the Citibank loan portfolio during the 2000 to 2005 period. During this period, the ratio of specific provisions to loans is above the banking system long-run average. Citibank would have started to build up the stock of reserves in 2006, too late to serve the purpose of attenuating the problems caused by increased loan losses in Citibank’s books with the recession.

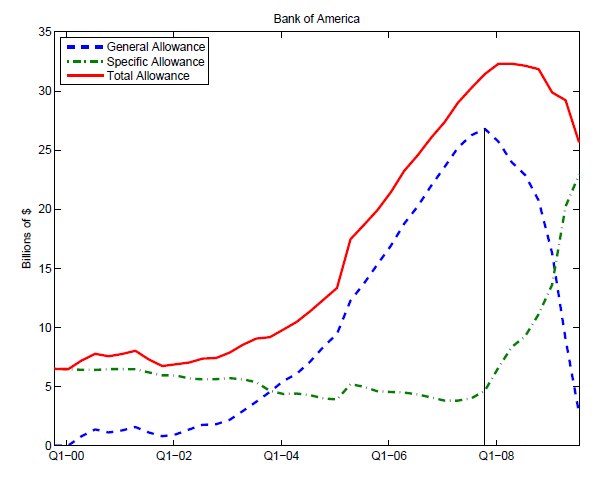
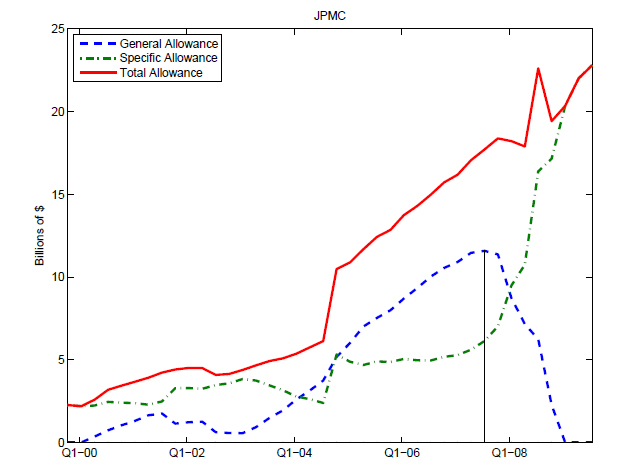
The figures below show the general allowance, the specific allowance and the total:

The dynamic provisioning system attempts to create an a-cyclical loan loss provision that reduces the chances of the amplification of an economic crisis through the banking sector. We follow the same approach and calibrate the parameters of the Spanish dynamic provision for the U.S. banking system using publicly available data. We show that if U.S. banks had funded provisions in expansion periods using this provisioning model, they would have been in a better position to absorb loan portfolio losses during the financial turmoil.


Click for Big


Click for Big


Click for Big

One thing that makes Dynamic Provisioning important is that it truly is a buffer. After all, if the minimum capital requirement is 4% and you have 5% … then your effective room isn’t really 5%, is it? If you fall below 4% the regulators will sieze your bank and either liquidate or sell it, so your room for mistakes is only 1%. This was the major problem during the crisis – not that capital would fall below 0% – insolvency – but that it would fall below 4% – regulatory siezure.

One thing I would like to see addressed in future papers on this topic is an analysis of how JPM and BAC would have reacted to the dynamic provisioning requirements estimated here. After all, the proposed rules are not truly countercyclical unless they actually reduce lending during boom times.

Interesting External Papers

Bail-Outs and Financial Fragility

The Federal Reserve Bank of New York has released a staff report by Todd Keister titled Bailouts and Financial Fragility:

How does the belief that policymakers will bail out investors in the event of a crisis affect the allocation of resources and the stability of the financial system? I study this question in a model of financial intermediation with limited commitment. When a crisis occurs, the efficient policy response is to use public resources to augment the private consumption of those investors facing losses. The anticipation of such a “bailout” distorts ex ante incentives, leading intermediaries to choose arrangements with excessive illiquidity and thereby increasing financial fragility. Prohibiting bailouts is not necessarily desirable, however: it induces intermediaries to become too liquid from a social point of view and may, in addition, leave the economy more susceptible to a crisis. A policy of taxing short-term liabilities, in contrast, can correct the incentive problem while improving financial stability.

I can’t help but think that the author – and perhaps the entire Fed and US political establishment – has lost his way a little:

The optimal response to this situation is to decrease public consumption and transfer resources to these investors – a “bailout.” The efficient bailout policy thus provides investors with (partial) insurance against the losses associated with a financial crisis.

In a decentralized setting, the anticipation of this type of bailout distorts the ex ante incentives of investors and their intermediaries. As a result, intermediaries choose to perform more maturity transformation, and hence become more illiquid, than in the benchmark allocation. This excessive illiquidity, in turn, implies that the financial system is more fragile in the sense that a self-fulfilling run can occur in equilibrium for a strictly larger set of parameter values. The incentive problem created by the anticipated bailout thus has two negative effects in this environment: it both distorts the allocation of resources in normal times and increases the financial system’s susceptibility to a crisis.

A policy of committing to no bailouts is not necessarily desirable, however. Such a policy would require intermediaries to completely self-insure against the possibility of a crisis, which would lead them to become more liquid (by performing less maturity transformation) than in the benchmark efficient allocation.

I am disturbed that the above does not distinguish between a bail-out (which would apply to insolvent institutions) and use of the discount window (which applies to illiquid institutions). It is becoming apparent that the Panic of 2007 was more of a liquidity crisis than a solvency crisis; but questions of solvency were exacerbated by regulatory requirements that minimum capital be kept on hand at all times (as has been said before, on at least one occasion by Willem Buiter, having a fixed capital requirement doesn’t really help in a crisis, because breaching that barrier means you’re bust, no matter what that fixed requirement might have been).

An optimal policy arrangement in the environment studied here requires permitting bailouts to occur, so that investors benefit from the efficient level of insurance, while offsetting the negative effects on ex ante incentives. One way this can be accomplished is by placing a Pigouvian tax on intermediaries’ short-term liabilities, which can also be interpreted as a tax on the activity of maturity transformation. In the simple environment studied here, the appropriate choice of tax rate will implement the benchmark efficient allocation and will decrease the scope for financial fragility relative to either the discretionary or the no-bailouts regime.

I would say that another way of accomplishing the same thing (albeit ex-post rather than ex-ante) would be to ensure that draws from the discount window are done at a penalty rate; but the opposite tack was taken during the crisis by providing the banks with sovereign guarantees for their debt.

Interesting External Papers

Carney, Haldane, Swaps

Let’s say you sit on the Public Services Board of a seaside town; one of the things your board does is hire lifeguards for the beach.

One day, a vacationer drowns. You do what you can for the family and then haul the lifeguard on duty up in front of a committee to see why someone drowned on his watch.

“Not my fault!” the lifeguard tells you “He didn’t know how to swim very well and he went into treacherous waters.”

So what do you do? Chances are that you scream at the little twerp “Of course he went into treacherous waters without knowing how to swim well, you moron. That’s what vacationers do! That’s precisely why we hired you!”

Reasonable enough, eh? You’d fire the lifeguard if that was his best answer.

So why are we so indulgent with bank regulators? The banks were stupid. Of COURSE the damn banks were stupid. That’s what banks are best at, for Pete’s sake! We KNOW that. If they weren’t stupid, we wouldn’t need regulators, would we?

Which is all a way of saying how entertaining I find the bureaucratic scapegoating of banks in the aftermath of the crisis.

In my post reporting Carney’s last speech, I highlighted his reference to a speech by Haldane:

These exposures were compounded by the rapid expansion of banks into over-the-counter derivative products. In essence, banks wrote a series of large out-of-the-money options in markets such as those for credit default swaps. As credit standards deteriorated, the tail risks embedded in these strategies became fatter. With pricing and risk management lagging reality, there was a widespread misallocation of capital.

footnote: See A. Haldane, ―The Contribution of the Financial Sector—Miracle or Mirage?‖ Speech delivered at the Future of Finance Conference, London, 14 July 2010.

An interesting viewpoint, since writing a CDS is the same thing as buying a bond, but without the funding risk. I’ll have to check out that reference sometime.

I have now read Haldane’s speech, titled The contribution of the financial sector – miracle or mirage?, and it seems that what Haldane says is a bit of stretch … and the interpretation by Carney is a bit more of a stretch.

Haldane’s thesis is

Essentially, high returns to finance may have been driven by banks assuming higher risk. Banks’ profits, like their contribution to GDP, may have been flattered by the mis-measurement of risk.

The crisis has subsequently exposed the extent of this increased risk-taking by banks. In particular, three (often related) balance sheet strategies for boosting risks and returns to banking were dominant in the run-up to crisis:

  • increased leverage, on and off-balance sheet;
  • increased share of assets held at fair value; and
  • writing deep out-of-the-money options.

What each of these strategies had in common was that they generated a rise in balance sheet risk, as well as return. As importantly, this increase in risk was to some extent hidden by the opacity of accounting disclosures or the complexity of the products involved. This resulted in a divergence between reported and risk-adjusted returns. In other words, while reported ROEs rose, risk-adjusted ROEs did not (Haldane (2009)).

I don’t have any huge problems with his section on leverage. The second section makes the point:

Among the major global banks, the share of loans to customers in total assets fell from around 35% in 2000 to 29% by 2007 (Chart 29). Over the same period, trading book asset shares almost doubled from 20% to almost 40%. These large trading books were associated with high leverage among the world’s largest banks (Chart 30). What explains this shift in portfolio shares? Regulatory arbitrage appears to have been a significant factor. Trading book assets tended to attract risk weights appropriate for dealing with market but not credit risk. This meant it was capital-efficient for banks to bundle loans into tradable structured credit products for onward sale. Indeed, by securitising assets in this way, it was hypothetically possible for two banks to swap their underlying claims but for both firms to claim capital relief. The system as a whole would then be left holding less capital, even though its underlying exposures were identical. When the crisis came, tellingly losses on structured products were substantial (Chart 31).

… which is all entirely reasonable and is a failure of regulation, not that you’ll see anybody get fired for it.

The third section mentions Credit Default Swaps:

A third strategy, which boosted returns by silently assuming risk, arises from offering tail risk insurance. Banks can in a variety of ways assume tail risk on particular instruments – for example, by investing in high-default loan portfolios, the senior tranches of structured products or writing insurance through credit default swap (CDS) contracts. In each of these cases, the investor earns an above-normal yield or premium from assuming the risk. For as long as the risk does not materialise, returns can look riskless – a case of apparent “alpha”. Until, that is, tail risk manifests itself, at which point losses can be very large. There are many examples of banks pursuing essentially these strategies in the run-up to crisis. For example, investing in senior tranches of sub-prime loan securitisations is, in effect, equivalent to writing deep-out-of-the-money options, with high returns except in those tail states of the world when borrowers default en masse. It is unsurprising that issuance of asset-backed securities, including sub-prime RMBS (residential mortgage-backed securities), grew dramatically during the course of this century, easily outpacing Moore’s Law (the benchmark for the growth in computing power since the invention of the transistor) (Chart 32).

A similar risk-taking strategy was the writing of explicit insurance contracts against such tail risks, for example through CDS. These too grew very rapidly ahead of crisis (Chart 34). Again, the writers of these insurance contracts gathered a steady source of premium income during the good times – apparently “excess returns”. But this was typically more than offset by losses once bad states materialised. This, famously, was the strategy pursued by some of the monoline insurers and by AIG. For example, AIG’s capital market business, which included its ill-fated financial products division, reported total operating income of $2.3 billion in the run-up to crisis from 2003 to 2006, but reported operating losses of around $40 billion in 2008 alone.

I have a big problem with the concept of CDSs as options. Writing a Credit Default Swap is, essentially, the same thing as buying a corporate bond on margin. If the CDS is cash-covered, the risk profile is very similar to a corporate bond, differing only in some special cases that did not have a huge impact on the crisis.

You can, if you squint, call it an option, but only to the extent that any loan has an implicit option for the borrower not to repay the debt. If you misprice that option – more usually referred to as default risk – sure, you will eventually lose money.

But AIG’s big problem was not that it wrote CDSs, it was that it wrote far too many of them; it was effective leverage that was the big problem. And the potential for contagion if AIG fell was not so much the fault of the manner in which the deals were structured as it was the fault of the banks for not insisting on collateral, and the fault of the regulators for not addressing the problem with uncollateralized loans.

So Haldane’s thir point is more than just a little shaky, and Carney’s use of this to state that derivative use by banks was a contributing factor to the Panic of 2007 is shakier.