A potential investor in MAPF writes in and says:
I wonder if you could answer a few questions for me.
I should start by saying that I am far from being an accountant. I would have my accountant offer an opinion if I decide to proceed, but in the meantime I apologize if any my questions are simplistic. Clearly being an accredited investor does not make one an investment professional.
On p. 2 of your 2008 statements (Statement of Operations) you show net investment income for the year as 58 989 as well as transaction costs of 45 617 and net realized losses of 58 725.
On p.3 (Changes in Net Assets) you show distiributions to unitholders of 58 989, i.e. all of the net investment income.
On p. 7 of the statement under “Unitholder’s Equity” you show “distributions in excess of income” of 104 342, which is the sum of transaction costs and net realized losses on p. 2.
Am I therefore correct that the net investment income from your fund exceeded the transactions costs by 13 372? Although unitholders would have received a larger distribution, the NAV of the fund would have decreased to reflect the transaction costs. (The NAV would have also decreased to reflect the capital losses, of course, but that is to be expected whether realized or not.) If I am correct, then a significant proportion (77% in this year) of the net investment income from your fund is “consumed” by transaction costs and 79% of the dividends are “consumed” by costs (after the costs you absorb). An investor would be largely relying on capital appreciation (i.e. increased NAV) to realize a return. Am I correct in understanding your investment strategy?
I also notice that transaction costs do not appear until 2007 on your financial statements. Why is this?
Finally, for the returns posted on your website, are those returns before or after transaction costs and other expenses (eg. audit)? I understand that they do not include management fees.
The question refers to Malachite Aggressive Preferred Fund (MAPF); further information regarding the fund can be found on the fund’s main page. Past performance is not a guarantee of future returns. You can lose money investing in MAPF or any other fund.
You are entirely correct in your analysis that transaction costs were large in 2008 compared to investment income, but there is no direct relationship between the two figures.
If, for instance, the fund was being run as a passive index fund, transaction costs would have been negligible but, to a first approximation, investment income would have been unaffected. However, the fund is run in accordance with the principles discussed in my statement of Investment Philosophy.
Markets can move around significantly in the absence of a “real” change in the valuation of a security, as incoming orders are filled. To achieve superior long term gains on an investment portfolio, the key is to sell when others are buying and to buy when others are selling. To this end, Hymas Investment Management focuses its research efforts on the analysis of a market price into it’s “fair” and “liquidity” components, to achieve superior investment returns by “selling” liquidity to the market, taking advantage of mispricing while at all times keeping the client’s tax and commission considerations in view.
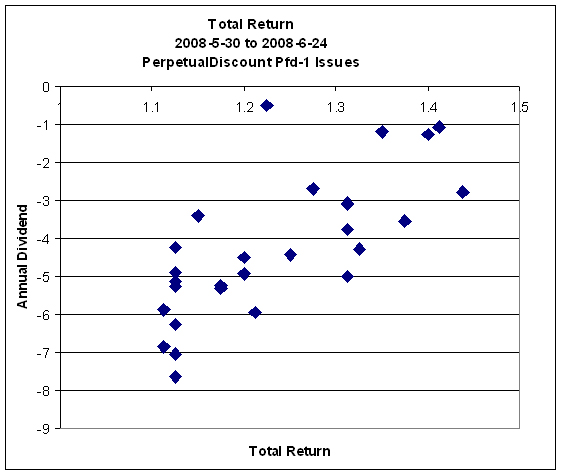
In a year like 2008, when there were repeated waves of panic selling and euphoric buying (more of the former than the latter!) there were many opportunities to swap very similar instruments at very dissimilar prices. The statement of transactions for 2008 shows a huge number of trades which, alas, achieved a cumulative loss of just over $104,000 (including transaction costs).
However, this trading was highly profitable, although it was not enough to outweigh the effect of a rotten year in the market.
You will observe from the statement of annualized returns that the fund returned -3.85% (after expenses but before fees) compared to an index return of -16.42%.
If the fund had been run as an index fund, it is fair to assume – as an approximation for illustrative purposes – that its return for the year would be about -16.85% (the index return less an allowance of 43bp for fees), but in fact it lost much less.
We may conclude that the fund’s trading had a positive impact on the fund’s return of +13.00% (actual return of -3.85% less the notional return of -16.85%) and that this positive impact is net of the costs of performing the transactions.
If we take a simple average of the fund’s beginning and ending NAV, then we find that this 15% net impact of trading was worth, in dollar figures, about $117,000. Transaction costs, as you note, were about $46,000 so the following arithmetic is reasonably valid:
MAPF
2008 Approximate Trading Impact |
Gross transaction profit
Relative to Benchmark |
$163,000 |
| Cost of transactions |
(46,000) |
| Net transaction profit |
$117,000 |
The words “Relative to Benchmark” should be carefully noted when examining the above table! The benchmark was so horribly negative that all the trading was able to accomplish was a reduction of the realized and unrealized capital loss that would otherwise have been experienced.
Thus – and again making an approximation – about one-quarter of the gross transaction profit was eaten up by commission. Or to put it another way, I saw repeated opportunities through the year to buy a dollar for twenty-five cents.
Note, however, that it isn’t quite as straightforward as that! Some of those twenty-five cent trades made two dollars, not just one … others lost money on top of transaction charges! All I can do is identify anomalies that “should” make some money and leave the rest up to statistics. The success of the fund will depend on my ability to identify potentially profitable trades accurately – and the results since inception show that I have been quite successful identifying these anomalies in the past.
The draft financials for 2009 – the auditor has not yet signed off on the statements – have a much nicer look to them, since in 2009 I was not trying to swim up a waterfall:
MAPF
Extract from Unaudited
Statement of Operations |
| Net realized gains, 2009 |
479,095 |
| Net change in unrealized gains, 2009 |
75,229 |
| Transaction costs |
(17,862) |
The decline in transaction costs is largely due to a change in brokers that took place in late 2008.
So, your first major question, a significant proportion (77% in this year) of the net investment income from your fund is “consumed” by transaction costs and 79% of the dividends are “consumed” by costs (after the costs you absorb). An investor would be largely relying on capital appreciation (i.e. increased NAV) to realize a return. Am I correct in understanding your investment strategy? implicitly assumes that transaction costs should be applied against dividends. I consider it much more reasonable for analytical purposes to apply them against (hopefully excess) capital gains.
In answer to your second question: transaction costs do not appear on the pre-2007 financials because they were not required by the accounting rules of the time. Rules have changed and they are now required to be broken out instead of “buried” in the statement of capital gains and losses. If you want to see the transaction costs, I report them in the Transaction Statements for each half- and full-year, which are available on the fund’s main page.
With respect to your third question: all the returns reported are after everything except fees.
Update: My interlocuter responds, in part:
I understand your argument and it makes sense. At the end of the day, there is only really a total return which consists of distributions plus capital appreciation of the units. What you are saying is that the transaction costs (and audit and management costs, for that matter) should be judged by the extent to which they increase (or mitigate a decrease) in the value of the portfolio compared to a passive alternative, and on that score your fund was successful even after management fees.
It still seems to me, though, that the trading costs are a significant percentage of the dividend component of the return. That implies that your trading costs must be offset by either (1) an increase in the NAV of the fund compared to a passive index or (2) a richer long-term dividend stream compared to not making a trade if the market “fails to realize” the mispricing of the preferreds that you have bought. In a nutshell, the return of the fund is highly dependent on your continued success as a
trader. If your trading is simply neutral with regard to these factors, then the costs (trading, audit and management) will consume a significant element of the return compared to a passive alternative. Clearly, you have had some success in this regard, but it implies to me a high degree of model risk. If your model were to fail then the dividends would not bail an investor out as an alternative source of returns. I contrast this to either a passive model or an active model where the trading costs are a lower percentage of the dividend stream; or even the segregated accounts you offer.
None of this is intended as criticism. I’m just trying to understand the nature of the fund, its risks and its strategy. Do you think these are fair comments?
These are indeed fair comments.
Clearly, you have had some success in this regard, but it implies to me a high degree of model risk. Yes, this is correct. All I can say is that the model is constantly being evaluated and is based on the fundamentals of fixed income investing. I cannot conceive of any circumstance in which liquidity ceases to have any value in any marketplace – there are liqudity premia on US Treasuries, the most liquid market in the world – so it’s just a matter of finding it.
While liquidity premia can rise and fall relative to other components of price and markets can change, all I can say is that throughout my career I have been able to deliver returns to clients that have been significantly above benchmark – even when running $1.7-billion in Canadian goverment bonds – and continue to work at understanding the changing markets so that I may continue to do so.
I contrast this to either a passive model or an active model where the trading costs are a lower percentage of the dividend stream;
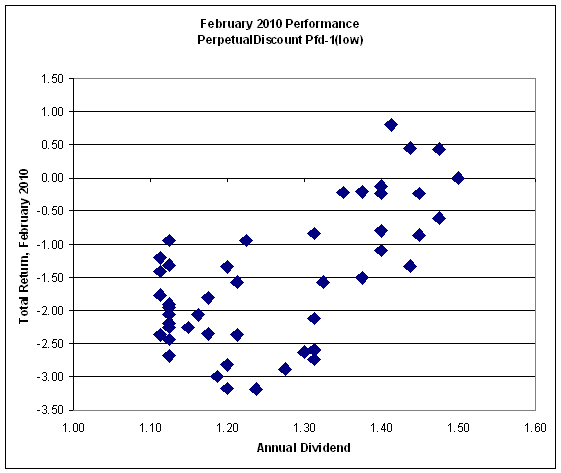
You must realize that passive models are not immune to liquidity costs. For example, moronic trading in POW.PR.C triggered by index rebalancing, was a large factor in CPD’s large tracking error in January 2010. Commissions are only one part of trading costs!
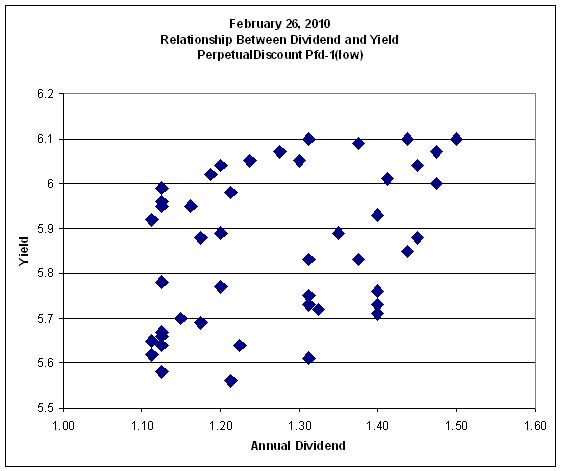
I will also note that you are still comparing trading costs to the dividend stream. It should be noted that these are not constant costs – if I don’t see opportunities, I don’t trade. For example, portfolio turnover in January 2010 was a mere 40%, compared to nearly 170% in November 2008 when the market collapsed.
Additionally, if you compare the 1H09 Transaction Report (particularly towards the end of the period) to the 2008 Transaction Report, you will see that unit trading costs have declined dramatically. This is also apparent in the extract from the unaudited 2009 Financial Statements, above, which shows commission costs for the whole of 2009 declining to $17,862 from approximately $46,000 in 2008.
I contrast this to either a passive model or an active model where the trading costs are a lower percentage of the dividend stream; or even the segregated accounts you offer.
I wouldn’t take a segregated account mandate that included a directive to minimize trading costs; I would be unable to add much – if any! – value net of very, very tiny fees. My product for ‘long-term buy-and-hold investors’ is PrefLetter; after setting up a portfolio, such investors can compare what they hold with the monthly recommendations and decide for themselves whether the investment characteristics of what’s available are sufficiently superior to what they hold to justify a trade. This approach could be combined with periodic consultations.