Archive for February, 2009

SunLife 4Q08 Results

Thursday, February 12th, 2009

Assiduous Readers will remember that OSFI made a late Christmas Eve announcement of major changes to the MCCSR guidelines, which included:

Revised methodologies for calculating available capital. The key change recognizes that unrealized gains and losses on available for sale (AFS) debt securities held by life insurance companies do not reflect the capital value of these assets to a life insurer as, in most cases, these assets will be held for the long term (e.g. to maturity). As such, OSFI is updating its life insurance company capital rules so that, when fully implemented, they will correspond to the capital treatment for banks holding similar securities (i.e. unrealized gains and losses on AFS debt securities do not change capital adequacy).

As noted yesterday, this issue has come to the fore in the UK, with companies being sternly warned to ensure that when determining the profit and loss on their annuity business, increased spreads lead to at least a certain amount of increase in the implied default risk of the assets.

In fact, OSFI’s new Capital Guidelines state:

OSFI will begin phasing out the capital adjustments for accumulated unrealized gains and losses on available-for-sale debt securities reported in Other Comprehensive Income (OCI) on December 31, 20086. At year-end 2008, companies must elect whether to phase out these adjustments over three years, or to phase them out immediately.

All this is of interest due to the following information in SunLife’s 4Q08 Earnings Release:

Net income of $129 million for the fourth quarter of 2008 was driven by an after-tax gain of $825 million from the Company’s sale of its interest in CI Financial. This was offset by a significant decline in equity markets, asset impairments, credit-related write-downs and spread widening, changes to asset default assumptions in anticipation of higher future credit-related losses, charges taken in the Company’s life retrocession reinsurance business related to the strengthening of actuarial reserves to reflect more comprehensive information on potential future premiums and claims as well as the weakening of the Canadian dollar relative to foreign currencies from losses in business segments in which the U.S. dollar is the primary currency. The Company’s hedging program helped offset some of the losses related to volatility in capital markets during the quarter.

Credit market losses include the following amounts:

Sunlife 4Q08
Reported
Credit Market
Losses (CAD-million)
Write-downs & realized losses 155
Downgrades 55
Spread widening 155
Strengthening of Reserves for Asset Default Assumptions 164
Total 529

With an MCCSR ratio of 232% Sun Life Assurance was well above minimum regulatory capital levels as at December 31, 2008, compared to 213% as at December 31, 2007. The increase in the MCCSR ratio is primarily due to revisions by OSFI to the MCCSR rules in the fourth quarter of 2008, as well as the impact of the portion of the proceeds of the CI Financial transaction attributable to Sun Life Assurance. This was partially offset by market impacts experienced during 2008 and write-downs on assets in Sun Life Assurance’s investment portfolio. Other subsidiaries are subject to local capital requirements in the jurisdictions in which they operate.

The current market environment highlighted the need to revise the treatment of certain components of capital to better reflect both the nature of the risks and the quality of capital supporting these risks. In response to the issues surfaced, OSFI issued several revisions to the current MCCSR rules effective December 2008. First, the minimum capital rules for segregated fund guarantees were updated to differentiate between near-term and long-term obligations. Second, companies were given the option to exclude from available capital the net after-tax unrealized gains and losses on available-for-sale bonds reflected in other comprehensive income to better reflect the long-term nature of these bonds. Finally, the requirement to hold capital for future pricing decisions was eliminated to avoid potential redundancy with risk charges and actuarial reserves.

The Company’s principal operating subsidiary, Sun Life Assurance, is subject to the MCCSR capital rules for a life insurance company in Canada. The MCCSR calculation involves using qualifying models or applying quantitative factors to specific assets and liabilities based on a number of risk components to arrive at required capital and comparing this requirement to available capital to assess capital adequacy. Certain of these risk components, along with available capital, are sensitive to changes in equity markets. The estimated impact on the MCCSR of Sun Life Assurance from an immediate 10% increase across all equity markets as at December 31, 2008 would be an approximate 2% – 4% increase in MCCSR. Conversely, the estimated impact on the MCCSR of Sun Life Assurance from an immediate 10% drop across all equity markets would be an approximate 3% – 5% decrease in MCCSR.

The MCCSR is a very nice number, insofar as it can be trusted. Unfortunately, there is not enough detail in their Supplementary Information (available here) to make a determination of how well their credit impairment assumptions correspond to their liability net present value assumptions.
UK FSA Publishes 2009 Financial Risk Outlook

Wednesday, February 11th, 2009

The Financial Services Authority has released its Financial Risk Outlook 2009 report, a very good review of the current situation, its causes and possible effects.

I will note in passing that it’s hard to learn about these releases! The FSA restricts its eMail notifications to journalists, citing “high demand”. I don’t understand! I spend seven hours per day deleting eMail offering me many interesting pills, and the FSA can’t send me an eMail that I’ve specifically requested? This makes no sense.

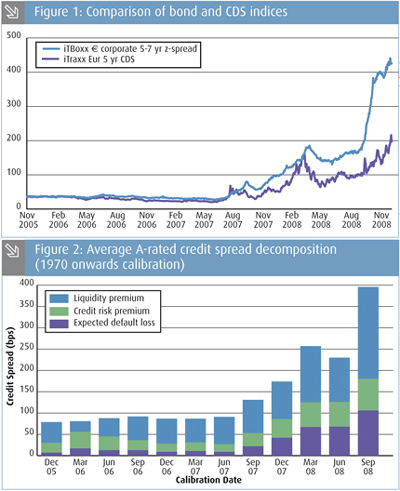
One highly interesting and topical subject is the decomposition of corporate bond yields, which have been discussed many times on PrefBlog – for instance, in the post announcing BoE Releases October 2008 Financial Stability Report. According to the Financial Times:

Fears are mounting over possible dividend cuts by life assurers, after a demand from the Financial Services Authority that they hold enough capital to survive fresh market shocks.

Life assurers are being told to test whether they would have a capital buffer after what is in effect a 60 per cent reduction in equity markets from current levels, as well as a significant increase in bond defaults, according to people who are aware of the project.

In the latest tests – regarded as more extreme than the December exercise – the FSA has told companies to test whether they would have a capital buffer in the event of a 1980s-style sharp and deep recession, according to people familiar with the plans.

This includes a 20 per cent reduction in equity markets from current levels, followed by another 39 per cent decline, which would take the FTSE 100 index to around the 2,000 level.

It is also asking companies to test whether they would have a capital buffer after a further significant increase in the returns that investors demand for holding bonds that are more risky than gilts and a significant decline in property prices.

The tests represent yet another change in approach by the FSA, which has alternated between pragmatism and strict solvency demands.

“Its like dealing with the police if they kept changing the crime laws,” added the executive.

Tergiversations by regulators are nothing new … but then, neither are flip-flops by the Financial Times, as noted in a very informative article published by The Actuary:

In October 2008, the Financial Times opined that “life assurers should not be using rising yields on corporate bonds to reduce estimates of their future liabilities. The higher yields… represent a higher risk of default and added potential costs”. However, a later article suggested that “the markets are utterly divorced from fundamental value or risks of defaults”.

The Actuary article provides a review of the Liquidity Premium from an investment standpoint:

The spread on corporate bonds over the liquid risk-free rate (for example, government bonds) represents compensation for several different factors:

A Expected default losses
B Unexpected default risk, such as default and recovery rate risk
C Mark-to-market risk, such as the risk of a fall in the market price of the bond
D Liquidity risk, such as the risk of not finding a ready buyer at the theoretical market price.

Investors concerned with the realisable value of their investment in the short-term require compensation for all these risks.

However, investors who can hold bonds to maturity need compensation only for A and B. Such investors can enjoy the premiums for C and D, and we refer to these collectively as a ‘liquidity premium’.

The traditional method for credit deductions only allowed directly for expected default losses, albeit measured on a prudent basis. The Financial Services Authority (FSA), in its September 2008 Insurance Sector Briefing, observed that insurers should allow for both expected losses and the risk of unexpected losses, although they have since deferred any recommendations until 2009.

… while pointing out the dangers of blind adherence to classical structural models:

These models are not without their issues. For example, in the Bank of England model, the residual premium on Sterling investment grade bonds fell from 155bps at 30 September 2008 to a negative premium of -9bps on 10 October, before rising to 118bps by the end of October. This is due to the use of equity market volatility to quantify credit default risk — on 10 October equity markets fell 10% with corresponding spikes in volatility, while credit markets were largely unaffected.

Nevertheless, structural models provide a valuable new tool for actuaries to quantify liquidity premiums, and also strong evidence of their existence.

The FSA does not go out of its way to talk tough on this issue, but does note:

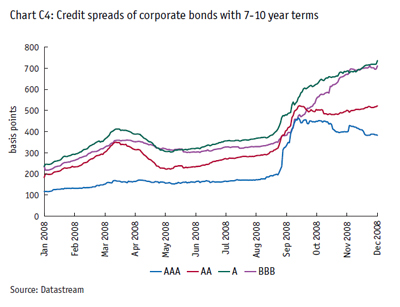
As most life insurers hold corporate bonds to back various classes of business, analysis of market developments should be a key consideration for them in determining the discount rate used to value long-term liabilities. In setting this discount rate, most insurers make an assessment of the extent to which bond spreads can be explained by liquidity premiums, rather than the probability of default. Bond spreads have widened significantly, particularly in the third quarter of 2008, and whether insurers attribute this to an increase in the liquidity premium or an increase in credit default risk affects the value of their liabilities. Moreover, asset values will themselves be affected by the increased risk of corporate bond defaults. It is therefore critical that insurers holding corporate bond portfolios properly review underlying credit developments, in order to understand the state of their balance sheets and their capital positions.

Some insurers may have experienced difficulty with the valuation of their assets and, in particular, corporate bonds, because of the considerable reduction in market activity in many asset classes.

and provides a picture:

The FSA returns to this issue when discussing annuities:

Insurers operating predominantly or exclusively in annuity business are exposed to a concentration of longevity and credit risk. Market conditions have added to the impact of these risks, increasing the risk profile of this part of the sector. The risks arising from widening corporate bond spreads (as outlined above) are a particular issue for annuity business, in which long-term assets such as corporate bonds are used to match long-term liabilities (such as annuities in payment).

and included an exhortation to be prudent when decomposing the spreads in their “key messages to insurers”.

Also of interest was the FSA’s distinction between the much reviled “originate and distribute” model and the more precise “acquire and arbitrage” practice:

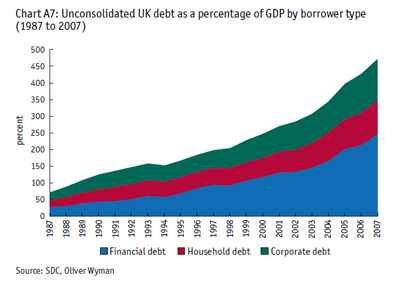
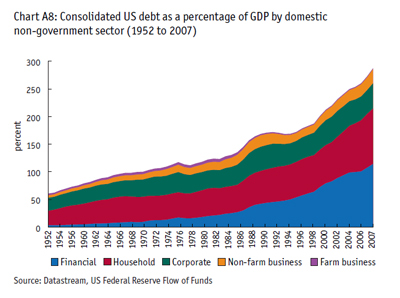
The need to support the growing levels of property and mortgage lending led to the increasing scale and size of securitised markets, and their mounting complexity were accompanied by a significant escalation in the leverage of banks, investment banks and off balance-sheet vehicles, and the growing role of hedge funds. (Chart A5 and A6) Large positions in securitised credit and related derivatives were increasingly held by banks, near banks, and shadow banks, rather than passed through to traditional hold-to-maturity investors.

Hence, the new model of securitised credit intermediation was not solely or indeed primarily one of originate and distribute. Rather, credit intermediation passed through multiple trading books in banks, leading to a proliferation of relationships within the financial sector. This ‘acquire and arbitrage’ model resulted in the majority of incurred losses falling on banks and investment banks involved in risky maturity transformation activities, rather than investors outside the banking system. This explosion of claims within the financial system resulted in financial sector balance sheets becoming of greater consequence to the economy.

February 11, 2009

Wednesday, February 11th, 2009

Enrico Perotti & Javier Suarez write a piece on VoxEU, Liquidity Insurance for Systemic Crises, proposing:

to establish a mandatory liquidity charge, to be paid continuously to a regulator who is able to provide emergency liquidity (and perhaps capital) during systemic crisis. The charge should be increasing in the maturity mismatch of assets and liabilities, and would be applicable to all institutions with access to safety net guarantees. Its effect should be to make short and medium term (up to one year) bank funding comparable in cost. Retail deposits would be exempted, as they are more stable thanks to their own separate insurance.

Revenues would go into an Emergency Liquidity Insurance Fund (ELIF), with legal autonomy and pre-packaged access to central bank liquidity and government funds backing. Upon significant aggregate liquidity runs (not concerning single banks), the payment of insurance would be triggered by the relevant supervisor, resulting in immediate liquidity support, guarantees on uninsured wholesale funding, and some automatic capital injections. Specific conditions may be attached, such as restrictions on compensation and dividends, as well as on some strategic choices.

The insurance charges could be thought of as prepayment for future rescue costs.

Restrictions on compensation have certainly become fashionable!

I don’t want to dismiss the idea out of hand; I will certainly agree that the next Basel Accord should address the degree of maturity transformation in some way. But:

  • Liquidity crunches are black swan events. Any level of insurance premium will be a guess.
  • It is the job of the central bank to address liquidity crunches, by making funds available against good collateral at a punitive rate of interest. A liquidity crunch, per se, is profitable for the central bank

From Across the Curve via PrefBlog’s Liquidity is Valuable Department comes another reminder:

One unintended consequence of the Fed [Agency] purchases is that the purchases have been concentrated in the large liquid issues. That has led to a substantial gulf between that paper and some smaller older illiquid paper. The illiquid securities now trading as much as 50 basis points cheap to the more liquid stuff.

PerpetualDiscounts eked out a small gain today to close with a pre-tax bid-YTW of 6.95%, equivalent to 9.73% interest at the standard conversion factor of 1.4x. Long corporates continue to yield 7.6%, so the spread remains fairly constant at 213bp. A fairly unexciting day, with volumes continuing normal, with pockets of frantic activity from recent Fixed-Reset issues.

However, today’s excitement was the downgrade of the BCE Prefs, which had no real effect on prices, but does mean that the HIMIPref™ Ratchet and Fixed-Floater sub-indices are about to disappear.

HIMIPref™ Preferred Indices
These values reflect the December 2008 revision of the HIMIPref™ Indices

Values are provisional and are finalized monthly
Index Mean
Current
Yield
(at bid)
Median
YTW
Median
Average
Trading
Value
Median
Mod Dur
(YTW)
Issues Day’s Perf. Index Value
Ratchet 5.29 % 3.76 % 24,240 17.83 2 -0.1524 % 861.7
FixedFloater 7.23 % 6.86 % 65,562 14.10 7 0.9867 % 1,388.3
Floater 5.21 % 4.29 % 29,507 16.83 4 1.6133 % 1,008.2
OpRet 5.24 % 4.77 % 146,337 4.00 15 0.3090 % 2,051.1
SplitShare 6.23 % 9.24 % 68,453 4.06 15 -0.0343 % 1,788.3
Interest-Bearing 7.13 % 8.77 % 32,590 0.85 2 -0.5787 % 1,983.9
Perpetual-Premium 0.00 % 0.00 % 0 0.00 0 0.0768 % 1,565.3
Perpetual-Discount 6.87 % 6.95 % 200,117 12.62 71 0.0768 % 1,441.6
FixedReset 6.08 % 5.73 % 626,979 13.94 27 0.0918 % 1,811.0
Performance Highlights
Issue Index Change Notes
DFN.PR.A SplitShare -1.71 % Asset coverage of 1.6-:1 as of January 30 according to the company.
YTW SCENARIO
Maturity Type : Hard Maturity
Maturity Date : 2014-12-01
Maturity Price : 10.00
Evaluated at bid price : 8.60
Bid-YTW : 8.45 %
MFC.PR.C Perpetual-Discount -1.68 % YTW SCENARIO
Maturity Type : Limit Maturity
Maturity Date : 2039-02-11
Maturity Price : 16.95
Evaluated at bid price : 16.95
Bid-YTW : 6.77 %
NA.PR.K Perpetual-Discount -1.63 % YTW SCENARIO
Maturity Type : Limit Maturity
Maturity Date : 2039-02-11
Maturity Price : 20.56
Evaluated at bid price : 20.56
Bid-YTW : 7.17 %
BCE.PR.Z FixedFloater -1.56 % YTW SCENARIO
Maturity Type : Limit Maturity
Maturity Date : 2039-02-11
Maturity Price : 25.00
Evaluated at bid price : 15.74
Bid-YTW : 6.80 %
GWO.PR.H Perpetual-Discount -1.24 % YTW SCENARIO
Maturity Type : Limit Maturity
Maturity Date : 2039-02-11
Maturity Price : 16.66
Evaluated at bid price : 16.66
Bid-YTW : 7.42 %
FIG.PR.A Interest-Bearing -1.21 % Asset coverage of 1.1-:1 as of February 10, based on Capital units at $1.29 and 0.53 Capital Units per preferred.
YTW SCENARIO
Maturity Type : Hard Maturity
Maturity Date : 2014-12-31
Maturity Price : 10.00
Evaluated at bid price : 7.36
Bid-YTW : 13.11 %
LFE.PR.A SplitShare -1.19 % Asset coverage of 1.3+:1 as of January 30 according to the company.
YTW SCENARIO
Maturity Type : Hard Maturity
Maturity Date : 2012-12-01
Maturity Price : 10.00
Evaluated at bid price : 9.10
Bid-YTW : 8.15 %
HSB.PR.D Perpetual-Discount -1.07 % YTW SCENARIO
Maturity Type : Limit Maturity
Maturity Date : 2039-02-11
Maturity Price : 17.56
Evaluated at bid price : 17.56
Bid-YTW : 7.25 %
TD.PR.R Perpetual-Discount -1.00 % YTW SCENARIO
Maturity Type : Limit Maturity
Maturity Date : 2039-02-11
Maturity Price : 20.70
Evaluated at bid price : 20.70
Bid-YTW : 6.84 %
CM.PR.P Perpetual-Discount 1.01 % YTW SCENARIO
Maturity Type : Limit Maturity
Maturity Date : 2039-02-11
Maturity Price : 19.91
Evaluated at bid price : 19.91
Bid-YTW : 6.99 %
GWO.PR.G Perpetual-Discount 1.05 % YTW SCENARIO
Maturity Type : Limit Maturity
Maturity Date : 2039-02-11
Maturity Price : 18.26
Evaluated at bid price : 18.26
Bid-YTW : 7.25 %
BNS.PR.Q FixedReset 1.09 % YTW SCENARIO
Maturity Type : Limit Maturity
Maturity Date : 2039-02-11
Maturity Price : 22.20
Evaluated at bid price : 22.24
Bid-YTW : 4.48 %
BAM.PR.H OpRet 1.16 % YTW SCENARIO
Maturity Type : Soft Maturity
Maturity Date : 2012-03-30
Maturity Price : 25.00
Evaluated at bid price : 22.76
Bid-YTW : 9.44 %
FTN.PR.A SplitShare 1.26 % Asset coverage of 1.2+:1 as of January 30 according to the company.
YTW SCENARIO
Maturity Type : Hard Maturity
Maturity Date : 2015-12-01
Maturity Price : 10.00
Evaluated at bid price : 8.01
Bid-YTW : 9.38 %
W.PR.H Perpetual-Discount 1.28 % YTW SCENARIO
Maturity Type : Limit Maturity
Maturity Date : 2039-02-11
Maturity Price : 19.75
Evaluated at bid price : 19.75
Bid-YTW : 7.07 %
BAM.PR.O OpRet 1.46 % YTW SCENARIO
Maturity Type : Option Certainty
Maturity Date : 2013-06-30
Maturity Price : 25.00
Evaluated at bid price : 20.90
Bid-YTW : 9.94 %
CL.PR.B Perpetual-Discount 1.61 % YTW SCENARIO
Maturity Type : Limit Maturity
Maturity Date : 2039-02-11
Maturity Price : 21.45
Evaluated at bid price : 21.45
Bid-YTW : 7.42 %
ELF.PR.G Perpetual-Discount 2.26 % YTW SCENARIO
Maturity Type : Limit Maturity
Maturity Date : 2039-02-11
Maturity Price : 14.00
Evaluated at bid price : 14.00
Bid-YTW : 8.63 %
BAM.PR.I OpRet 2.57 % YTW SCENARIO
Maturity Type : Soft Maturity
Maturity Date : 2013-12-30
Maturity Price : 25.00
Evaluated at bid price : 21.55
Bid-YTW : 9.31 %
TRI.PR.B Floater 2.85 % YTW SCENARIO
Maturity Type : Limit Maturity
Maturity Date : 2039-02-11
Maturity Price : 12.65
Evaluated at bid price : 12.65
Bid-YTW : 4.19 %
BCE.PR.G FixedFloater 2.88 % YTW SCENARIO
Maturity Type : Limit Maturity
Maturity Date : 2039-02-11
Maturity Price : 25.00
Evaluated at bid price : 15.00
Bid-YTW : 7.10 %
BAM.PR.K Floater 3.22 % YTW SCENARIO
Maturity Type : Limit Maturity
Maturity Date : 2039-02-11
Maturity Price : 7.70
Evaluated at bid price : 7.70
Bid-YTW : 6.93 %
BCE.PR.F FixedFloater 7.07 % Catching up in price to the other fixed floaters on slightly below average volume. Traded 1800 shares in a range of 14.25-15.50 before closing at 15.00-50, 1×15.
YTW SCENARIO
Maturity Type : Limit Maturity
Maturity Date : 2039-02-11
Maturity Price : 25.00
Evaluated at bid price : 15.00
Bid-YTW : 7.01 %
Volume Highlights
Issue Index Shares
Traded
Notes
TD.PR.G FixedReset 266,723 Recent new issue.
YTW SCENARIO
Maturity Type : Call
Maturity Date : 2014-05-30
Maturity Price : 25.00
Evaluated at bid price : 25.10
Bid-YTW : 6.26 %
RY.PR.R FixedReset 102,142 Recent new issue.
YTW SCENARIO
Maturity Type : Call
Maturity Date : 2014-03-26
Maturity Price : 25.00
Evaluated at bid price : 25.15
Bid-YTW : 6.21 %
BNS.PR.X FixedReset 80,971 Recent new issue.
YTW SCENARIO
Maturity Type : Call
Maturity Date : 2014-05-25
Maturity Price : 25.00
Evaluated at bid price : 25.12
Bid-YTW : 6.24 %
BAM.PR.B Floater 67,039 Nesbitt bought 44,800 from Desjardins at 7.75.
YTW SCENARIO
Maturity Type : Limit Maturity
Maturity Date : 2039-02-11
Maturity Price : 7.71
Evaluated at bid price : 7.71
Bid-YTW : 6.92 %
BNS.PR.T FixedReset 66,130 Recent new issue.
YTW SCENARIO
Maturity Type : Limit Maturity
Maturity Date : 2039-02-11
Maturity Price : 25.06
Evaluated at bid price : 25.11
Bid-YTW : 6.16 %
WFS.PR.A SplitShare 58,900 Asset coverage of 1.1+:1 as of February 5 according to Mulvihill.
YTW SCENARIO
Maturity Type : Hard Maturity
Maturity Date : 2011-06-30
Maturity Price : 10.00
Evaluated at bid price : 8.57
Bid-YTW : 12.80 %
There were 25 other index-included issues trading in excess of 10,000 shares.

OSFI Report Card Ignores Investors

Wednesday, February 11th, 2009

The Treasury Board of Canada Secretariat has released its report card on OSFI’s performance in 2007-08.

It is without value. Despite the admission that (bolding added):

Primary to OSFI’s mission and central to its contribution to Canada’s financial system are two strategic outcomes:

  • To regulate and supervise to contribute to public confidence in Canada’s financial system and safeguard from undue loss. OSFI safeguards depositors, policyholders and private pension plan members by enhancing the safety and soundness of federally regulated financial institutions and private pension plans.
  • To contribute to public confidence in Canada’s public retirement income system

… OSFI’s success in meeting the objectives of interest to investors was determined by:

OSFI provided The Strategic Counsel, an independent research firm, with a list of CEOs of federally regulated financial institutions. The research firm invited the CEOs to participate in either an online or a telephone survey, and 166 (61%) participated. OSFI does not know which CEOs participated. The complete report is available on OSFI’s Web site under Organization / Reports/ Consultations and Surveys.

Yup, the people who can put me out of business tomorrow are doing just a fine job, no question, yup.

BCE Preferreds Downgraded to P-2(low) by S&P; to Pfd-3(high) by DBRS

Wednesday, February 11th, 2009

Standard & Poors has announced:

it raised its long-term corporate credit ratings on Montreal-based telecommunications holding company BCE Inc. and its principal operating subsidiary, Bell Canada, three notches to ‘BBB+’ from ‘BB+’. At the same time, we removed the ratings from CreditWatch with positive implications where they were placed Dec. 12, 2008, following the company’s announcement that its leveraged buyout (LBO) will not proceed. The outlook is stable.

“The rating action affects about C$7.1 billion of combined debt at BCE and Bell Canada as well as C$2.77 billion of BCE preferred shares,” said Standard & Poor’s credit analyst Madhav Hari. Based on Standard & Poor’s criteria for notching investment-grade debt, we have raised the issue-level rating on C$6.2 billion of Bell Canada’s senior unsecured debt to ‘BBB+’ from ‘BB+’ and raised the issue-level ratings on C$275 million of Bell Canada’s subordinated debt to ‘BBB’ from ‘BB’. At the same time, given our notching criteria for holding-company debt, we have affirmed the ratings on BCE’s C$650 million senior unsecured notes due Oct. 30, 2009, at ‘BBB+’; we currently expect that these obligations will be repaid at maturity from substantial cash balances at BCE. Also consistent with our criteria, we have affirmed the Canadian scale ratings on BCE’s preferred shares at P-2 (Low).

The stable outlook is based on our view of BCE’s expected low-single-digit revenue and EBITDA growth in the next few years, which we believe will allow the company to sustain conservative adjusted debt leverage at the 2x level, while maintaining a solid liquidity position. The stable outlook places significant emphasis on the company adhering to its publicly articulated financial policies. Given Standard & Poor’s concerns about increasing competition, and the potential for future shareholder-friendly
actions by the company, we believe it is currently less likely that we would revise the outlook to positive in the medium term. We could consider revising the outlook to negative should revenue and cash flow growth weaken, possibly from the combined effect of heightened competition and a prolonged economic downturn. We could also consider revising the outlook (or ratings) downward, if it became evident to us that BCE is considering a more aggressive shareholder-friendly policy.

DBRS has announced:

DBRS has today changed Bell Canada’s senior and subordinated debt ratings to A (low) and BBB, respectively, and assigned Bell Canada a short-term rating of R-1 (low). DBRS has also discontinued its Issuer Rating on Bell Canada. Additionally, with Bell Canada at A (low), DBRS has also changed its ratings on BCE Inc. (BCE or the Company) to BBB (high) and Pfd-3 (high) and assigned BCE Inc. a short-term rating of R-1 (low). All trends are Stable.

This rating action removes BCE and Bell Canada’s ratings from Under Review Developing and Positive implications, respectively. These reviews were initiated on December 11, 2008 following the termination of the privatization of BCE. DBRS had previously adjusted Bell Canada’s ratings in October 2008 under the assumption at that point that the privatization would close as planned.

DBRS’s ratings are driven by the credit profile of Bell Canada which is directly supported by the wireline, wireless and video operations of Bell Canada and its subsidiaries. BCE’s ratings reflect the structural subordination of its debt and preferred obligations relative to Bell Canada who supports these obligations. Bell Canada’s ratings are below its ratings prior to the privatization given a highly competitive operating environment for all of its services and execution risks centered on investing and repositioning Bell Canada to a more solid competitive footing. Despite this, Bell Canada’s A (low) rating reflects: (a) a good business risk profile; and (b) a reasonable financial risk profile which could improve incrementally over the next two years.

BCE preferreds were last mentioned on PrefBlog when DBRS put them on Review-Developing.

BCE has the following preferred shares outstanding: BCE.PR.A, BCE.PR.B, BCE.PR.C, BCE.PR.D, BCE.PR.E, BCE.PR.F, BCE.PR.G, BCE.PR.H, BCE.PR.I, BCE.PR.R, BCE.PR.S, BCE.PR.T, BCE.PR.Y & BCE.PR.Z

Update: If I look at my records for, say, BCE.PR.S, I find the following DBRS credit rating history:

BCE.PR.S
DBRS Credit
Rating History
From To Rating
2001-11-1 2002-4-23 Pfd-2(high)
2002-4-24 2005-11-2 Pfd-2
2005-11-3 2009-2-10 Pfd-2(low)
2009-2-11 Infinite
Date
Pfd-3(high)

I’m not certain … but I think I detect a pattern!

Bad Job, SunLife!

Wednesday, February 11th, 2009

The last dividend paid on the SunLife preferreds (SLF.PR.A, SLF.PR.B, SLF.PR.C, SLF.PR.D & SLF.PR.E) had an ex-dividend date of November 17, 2008.

Therefore, it is reasonable to pencil in February 17, 2009 as the ex-dividend date for the current dividend. And therefore, I assert, it is reasonable to expect that the dividend will be declared by February 11, 2009, regardless of the actual details of record and payment date.

‘Nope!’ says SunLife. ‘Can’t be bothered!’

The current dividend has not yet been declared and there is nothing on SunLife’s Investor Relations page to indicate any kind of schedule.

SunLife releases their 4th Quarter Earnings tomorrow and I can only speculate that some Moronic Boomer Asshole has determined that it would be efficient to release dividend details at the same time.

There is no doubt in my mind regarding payment of the current dividend; I have guessed at:

  • Ex-Date 2/17
  • Record-Date 2/19
  • Pay-Day 3/31

but it’s only a guess.

Sunlife’s carelessness in leaving the declaration so late – with no indication of the dates that are anticipated – shows a contempt for its shareholders. Get with the programme, guys!

Update, 2009-2-12: SunLife has announced:

the following quarterly dividends on its Class A Non-Cumulative Preferred Shares payable on March 31, 2009 to shareholders of record at the close of business on February 25, 2009: $0.296875 per Series 1 share; $0.30 per Series 2 share; $0.278125 per Series 3 share; $0.278125 per Series 4 share; and $0.28125 per Series 5 share.

February 10, 2009

Tuesday, February 10th, 2009

The Fed has announced:

that it is prepared to undertake a substantial expansion of the Term Asset-Backed Securities Loan Facility (TALF). The expansion could increase the size of the TALF to as much as $1 trillion and could broaden the eligible collateral to encompass other types of newly issued AAA-rated asset-backed securities, such as commercial mortgage-backed securities, private-label residential mortgage-backed securities, and other asset-backed securities. An expansion of the TALF would be supported by the provision by the Treasury of additional funds from the Troubled Asset Relief Program.

The Board’s objective in expanding the TALF would be to provide additional assistance to financial markets and institutions in meeting the credit needs of households and businesses and thus to support overall economic growth in the current period of severe financial strains. Decisions concerning the expansion of the TALF, which will be made in consultation with the Treasury Department, will draw on initial experience in administering the program and the Board’s assessment of the likely effectiveness of possible enhancements to the program in advancing its broad economic goals.

Under the current specification of the TALF, the Federal Reserve Bank of New York will lend to eligible owners of certain AAA-rated asset-backed securities (ABS). The Federal Reserve had previously announced that it would accept AAA-rated asset-backed securities backed by newly and recently originated auto loans, credit card loans, student loans, and SBA-guaranteed small business loans as collateral for TALF loans. The date that the TALF will commence operations will be announced later this month.

They will make credit available against good collateral – exactly what a central bank is supposed to do – but I will note that Across the Curve disagrees:

If I read the literature correctly, I would conclude that the TALF will be financed with a large scoop of funding from the central bank. Maybe I am being rigid in my thinking but that does not seem like something which should properly fall within the purview of the central bank.

This sounds like fiscal policy and not monetary policy and it would seem to me that the proper path would be for the elected representatives of the people should authorize the expenditure of one of the largest pools of money in human history. Allowing the Federal Reserve that much latitude, without a proper grant of authority from Congress seems literally undemocratic.

It also begs the question of Federal Reserve independence. The central bank has surrendered independence as the crisis has unfolded and Congress should step forward and provide a clear demarcation and definition of [roles] for the Treasury and its companion.

I disagree. I take the view that it only becomes fiscal policy if and when credit losses are expected and until then it’s monetary policy. I will presume that Bernanke & Co. are insisting on good enough collateral with high enough haircuts to keep it in the latter camp; and I will defend their authority to make the decision until it has been clearly shown otherwise.

Canadian auto subsidies have attracted notice from a Belgian academic, Johannes Van Biesebroeck, in a VoxEU piece Money for Nothing?:

Firms can draw on a long list of programmes for investment support. As of January 2009, the Ontario government’s web portal for initiatives to attract foreign investors listed 78 programmes offering subsidies or tax credits. Among the most important programmes are the Advanced Manufacturing Investment Strategy ($500 million over five years) geared towards innovation and advanced technologies, Strategic Manufacturing Investment grants (average annual budget of $63 million), and the Next Generation Jobs Fund ($650 million over five years) for green technologies.

Total support from just the four largest Ontario programmes has averaged a staggering $400 million per year, much of it for automotive investments.

Government discretion is often viewed with suspicion on political economy grounds, but a pure rules-based approach runs the risk of the winner’s curse if there is competition with other jurisdictions (Van Biesebroeck 2008). The largest subsidy package will be offered by the participant with the most upwardly biased information on potential benefits of the project. When the actual benefits become clear over time, the winner might regret having won.

On the day of the announcement, Canadian Press Harris-Decima completed a four-day survey showing strong popular support for a bailout of the carmakers. Supporters outnumbered opponents by a large margin – 56% versus 33% of respondents. This makes it easier to understand why the politicians stepped in. Ontario Premier McGuinty said “Our choice is to passively preside over the demise of the industry in Canada and observe its consolidation in the (US) or to act. We chose to act.” Apart from slowing down the demise, they have not made it clear what they hope to achieve with their actions.

Why do we subsidize them? Because they’re good jobs. Why are they good jobs? Because they’re subsidized.

Here’s a cheery update from the CDO market:

Almost half of all the complex credit products ever built out of slices of other securitised bonds have now defaulted, according to analysts, and the proportion rises to more than two-thirds among deals created at the peak of the cycle.

The defaults have affected more than $300bn worth of these collateralised debt obligations, which were built from bits of other asset backed securities (ABS) such as mortgage bonds, other CDOs and structured bonds, or derivatives of any of these, according to analysts at Wachovia and Morgan Stanley.

CDOs of ABS were used increasingly at the peak of the credit bubble to keep the securitisation machine moving by recycling hard to sell bits of subprime mortgage bonds and other risky tranches into new structures with top-notch credit ratings.

However, the ratings of these deals proved unsustainable, as evidenced by the fact they have accounted for 92.9 per cent of all 16,587 ratings downgrades globally from all rating agencies since the beginning of last year, according to Morgan Stanley.

The way these complex and risky transactions were exploited at the peak of the bubble can be seen in data from analysts at Wachovia, who reckon that 47.6 per cent of all CDOs of ABS by volume issued since the market substantively began in 2002 have now hit an event of default.

Equity markets expressed extreme disappointment with the Stimulus and Financing package as a whole, shocked that Obama didn’t wave his magic wand and make everything go away. Across the Curve has rather daringly republished a JP Morgan analysis of the Fed’s statements.

Canadian bonds had a reasonably good day, but the pref market simply yawned. Split shares did poorly, presumably due to asset coverage fears.

HIMIPref™ Preferred Indices
These values reflect the December 2008 revision of the HIMIPref™ Indices

Values are provisional and are finalized monthly
Index Mean
Current
Yield
(at bid)
Median
YTW
Median
Average
Trading
Value
Median
Mod Dur
(YTW)
Issues Day’s Perf. Index Value
Ratchet 5.29 % 3.76 % 24,059 17.82 2 0.2292 % 863.0
FixedFloater 7.30 % 6.86 % 65,590 13.97 7 0.4632 % 1,374.8
Floater 5.29 % 4.31 % 30,821 16.75 4 0.7108 % 992.2
OpRet 5.26 % 4.68 % 151,129 4.00 15 0.1188 % 2,044.8
SplitShare 6.23 % 9.28 % 71,123 4.07 15 -0.5342 % 1,788.9
Interest-Bearing 7.09 % 8.62 % 32,919 0.85 2 -0.9742 % 1,995.5
Perpetual-Premium 0.00 % 0.00 % 0 0.00 0 0.0985 % 1,564.1
Perpetual-Discount 6.88 % 6.94 % 207,287 12.63 71 0.0985 % 1,440.5
FixedReset 6.08 % 5.72 % 648,149 13.96 27 0.3857 % 1,809.4
Performance Highlights
Issue Index Change Notes
BCE.PR.F FixedFloater -3.71 % YTW SCENARIO
Maturity Type : Limit Maturity
Maturity Date : 2039-02-10
Maturity Price : 25.00
Evaluated at bid price : 14.01
Bid-YTW : 7.53 %
ELF.PR.G Perpetual-Discount -2.56 % YTW SCENARIO
Maturity Type : Limit Maturity
Maturity Date : 2039-02-10
Maturity Price : 13.69
Evaluated at bid price : 13.69
Bid-YTW : 8.83 %
CL.PR.B Perpetual-Discount -2.49 % YTW SCENARIO
Maturity Type : Limit Maturity
Maturity Date : 2039-02-10
Maturity Price : 21.11
Evaluated at bid price : 21.11
Bid-YTW : 7.54 %
BNA.PR.C SplitShare -2.12 % Asset coverage of 1.9-:1 as of January 31 according to the company.
YTW SCENARIO
Maturity Type : Hard Maturity
Maturity Date : 2019-01-10
Maturity Price : 25.00
Evaluated at bid price : 12.00
Bid-YTW : 14.71 %
FIG.PR.A Interest-Bearing -2.10 % Asset coverage of 1.1-:1 as of February 6, based on Capital units at $1.49 and 0.53 Capital Units per preferred..
YTW SCENARIO
Maturity Type : Hard Maturity
Maturity Date : 2014-12-31
Maturity Price : 10.00
Evaluated at bid price : 7.45
Bid-YTW : 12.83 %
PPL.PR.A SplitShare -1.63 % Asset coverage of 1.3+:1 as of January 30 according to the company.
YTW SCENARIO
Maturity Type : Hard Maturity
Maturity Date : 2012-12-01
Maturity Price : 10.00
Evaluated at bid price : 9.05
Bid-YTW : 7.96 %
ALB.PR.A SplitShare -1.41 % Asset coverage of 1.1+:1 as of February 5 according to Scotia.
YTW SCENARIO
Maturity Type : Hard Maturity
Maturity Date : 2011-02-28
Maturity Price : 25.00
Evaluated at bid price : 19.63
Bid-YTW : 17.84 %
WFS.PR.A SplitShare -1.38 % Asset coverage of 1.1+:1 as of January 31 according to Mulvihill.
YTW SCENARIO
Maturity Type : Hard Maturity
Maturity Date : 2011-06-30
Maturity Price : 10.00
Evaluated at bid price : 8.56
Bid-YTW : 12.84 %
FTN.PR.A SplitShare -1.37 % Asset coverage of 1.2+:1 as of January 30 according to the company.
YTW SCENARIO
Maturity Type : Hard Maturity
Maturity Date : 2015-12-01
Maturity Price : 10.00
Evaluated at bid price : 7.91
Bid-YTW : 9.62 %
BAM.PR.K Floater -1.19 % YTW SCENARIO
Maturity Type : Limit Maturity
Maturity Date : 2039-02-10
Maturity Price : 7.46
Evaluated at bid price : 7.46
Bid-YTW : 7.16 %
RY.PR.B Perpetual-Discount -1.12 % YTW SCENARIO
Maturity Type : Limit Maturity
Maturity Date : 2039-02-10
Maturity Price : 17.70
Evaluated at bid price : 17.70
Bid-YTW : 6.68 %
BNS.PR.N Perpetual-Discount -1.11 % YTW SCENARIO
Maturity Type : Limit Maturity
Maturity Date : 2039-02-10
Maturity Price : 19.56
Evaluated at bid price : 19.56
Bid-YTW : 6.79 %
PWF.PR.K Perpetual-Discount -1.10 % YTW SCENARIO
Maturity Type : Limit Maturity
Maturity Date : 2039-02-10
Maturity Price : 17.11
Evaluated at bid price : 17.11
Bid-YTW : 7.32 %
NA.PR.L Perpetual-Discount -1.00 % YTW SCENARIO
Maturity Type : Limit Maturity
Maturity Date : 2039-02-10
Maturity Price : 17.80
Evaluated at bid price : 17.80
Bid-YTW : 6.87 %
PWF.PR.A Floater 1.07 % YTW SCENARIO
Maturity Type : Limit Maturity
Maturity Date : 2039-02-10
Maturity Price : 12.25
Evaluated at bid price : 12.25
Bid-YTW : 4.29 %
NA.PR.P FixedReset 1.12 % YTW SCENARIO
Maturity Type : Call
Maturity Date : 2014-03-17
Maturity Price : 25.00
Evaluated at bid price : 25.29
Bid-YTW : 6.43 %
RY.PR.I FixedReset 1.12 % YTW SCENARIO
Maturity Type : Limit Maturity
Maturity Date : 2039-02-10
Maturity Price : 22.46
Evaluated at bid price : 22.50
Bid-YTW : 4.63 %
BAM.PR.M Perpetual-Discount 1.19 % YTW SCENARIO
Maturity Type : Limit Maturity
Maturity Date : 2039-02-10
Maturity Price : 12.75
Evaluated at bid price : 12.75
Bid-YTW : 9.53 %
BMO.PR.M FixedReset 1.30 % YTW SCENARIO
Maturity Type : Limit Maturity
Maturity Date : 2039-02-10
Maturity Price : 21.80
Evaluated at bid price : 21.85
Bid-YTW : 4.48 %
W.PR.H Perpetual-Discount 1.35 % YTW SCENARIO
Maturity Type : Limit Maturity
Maturity Date : 2039-02-10
Maturity Price : 19.50
Evaluated at bid price : 19.50
Bid-YTW : 7.16 %
CM.PR.E Perpetual-Discount 1.37 % YTW SCENARIO
Maturity Type : Limit Maturity
Maturity Date : 2039-02-10
Maturity Price : 19.95
Evaluated at bid price : 19.95
Bid-YTW : 7.10 %
IAG.PR.A Perpetual-Discount 1.44 % YTW SCENARIO
Maturity Type : Limit Maturity
Maturity Date : 2039-02-10
Maturity Price : 16.90
Evaluated at bid price : 16.90
Bid-YTW : 6.93 %
HSB.PR.D Perpetual-Discount 1.89 % YTW SCENARIO
Maturity Type : Limit Maturity
Maturity Date : 2039-02-10
Maturity Price : 17.75
Evaluated at bid price : 17.75
Bid-YTW : 7.17 %
TRI.PR.B Floater 2.07 % YTW SCENARIO
Maturity Type : Limit Maturity
Maturity Date : 2039-02-10
Maturity Price : 12.30
Evaluated at bid price : 12.30
Bid-YTW : 4.31 %
BAM.PR.J OpRet 2.14 % YTW SCENARIO
Maturity Type : Soft Maturity
Maturity Date : 2018-03-30
Maturity Price : 25.00
Evaluated at bid price : 18.59
Bid-YTW : 9.90 %
PWF.PR.L Perpetual-Discount 2.49 % YTW SCENARIO
Maturity Type : Limit Maturity
Maturity Date : 2039-02-10
Maturity Price : 17.70
Evaluated at bid price : 17.70
Bid-YTW : 7.29 %
CM.PR.K FixedReset 3.21 % YTW SCENARIO
Maturity Type : Limit Maturity
Maturity Date : 2039-02-10
Maturity Price : 21.95
Evaluated at bid price : 22.50
Bid-YTW : 4.99 %
BCE.PR.Z FixedFloater 4.85 % YTW SCENARIO
Maturity Type : Limit Maturity
Maturity Date : 2039-02-10
Maturity Price : 25.00
Evaluated at bid price : 15.99
Bid-YTW : 6.70 %
Volume Highlights
Issue Index Shares
Traded
Notes
TD.PR.G FixedReset 156,281 Recent new issue.
YTW SCENARIO
Maturity Type : Call
Maturity Date : 2014-05-30
Maturity Price : 25.00
Evaluated at bid price : 25.01
Bid-YTW : 6.34 %
RY.PR.R FixedReset 99,545 Recent new issue.
YTW SCENARIO
Maturity Type : Call
Maturity Date : 2014-03-26
Maturity Price : 25.00
Evaluated at bid price : 25.06
Bid-YTW : 6.29 %
BNS.PR.X FixedReset 95,276 Recent new issue.
YTW SCENARIO
Maturity Type : Call
Maturity Date : 2014-05-25
Maturity Price : 25.00
Evaluated at bid price : 25.03
Bid-YTW : 6.32 %
CM.PR.L FixedReset 81,869 Recent new issue.
YTW SCENARIO
Maturity Type : Call
Maturity Date : 2014-05-30
Maturity Price : 25.00
Evaluated at bid price : 25.15
Bid-YTW : 6.44 %
TD.PR.P Perpetual-Discount 68,069 Nesbitt bought 60,300 from National at 20.24.
YTW SCENARIO
Maturity Type : Limit Maturity
Maturity Date : 2039-02-10
Maturity Price : 20.10
Evaluated at bid price : 20.10
Bid-YTW : 6.60 %
NA.PR.P FixedReset 46,630 Recent new issue.
YTW SCENARIO
Maturity Type : Call
Maturity Date : 2014-03-17
Maturity Price : 25.00
Evaluated at bid price : 25.29
Bid-YTW : 6.43 %
There were 29 other index-included issues trading in excess of 10,000 shares.

CDS Debt Decoupling to be Tested by Lyondell

Tuesday, February 10th, 2009

OK, OK, I know that this is a blog about preferred shares … but I can’t resist sneaking in the occasional story about Credit Default Swaps.

In the primer on CDS I referred to a paper by Hu & Black regarding debt decoupling:

We have also heard from bankruptcy judges that they sometimes see odd behavior in their courtrooms, which empty crediting might explain. For example, one judge described a case in which a junior creditor complained that the firm’s value was too high, even though a lower value would hurt the class of debt the creditor ostensibly held.

Now we’ve got a reasonably big name company going to the mat in US courts at … well, not quite the peak of hysteria, but pretty close … to “recouple” the interests of the cash and derivative markets … as reported by the Financial Times:

Lawyers for Lyondell Chemical, the US unit that is in Chapter 11, have secured a temporary restraining order and preliminary injunction against a group of creditors.

“The threat of CDS holders trying to force companies into an insolvency in order to trigger their recovery rights against their CDS counterparty will almost certainly be an issue in the wave of debt restructurings this year,” said Mark Hyde, head of debt restructuring at Clifford Chance, an adviser to LyondellBasell in Europe. Mr Hyde said that in cases where investors attempted such actions, it could undermine chances of completing a successful restructuring. Mr Hyde declined to comment on the specifics of the Lyondell case.

LyondellBasell could become an important test case for CDS markets and the restructuring industry.

There have already been a number of cases where CDS investors have been able to exert a strong influence on either the financing or restructuring of companies. These include VNU, the multinational media business, GUS, the UK retail group, and Cablecom, a Dutch communications company.

However, there have not yet been reported examples of CDS investors forcing a company into insolvency simply to trigger protection payments from the contracts they have bought.

This is fascinating. Watch this space … and make some popcorn.

DMN.PR.A Declares Deferred Dividend

Tuesday, February 10th, 2009

This is kind of cool! Dominion Citrus has announced:

a dividend of $0.0759375 per preference share upon the outstanding Series A Preference Shares of the corporation be and the same is hereby declared to shareholders of record as at the close of business on February 20, 2009. This dividend while declared will not be paid until such time as the Directors feel appropriate. We estimate a payment date of October 15, 2009.

DMN.PR.A is not tracked by HIMIPref™.

SNH.PR.U Maturity Price Finalized

Tuesday, February 10th, 2009

SNP Health Split Corp. has announced:

that the redemption prices for all outstanding Capital Shares and Preferred Shares to be paid on February 11, 2009 are as follows:

Redemption Price per Preferred Share = US$25.00

Redemption Price per Capital Share = US$2.6507

Holders of 250,730 Capital Shares requested delivery of and will receive their pro rata share of the portfolio securities in payment for their Capital Shares.

The intent to proceed with the maturity has been discussed on PrefBlog.

SNH.PR.U is not tracked by HIMIPref™.