Month: July 2010

MAPF

MAPF Performance: June 2010

The fund had a very good month in June, outperforming all the relevant indices and passive funds as the Seniority Spread (interest-equivalent PerpetualDiscount yield less the yield on long corporates) declined significantly from 315bp on May 31 to 290bp on June 30. The spread narrowing was not the only part of the story, however, as long corporate yields declined from 5.65% to 5.45%.

The fund’s Net Asset Value per Unit as of the close June was $10.5770 after a dividend distribution of $0.143686 per unit.

Returns to June 30, 2010
Period MAPF Index CPD
according to
Claymore
One Month +5.49% +2.87% +2.59%
Three Months +4.60% +1.17% +1.33%
One Year +20.72% +12.67% +9.02%
Two Years (annualized) +31.02% +6.05% +4.17%*
Three Years (annualized) +17.96% +2.47% +0.44%
Four Years (annualized) +14.64% +1.77%  
Five Years (annualized) +12.55% +1.96%  
Six Years (annualized) +12.09% +2.71%  
Seven Years (annualized) +13.24% +2.93%  
Eight Years (annualized) +12.45% +3.55%  
Nine Years (annualized) +12.78% +3.50%  
The Index is the BMO-CM “50”
MAPF returns assume reinvestment of dividends, and are shown after expenses but before fees.
CPD Returns are for the NAV and are after all fees and expenses.
* CPD does not directly report its two-year returns. The figure shown is the square root of product of the current one-year return and the similar figure reported for June 2009.
Figures for Omega Preferred Equity (which are after all fees and expenses) for 1-, 3- and 12-months are +3.01%, +1.35% and +11.46%, respectively, according to Morningstar after all fees & expenses
Figures for Jov Leon Frazer Preferred Equity Fund Class I Units (which are after all fees and expenses) for 1-, 3- and 12-months are +2.74%, +0.66% & +7.33% respectively, according to Morningstar
Figures for AIC Preferred Income Fund (which are after all fees and expenses) for 1-, 3- and 12-months are +3.12%, +0.20% & +7.08%, respectively

MAPF returns assume reinvestment of dividends, and are shown after expenses but before fees. Past performance is not a guarantee of future performance. You can lose money investing in Malachite Aggressive Preferred Fund or any other fund. For more information, see the fund’s main page.

I am very pleased with the returns over the past year (which, now that the market and the fund’s returns have moderated, are now merely superb, as opposed to “ridiculous” or “nonsensical”), but implore Assiduous Readers not to project this level of outperformance for the indefinite future. The year in the preferred share market was filled with episodes of panic and euphoria, together with many new entrants who do not appear to know what they are doing; perfect conditions for a disciplined quantitative approach.

Sometimes everything works … sometimes the trading works, but sectoral shifts overwhelm the increment … sometimes nothing works. The fund seeks to earn incremental return by selling liquidity (that is, taking the other side of trades that other market participants are strongly motivated to execute), which can also be referred to as ‘trading noise’. There have been a lot of strongly motivated market participants in the past year, generating a lot of noise! The conditions of the past two years may never be repeated in my lifetime … but the fund will simply attempt to make trades when swaps seem profitable, whether that implies monthly turnover of 10% or 100%.

There’s plenty of room for new money left in the fund. Just don’t expect the current level of outperformance every year, OK? While I will continue to exert utmost efforts to outperform, it should be borne in mind that beating the index by 500bp represents a good year, and there will almost inevitably be periods of underperformance in the future.

The yields available on high quality preferred shares remain elevated, which is reflected in the current estimate of sustainable income.

Calculation of MAPF Sustainable Income Per Unit
Month NAVPU Portfolio
Average
YTW
Leverage
Divisor
Securities
Average
YTW
Capital
Gains
Multiplier
Sustainable
Income
per
current
Unit
June, 2007 9.3114 5.16% 1.03 5.01% 1.1883 0.3926
September 9.1489 5.35% 0.98 5.46% 1.1883 0.4203
December, 2007 9.0070 5.53% 0.942 5.87% 1.1883 0.4448
March, 2008 8.8512 6.17% 1.047 5.89% 1.1883 0.4389
June 8.3419 6.034% 0.952 6.338% 1.1883 $0.4449
September 8.1886 7.108% 0.969 7.335% 1.1883 $0.5054
December, 2008 8.0464 9.24% 1.008 9.166% 1.1883 $0.6206
March 2009 $8.8317 8.60% 0.995 8.802% 1.1883 $0.6423
June 10.9846 7.05% 0.999 7.057% 1.1883 $0.6524
September 12.3462 6.03% 0.998 6.042% 1.1883 $0.6278
December 2009 10.5662 5.74% 0.981 5.851% 1.0000 $0.6182
March 2010 10.2497 6.03% 0.992 6.079% 1.0000 $0.6231
June 2010 10.5770 5.96% 0.996 5.984% 1.0000 $0.6329
NAVPU is shown after quarterly distributions of dividend income and annual distribution of capital gains.
Portfolio YTW includes cash (or margin borrowing), with an assumed interest rate of 0.00%
The Leverage Divisor indicates the level of cash in the account: if the portfolio is 1% in cash, the Leverage Divisor will be 0.99
Securities YTW divides “Portfolio YTW” by the “Leverage Divisor” to show the average YTW on the securities held; this assumes that the cash is invested in (or raised from) all securities held, in proportion to their holdings.
The Capital Gains Multiplier adjusts for the effects of Capital Gains Dividends. On 2009-12-31, there was a capital gains distribution of $1.989262 which is assumed for this purpose to have been reinvested at the final price of $10.5662. Thus, a holder of one unit pre-distribution would have held 1.1883 units post-distribution; the CG Multiplier reflects this to make the time-series comparable. Note that Dividend Distributions are not assumed to be reinvested.
Sustainable Income is the resultant estimate of the fund’s dividend income per current unit, before fees and expenses. Note that a “current unit” includes reinvestment of prior capital gains; a unitholder would have had the calculated sustainable income with only, say, 0.9 units in the past which, with reinvestment of capital gains, would become 1.0 current units.

Significant positions were held in Fixed-Reset issues on June 30; all of which (with the exception of YPG.PR.C) currently have their yields calculated with the presumption that they will be called by the issuers at par at the first possible opportunity. A split-share issue (BNA.PR.C) is also held; since this has a maturity date, the yield cannot be regarded as permanently sustainable. This presents another complication in the calculation of sustainable yield.

However, if the entire portfolio except for the PerpetualDiscounts were to be sold and reinvested in these issues, the yield of the portfolio would be the 6.11% shown in the MAPF Portfolio Composition: June 2010 analysis (which is in excess of the 5.97% index yield on June 30). Given such reinvestment, the sustainable yield would be $10.5770 * 0.0611 = 0.6463, whereas a similar calculations for March results in $0.6457 (figures for April and May are not comparable due to distributions of dividends to unitholders).

Different assumptions lead to different results from the calculation, but the overall positive trend is apparent. I’m very pleased with the results! It will be noted that if there was no trading in the portfolio, one would expect the sustainable yield to be constant (before fees and expenses). The success of the fund’s trading is showing up in

  • the very good performance against the index
  • the long term increases in sustainable income per unit

As has been noted, the fund has maintained a credit quality equal to or better than the index; outperformance is due to constant exploitation of trading anomalies.

Again, there are no predictions for the future! The fund will continue to trade between issues in an attempt to exploit market gaps in liquidity, in an effort to outperform the index and keep the sustainable income per unit – however calculated! – growing.
MAPF

MAPF Portfolio Composition: June 2010

Turnover picked up substantially in June to about 53%. It’s about time we saw some useful volatility!

Trades were, as ever, triggered by a desire to exploit transient mispricing in the preferred share market (which may the thought of as “selling liquidity”), rather than any particular view being taken on market direction, sectoral performance or credit anticipation.

MAPF Sectoral Analysis 2010-6-30
HIMI Indices Sector Weighting YTW ModDur
Ratchet 0% N/A N/A
FixFloat 0% N/A N/A
Floater 0% N/A N/A
OpRet 0% N/A N/A
SplitShare 2.9% (-1.1) 7.97% 6.79
Interest Rearing 0% N/A N/A
PerpetualPremium 0.0% (0) N/A N/A
PerpetualDiscount 82.4% (+1.1) 6.11% 13.77
Fixed-Reset 9.8% (+0.6) 3.86% 3.44
Scraps (FixedReset) 4.4% (-0.5) 7.01% 12.53
Cash 0.4% (-0.1) 0.00% 0.00
Total 100% 5.96% 12.45
Totals and changes will not add precisely due to rounding. Bracketted figures represent change from May month-end. Cash is included in totals with duration and yield both equal to zero.

The “total” reflects the un-leveraged total portfolio (i.e., cash is included in the portfolio calculations and is deemed to have a duration and yield of 0.00.). MAPF will often have relatively large cash balances, both credit and debit, to facilitate trading. Figures presented in the table have been rounded to the indicated precision.

I recently received a question from a potential investor:

I just had a look at MAPF’s portfolio composition and noticed that it is very heavily in perpetual preferreds at a discount. I’m a bit surprised. I would think the general expectation is that interest rates will rise, which would reduce prices for perpetuals. What is the transient mispricing in the market for perpetuals that you are seeing now? Thanks very much in advance and best wishes,

I replied:

HIMIPref assigns a valuation to each issue which may be approximated as

V = Y + D

where Y is yield and D is Disparity.

Since PerpetualDiscounts yield so much more than FixedResets, there is somthing of a hurdle the latter class must get over before they are valued sufficiently highly to be included in a portfolio, but this effect is relatively small (see http://www.prefshares.com/overview/valuation.php)

Disparity is calclated according to the individual issue’s distance from the self-consistent yield curve. Fitting the yield curve provides several normalization factors, so that, for instance, the average disparity of all FixedResets will be zero, of all PerpetualDiscounts to be zero, of all issues rated Pfd-1(low) to be zero, etc. Note, however that the yield curve fitting is done with squared error, so that this will not be precisely true.

PerpetualDiscounts are far more widely dispersed about their mean than FixedResets; for instance, there is very obvious evidence of Credit Stratification (see http://www.prefblog.com/?p=2340) in this class, whereas the market appears to treat all FixedResets of like credit identically (see last two issues of PrefLetter).

Thus, the issues with the highest Valuation will tend to be PerpetualDiscounts.

When you write “the general expectation is that interest rates will rise”, I have to ask: which interest rates? Long, short, corporate, government? Long Corporates have been on wheels lately, fuelled by increasing speculation regarding deflation.

I guess I didn’t really answer one part of his question in detail: What is the transient mispricing in the market for perpetuals that you are seeing now? However, I show a sequence of trades below in which the fund was able to improve credit quality at what may be considered to be a low cost.

Credit distribution is:

MAPF Credit Analysis 2010-6-30
DBRS Rating Weighting
Pfd-1 0 (0)
Pfd-1(low) 69.2% (+8.2)
Pfd-2(high) 11.8% (-5.5)
Pfd-2 0 (0)
Pfd-2(low) 14.1% (-2.2)
Pfd-3(high) 4.4% (-0.5)
Cash 0.4% (-0.1)
Totals will not add precisely due to rounding. Bracketted figures represent change from Junel month-end.

The increase in credit quality was due in part to swaps from POW.PR.D (Pfd-2(high)) to GWO.PR.I (Pfd-1(low)):

MAPF Trades, POW.PR.D to GWO.PR.I
Date POW.PR.D GWO.PR.I
5/31 19.77
bid
6.43%
Yield
17.64
bid
6.39%
Yield
6/18 Sold
21.01
Bought
18.70
6/23 Sold
20.78
Bought
18.74
6/25 Sold
20.87
Bought
18.85
6/30 20.69
bid
6.07%
Yield
18.81
bid
6.02%
Yield
Dividends Ex 6/21
0.3125
 
Only major trades are shown. Not all trades affecting credit quality are reported. Details are incomplete and approximate. All trades wil be published at the time the Semi-annual report is released.

Liquidity Distribution is:

MAPF Liquidity Analysis 2010-6-30
Average Daily Trading Weighting
<$50,000 0.0% (0)
$50,000 – $100,000 2.9% (+2.9)
$100,000 – $200,000 40.8% (+13.4)
$200,000 – $300,000 32.0% (-18.5)
>$300,000 24.0% (+0.4)
Cash 0.4% (-0.1)
Totals will not add precisely due to rounding. Bracketted figures represent change from May month-end.

MAPF is, of course, Malachite Aggressive Preferred Fund, a “unit trust” managed by Hymas Investment Management Inc. Further information and links to performance, audited financials and subscription information are available the fund’s web page. A “unit trust” is like a regular mutual fund, but is sold by offering memorandum rather than prospectus. This is cheaper, but means subscription is restricted to “accredited investors” (as defined by the Ontario Securities Commission) and those who subscribe for $150,000+. Fund past performances are not a guarantee of future performance. You can lose money investing in MAPF or any other fund.

A similar portfolio composition analysis has been performed on the Claymore Preferred Share ETF (symbol CPD) as of August 17, 2009, and published in the September, 2009, PrefLetter. When comparing CPD and MAPF:

  • MAPF credit quality is better
  • MAPF liquidity is a little lower
  • MAPF Yield is higher
  • Weightings in
    • MAPF is much more exposed to PerpetualDiscounts
    • MAPF is much less exposed to Operating Retractibles
    • MAPF is more exposed to SplitShares
    • MAPF is less exposed to FixFloat / Floater / Ratchet
    • MAPF weighting in FixedResets is much lower
Market Action

July 2, 2010

The US jobs number was poor:

Employment at companies rose 83,000, less than the 110,000 gain forecast by economists in a Bloomberg News survey. Including government, payrolls fell for the first time this year because of a drop in federal census workers. The jobless rate dropped to 9.5 percent from 9.7 percent as the labor force shrank, the Labor Department reported today in Washington.

OSFI has published a presentation by Michel Montambeault, Director, to the Canada Institute of Actuaries (CIA) Annual Meeting, on the topic of “Canadian Mortality Experience”, 29 June 2010, Vancouver, British Columbia. In related news, a cluster of longevity genes has been identified:

U.S. scientists say they have discovered the genetic signature of an exceptionally long life, and with nothing more than a DNA sample they can predict – with 77 per cent accuracy – those biologically built to live beyond a century.

They also predict that such a test, based on a set of 150 genetic markers, will be available to the curious by summer’s end.

“It’s really quite revolutionary,” said Thomas Perls, associate professor of medicine at Boston University and senior author of a research paper published online Thursday by the journal Science. “With the accuracy we’ve demonstrated, companies are going to pick this up. We’ll see it on the market in a month.”

Adverse selection just became a bigger risk for the insurance companies!

I sent an eMail to the Toronto Stock Exchange:

On June 30, MFC.PR.B traded 5,792 shares on the TSX in a range of 19.63-80 and closed at 19.01-66, 10×12. The last trade was at 3:58pm, 300 shares at 19.66.

I have a number of questions:
i) Who is the market maker for this issue?
ii) Which firm employs the market maker?
iii) What committments were made regarding spreads by the market maker?
iv) How have these committments been kept over the past year?
v) How have other committments made by this market maker been kept over the past year?
vi) How have other committments made by the market maker’s firm been kept over the past year?

We’ll see what happens with that! (Fearless prediction: Nothing).

On an extremely quiet day in the Canadian preferred share market, PerpetualDiscounts lost 4bp while FixedResets gained 14bp.

HIMIPref™ Preferred Indices
These values reflect the December 2008 revision of the HIMIPref™ Indices

Values are provisional and are finalized monthly
Index Mean
Current
Yield
(at bid)
Median
YTW
Median
Average
Trading
Value
Median
Mod Dur
(YTW)
Issues Day’s Perf. Index Value
Ratchet 2.82 % 2.92 % 26,768 20.33 1 0.0000 % 2,048.5
FixedFloater 0.00 % 0.00 % 0 0.00 0 -1.0732 % 3,107.8
Floater 2.32 % 1.97 % 46,034 22.46 4 -1.0732 % 2,215.1
OpRet 4.87 % 3.59 % 79,627 0.88 11 -0.0671 % 2,334.3
SplitShare 6.38 % 6.36 % 87,888 3.46 2 -0.2195 % 2,173.9
Interest-Bearing 0.00 % 0.00 % 0 0.00 0 -0.0671 % 2,134.5
Perpetual-Premium 5.98 % 5.88 % 121,604 1.86 4 -0.2973 % 1,910.6
Perpetual-Discount 5.94 % 6.01 % 188,996 13.90 73 -0.0418 % 1,813.2
FixedReset 5.37 % 3.90 % 325,073 3.49 47 0.1434 % 2,192.4
Performance Highlights
Issue Index Change Notes
BAM.PR.B Floater -2.03 % YTW SCENARIO
Maturity Type : Limit Maturity
Maturity Date : 2040-07-02
Maturity Price : 14.99
Evaluated at bid price : 14.99
Bid-YTW : 2.93 %
BAM.PR.K Floater -1.70 % YTW SCENARIO
Maturity Type : Limit Maturity
Maturity Date : 2040-07-02
Maturity Price : 15.00
Evaluated at bid price : 15.00
Bid-YTW : 2.93 %
BAM.PR.H OpRet -1.23 % YTW SCENARIO
Maturity Type : Call
Maturity Date : 2010-08-01
Maturity Price : 25.50
Evaluated at bid price : 25.60
Bid-YTW : 1.24 %
PWF.PR.A Floater -1.12 % YTW SCENARIO
Maturity Type : Limit Maturity
Maturity Date : 2040-07-02
Maturity Price : 21.75
Evaluated at bid price : 22.00
Bid-YTW : 1.97 %
PWF.PR.O Perpetual-Discount -1.00 % YTW SCENARIO
Maturity Type : Limit Maturity
Maturity Date : 2040-07-02
Maturity Price : 23.58
Evaluated at bid price : 23.76
Bid-YTW : 6.22 %
BAM.PR.R FixedReset 1.15 % YTW SCENARIO
Maturity Type : Limit Maturity
Maturity Date : 2040-07-02
Maturity Price : 23.26
Evaluated at bid price : 25.50
Bid-YTW : 4.77 %
BNS.PR.Q FixedReset 1.28 % YTW SCENARIO
Maturity Type : Call
Maturity Date : 2013-11-24
Maturity Price : 25.00
Evaluated at bid price : 25.99
Bid-YTW : 3.60 %
NA.PR.O FixedReset 1.56 % YTW SCENARIO
Maturity Type : Call
Maturity Date : 2014-03-17
Maturity Price : 25.00
Evaluated at bid price : 27.94
Bid-YTW : 3.49 %
MFC.PR.B Perpetual-Discount 2.84 % YTW SCENARIO
Maturity Type : Limit Maturity
Maturity Date : 2040-07-02
Maturity Price : 19.55
Evaluated at bid price : 19.55
Bid-YTW : 6.01 %
Volume Highlights
Issue Index Shares
Traded
Notes
RY.PR.R FixedReset 31,130 Desjardins crossed 27,400 at 27.37.
YTW SCENARIO
Maturity Type : Call
Maturity Date : 2014-03-26
Maturity Price : 25.00
Evaluated at bid price : 27.50
Bid-YTW : 3.62 %
RY.PR.A Perpetual-Discount 25,703 YTW SCENARIO
Maturity Type : Limit Maturity
Maturity Date : 2040-07-02
Maturity Price : 19.56
Evaluated at bid price : 19.56
Bid-YTW : 5.77 %
MFC.PR.D FixedReset 19,477 YTW SCENARIO
Maturity Type : Call
Maturity Date : 2014-07-19
Maturity Price : 25.00
Evaluated at bid price : 27.50
Bid-YTW : 4.02 %
TRP.PR.C FixedReset 14,275 Recent new issue.
YTW SCENARIO
Maturity Type : Limit Maturity
Maturity Date : 2040-07-02
Maturity Price : 23.11
Evaluated at bid price : 24.96
Bid-YTW : 4.02 %
BNS.PR.N Perpetual-Discount 13,990 YTW SCENARIO
Maturity Type : Limit Maturity
Maturity Date : 2040-07-02
Maturity Price : 22.42
Evaluated at bid price : 22.55
Bid-YTW : 5.83 %
CM.PR.L FixedReset 13,735 YTW SCENARIO
Maturity Type : Call
Maturity Date : 2014-05-30
Maturity Price : 25.00
Evaluated at bid price : 27.78
Bid-YTW : 3.35 %
There were 5 other index-included issues trading in excess of 10,000 shares.
Index Construction / Reporting

Index Performance: June 2010

Performance of the HIMIPref™ Indices for June, 2010, was:

Total Return
Index Performance
June 2010
Three Months
to
June 30, 2010
Ratchet -1.41% -5.25%
FixFloat +1.88% -2.05%
Floater -0.44% -8.10%
OpRet +1.41% +1.09%
SplitShare +1.33% +1.90%
Interest +1.41%**** +1.09%****
PerpetualPremium +5.32%* +3.08%*
PerpetualDiscount +5.32% +4.14%
FixedReset +1.59% -0.34%
* The last member of the PerpetualPremium index was transferred to PerpetualDiscount at the May, 2010, rebalancing; subsequent performance figures are set equal to the PerpetualPremium index
**** The last member of the InterestBearing index was transferred to Scraps at the June, 2009, rebalancing; subsequent performance figures are set equal to the OperatingRetractible index
Passive Funds (see below for calculations)
CPD +2.58% +1.33%
DPS.UN +3.42% +1.09%
Index
BMO-CM 50 +2.87% +1.17%
TXPR Total Return +2.64% +1.40%

The pre-tax interest equivalent spread of PerpetualDiscounts over Long Corporates (which I also refer to as the Seniority Spread) ended the month at 290bp a significant decline from the +315bp recorded on May 31. The big story was the decline in long corporate yields, from 5.65% to 5.45%, as increased chatter about deflation has the market timers all excited.

I would be happier with long corporates in the 6.00-6.25% range, but what do I know? The market has never shown any particular interest in my happiness.

Charts related to the Seniority Spread and the Bozo Spread (PerpetualDiscount Current Yield less FixedReset Current Yield) are published in PrefLetter.

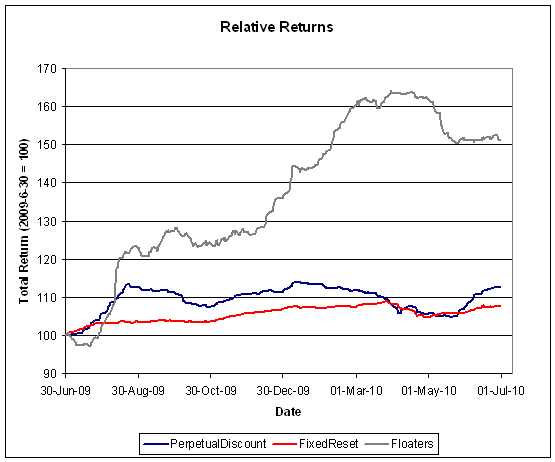
The trailing year returns are starting to look a bit more normal.


Click for big

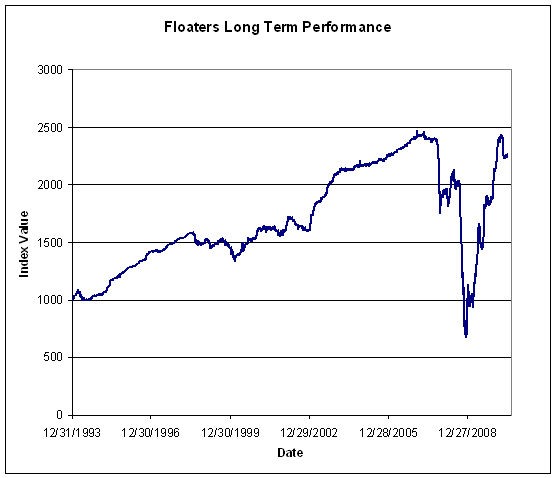
Floaters have had a wild ride


Click for big

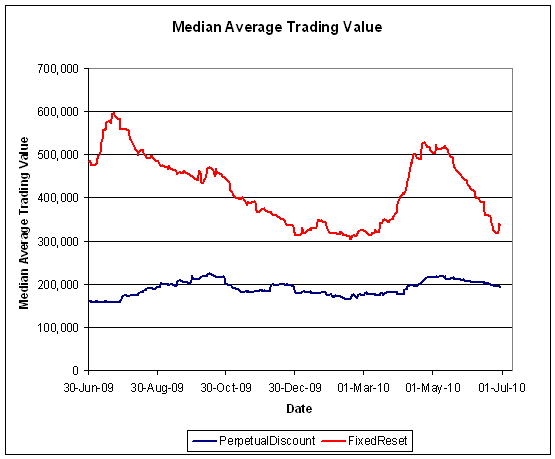
FixedReset volume declined during the month after their burst of activity in April when they performed poorly. Volume may be under-reported due to the influence of Alternative Trading Systems (as discussed in the November PrefLetter), but I am biding my time before incorporating ATS volumes into the calculations, to see if the effect is transient or not.


Click for big

Compositions of the passive funds were discussed in the September, 2009, edition of PrefLetter.

Claymore has published NAV and distribution data (problems with the page in IE8 can be kludged by using compatibility view) for its exchange traded fund (CPD) and I have derived the following table:

CPD Return, 1- & 3-month, to June, 2010
Date NAV Distribution Return for Sub-Period Monthly Return
March 31, 2010 16.46 0.00    
April 30 16.11     -2.13%
May 31 16.26     +0.93%
June 25 16.47 0.21 +2.58% +2.58%
June 30, 2010 16.47 0.00 0.00%
Quarterly Return +1.33%

Claymore currently holds $444,847,391 (advisor & common combined) in CPD assets, up about $13-million from the $431,929,434 reported last month and up about $71-million from the $373,729,364 reported at year-end. The monthly increase in AUM of about 2.99% is larger than the total return of +2.58%, implying that the ETF experienced small net subscriptions in May.

The DPS.UN NAV for June 30 has been published so we may calculate the approximate May returns.

DPS.UN NAV Return, June-ish 2010
Date NAV Distribution Return for sub-period Return for period
Estimated May Ending Stub -0.74% **
May 26, 2010 19.34      
June 28 19.85 * 0.30   +4.19%
June 30, 2010 19.85     0.00%
Estimated June Return +3.42% ***
*CPD had a NAVPU of 16.47 on June 28 and 16.47 on June 30, hence the total return for the period for CPD was +0.00%. The return for DPS.UN in this period is presumed to be equal, hence the estimated NAV for DPS.UN on June 28 is presumed to be equal to the June 30 value.
**CPD had a NAVPU of 16.14 on May 26 and 16.26 on May 31, hence the total return for the period for CPD was +0.74%. The return for DPS.UN in this period is presumed to be equal.
*** The estimated June return for DPS.UN’s NAV is therefore the product of three period returns, -0.74%, +4.19% and 0.00% to arrive at an estimate for the calendar month of +3.42%

Now, to see the DPS.UN quarterly NAV approximate return, we refer to the calculations for April and May:

DPS.UN NAV Returns, three-month-ish to end-June-ish, 2010
April-ish -2.47%
May-ish +0.22%
June-ish +3.42%
Three-months-ish +1.09%
Index Construction / Reporting

HIMIPref™ Index Rebalancing: June, 2010

HIMI Index Changes, June 30, 2010
Issue From To Because
BAM.PR.G FixFloat Scraps Volume
PWF.PR.A Scraps Floater Volume
CL.PR.B PerpetualDiscount PerpetualPremium Price
NA.PR.M PerpetualDiscount PerpetualPremium Price
CU.PR.B PerpetualDiscount PerpetualPremium Price
BMO.PR.L PerpetualDiscount PerpetualPremium Price

The strong performance of Straight Perpetuals over the past month means that the PerpetualPremium index has been repopulated, albeit lightly and weakly. Unfortunately, however, low volumes on BAM.PR.G have resulted in its relegation to the Scraps index, leaving FixedFloaters as an empty set.

There were the following intra-month changes:

HIMI Index Changes during June 2010
Issue Action Index Because
EMA.PR.A Add Scraps New Issue
TRP.PR.C Add FixedReset New Issue
PWF.PR.P Add FixedReset New Issue
Issue Comments

Best & Worst Performers: June 2010

These are total returns, with dividends presumed to have been reinvested at the bid price on the ex-date. The list has been restricted to issues in the HIMIPref™ indices.

June 2010
Issue Index DBRS Rating Monthly Performance Notes (“Now” means “June 30”)
BAM.PR.K Floater Pfd-2(low) -3.41% Also the worst performer in May.
BAM.PR.B Floater Pfd-2(low) -2.56% Also the second-worst performer in May.
GWO.PR.J FixedReset Pfd-1(low) -2.37% It’s presence here is largely due to a disappearing bid on June 30: the closing quote was 25.92-62, after trading 3,400 shares in a range of 26.62-85. Now with a (bid) yield of 4.90% based on a bid of 25.92 an a call 2014-1-30 at 25.00.
BAM.PR.E Ratchet Pfd-2(low) -1.41% Strong Pair with BAM.PR.G. Also the fourth-worst performer in May.
BNA.PR.D SplitShare Pfd-2(low) -0.19% Now with a pre-tax bid-YTW of 6.35% based on a bid of 25.95 and a hardMaturity 2014-7-9 at 25.00.
W.PR.J Perpetual-Discount Pfd-2(low) +8.01% Now with a pre-tax bid-TTW of 6.10% based on a bid of 23.00 and a limitMaturity.
W.PR.H Perpetual-Discount Pfd-2(low) +8.05% Now with a pre-tax bid-TTW of 6.11% based on a bid of 22.53 and a limitMaturity.
BAM.PR.M Perpetual-Discount Pfd-2(low) +8.26% Now with a pre-tax bid-TTW of 6.59% based on a bid of 18.16 and a limitMaturity.
IAG.PR.A Perpetual-Discount Pfd-2(high) +8.72% The fifth-worst performer in May, so a lot of this return is merely bounce-back. Now with a pre-tax bid-TTW of 6.03% based on a bid of 19.20 and a limitMaturity.
ELF.PR.G Perpetual-Discount Pfd-2(low) +9.10% Now with a pre-tax bid-YTW of 6.62% based on a bid of 18.03 and a limitMaturity.