Archive for November, 2010

Index Performance: October 2010

Tuesday, November 2nd, 2010

Performance of the HIMIPref™ Indices for October, 2010, was:

Total Return
Index Performance
October 2010
Three Months
to
October 29, 2010
Ratchet +1.81% *** +5.11% ***
FixFloat +1.81% ** +5.11% **
Floater +1.81% +5.11%
OpRet +0.13% +1.38%
SplitShare +1.50% +7.48%
Interest +0.13%**** +1.38%****
PerpetualPremium +1.07% +4.06
PerpetualDiscount +2.31% +8.70%
FixedReset +0.71% +2.17%
** The last member of the FixedFloater index was transferred to Scraps at the June, 2010, rebalancing; subsequent performance figures are set equal to the Floater index
*** The last member of the RatchetRate index was transferred to Scraps at the July, 2010, rebalancing; subsequent performance figures are set equal to the Floater index
**** The last member of the InterestBearing index was transferred to Scraps at the June, 2009, rebalancing; subsequent performance figures are set equal to the OperatingRetractible index
Passive Funds (see below for calculations)
CPD +1.40% +4.73%
DPS.UN +0.17% +5.92%
Index
BMO-CM 50 +2.02% +5.84%
TXPR Total Return +1.55% +5.16%

CPD again took a good hit on its tracking error against TXPR, down 15bp on the month and 43bp on the quarter. The advertised MER of 0.48% implies these figures should be 4bp and 12bp in the absence of trading frictions. I’m happy! One man’s market impact cost is another man’s market-making gain, and if Claymore is incurring market impact costs in the neighborhood of 100bp p.a., that’s over $5-million on the table to be divvied up by guys like me.

The pre-tax interest equivalent spread of PerpetualDiscounts over Long Corporates (which I also refer to as the Seniority Spread) ended the month at 235bp, a significant decline from the 265bp reported at September month-end. Long corporate yields declined to 5.2% from 5.3% during the period while PerpetualDiscounts had a larger decline in dividend terms, from 5.69% to 5.41%, which became from 7.97% to 7.57% in interest-equivalent terms at the standard conversion factor of 1.4x. I would be happier with long corporates in the 6.00-6.25% range with a seniority spread in the range of 100-150bp, but what do I know? The market has never shown any particular interest in my happiness.

Long Corporates reached a plateau in October:


Click for Big

Charts related to the Seniority Spread and the Bozo Spread (PerpetualDiscount Current Yield less FixedReset Current Yield) are published in PrefLetter.

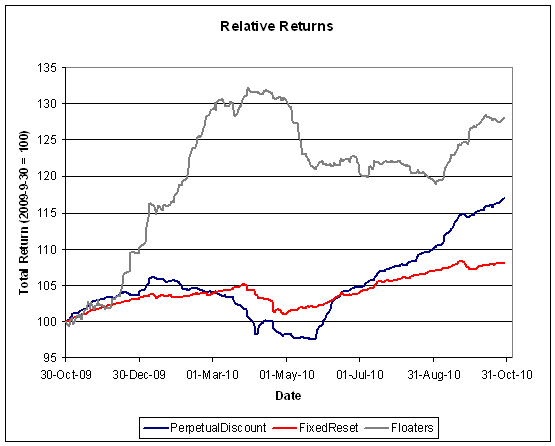
The trailing year returns are starting to look a bit more normal.


Click for big

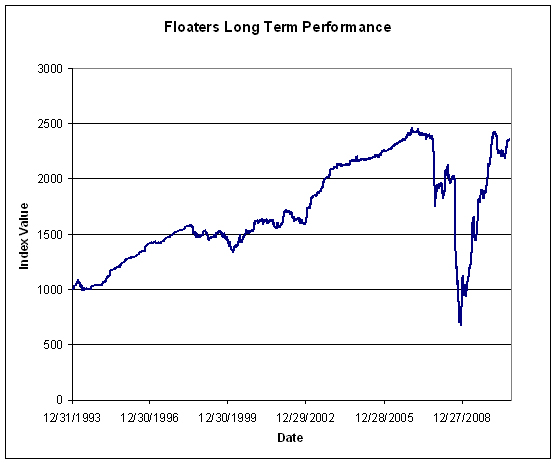
Floaters have had a wild ride; the latest decline is presumably due to the idea that the BoC will be slower rather than faster in hiking the overnight rate. I’m going to keep publishing updates of this graph until the one-year trailing return for the sector no longer looks so gigantic:


Click for big

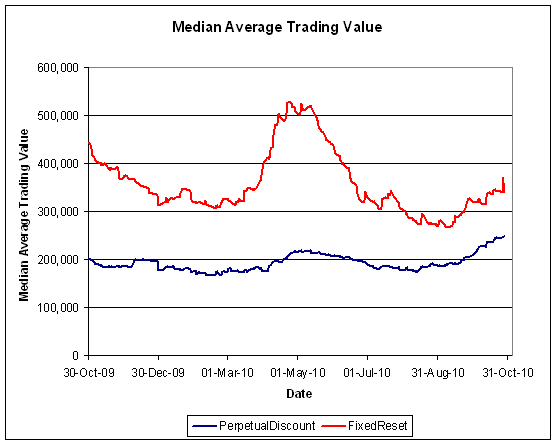
Volumes are on their way back up Volume may be under-reported due to the influence of Alternative Trading Systems (as discussed in the November PrefLetter), but I am biding my time before incorporating ATS volumes into the calculations, to see if the effect is transient or not.


Click for big

Compositions of the passive funds were discussed in the September, 2010, edition of PrefLetter.

Claymore has published NAV and distribution data (problems with the page in IE8 can be kludged by using compatibility view) for its exchange traded fund (CPD) and I have derived the following table:

CPD Return, 1- & 3-month, to October 29, 2010
Date NAV Distribution Return for Sub-Period Monthly Return
July 30, 2010 16.66    
August 26 16.76 0.069 +1.01% +1.12%
August 31 16.78   +0.11%
September 27 17.12 0.069 +2.44% +2.14%
September 30 17.07   -0.29%
October 26 17.21 0.069 +1.22% +1.40%
October 29, 2010 17.24   +0.17%
Quarterly Return +4.73%

Claymore currently holds $559,641,405 (advisor & common combined) in CPD assets, up about $24-million from the $486,846,162 reported at August month-end and up about $186-million from the $373,729,364 reported at year-end. Their tracking error does not seem to be affecting their ability to gather assets!

The DPS.UN NAV for September 1 has been published so we may calculate the approximate August returns.

DPS.UN NAV Return, September-ish and October-ish 2010
Date NAV Distribution Return for sub-period Return for period
September 1, 2010 20.57      
September 28 21.17 ** 0.30 +4.38%  
September 29 21.12   -0.23%  
October 27 21.12   0.00%  
Estimated September Beginning Stub +0.24% *
Estimated September Ending Stub 0.0% ***
Estimated October Ending Stub +0.17% *****
Estimated September Return +4.39% ****
Estimated October Return +0.17% ******
*CPD had a NAVPU of 16.82 on September 1 and 16.78 on August 31, hence the total return for the period for CPD was +0.24%. The return for DPS.UN in this period is presumed to be equal.
**CPD had a NAVPU of 17.11 on September 28 and 17.07 on September 29, therefore the return for the day was -0.23%. The reported NAV of DPS.UN was 21.12 on September 29, so, assuming returns were approximately equal for the day, the NAV would have been 21.17
***CPD had a NAVPU of 17.07 on September 29 and 17.07 on September 30, hence the total return for the period for CPD was +0.00%. The return for DPS.UN in this period is presumed to be equal.
**** The estimated September return for DPS.UN’s NAV is therefore the product of four period returns, +0.24%, +4.38%, -0.23% and 0.00% to arrive at an estimate for the calendar month of +4.39%
*****CPD had a NAVPU of 17.21 on October 27 and 17.24 on October 29, hence the total return for the period for CPD was +0.17%. The return for DPS.UN in this period is presumed to be equal.
**** The estimated October return for DPS.UN’s NAV is therefore the product of three period returns, +0.00%, +0.00%, +0.17% to arrive at an estimate for the calendar month of +0.17%

Note that Sentry Select claims September performance of 3.7%, but I believe this is price-based, whereas my calculations are NAV-based. DPS.UN currently trades at a discount of about 4% to its NAV.

Now, to see the DPS.UN quarterly NAV approximate return, we refer to the calculations for August:

DPS.UN NAV Returns, three-month-ish to end-October-ish, 2010
August-ish +1.29%
September-ish +4.39%
October-ish +0.17%
Three-months-ish +5.92%

Sentry Select is now publishing performance data for DPS.UN, but this appears to be price-based, rather than NAV-based. I will continue to report NAV-based figures.
OSFI Releases New Seg Fund Risk Guidelines

Tuesday, November 2nd, 2010

The Office of the Superintendent of Financial Institutions has released Revised Guidance for Companies that Determine Segregated Fund Guarantee Capital Requirements Using an Approved Model. This is the change we were told to expect in August.

The guts of the change appears to be distribution and correlation requirements for equity indices:

New minimum quantitative calibration criteria are mandated for the scenarios used to model the returns of the following total return equity indexes (henceforth referred to as “listed indexes”):

  • TSX
  • Canadian small cap equity, mid cap equity and specialty equity
  • S&P 500
  • US small cap equity, mid cap equity and specialty equity
  • MSCI World Equity and MSCI EAFE

The actual investment return scenarios for each of the listed indexes used in the determination of total requirements must meet the criteria specified in the following table.

Furthermore, the arithmetic average of the actual investment return scenarios for each listed index over any one-year period (including the one-year period starting on the valuation date) cannot be greater than 10%. All of these criteria must be met for the scenarios of a listed index to be in accordance with the new minimum calibration criteria.

Modeled scenarios of TSX total return indexes must continue to satisfy the CIA calibration criteria at all percentiles over the five- and ten-year time horizons as published in the CIA’s March 2002 report, in addition to the criteria above. Modeled scenarios of S&P 500 total return indexes must satisfy the American Academy of Actuaries’ calibration criteria for equities [footnote] at all percentiles over the five-, ten- and twenty-year time horizons, in addition to the criteria above.

The scenarios used to model returns of an equity index that is not one of the listed indexes need not meet the same calibration criteria, but must still be consistent with the calibrated scenarios used to model the returns of the listed indexes.

Correlation: The scenarios used to model returns for different equity indexes should be positively correlated with one another. Unless it can be justified otherwise, the correlation between the returns generated for any two equity indexes (whether or not they are listed) should be at least 70%. If scenarios are generated using a model that distinguishes between positive and negative trend market phases (e.g. the regime-switching lognormal model with two regimes) then, unless it can be justified otherwise, the scenarios should be such that there is a very high probability that different equity indexes will be in the same market phase at the same time, and a very low probability that different equity indexes will be in different phases at the same time.

Footnote: For example, as published in the June 2005 document entitled “Recommended Approach for Setting Regulatory Risk-Based Capital Requirements for Variable Annuities and Similar Products”.

The table excised from the quotation above is:

  Time Period
  6 Months 1 Year
Left Tail Criteria    
2.5th percentile of return not greater than -25% -35%
5th percentile of return not greater than -18% -26%
10th percentile of return not greater than -10% -15%
Right Tail Criteria    
90th percentile of return not less than 20% 30%
95th percentile of return not less than 25% 38%
97.5th percentile of return not less than 30% 45%

These criteria equate, very approximately, to a mean expected return of 8% and a standard deviation of 20.5%. Interested readers can fiddle with the variables and log-normal distributions in the comments.

The American Academy of Actuaries’ Recommended Approach for Setting Regulatory Risk-Based Capital Requirements for Variable Annuities and Similar Products notes:

Short period distributions of historic equity returns typically show negative skewness, positive kurtosis (fat tails) with time varying volatility and increased volatility in bear markets. The measure of kurtosis declines when looking at returns over longer time horizons and successive application of a short-term model with finite higher moments will result in longer horizon returns that converge towards normality. Ideally the distribution of returns for a given model should reflect these characteristics. Of course, due to random sampling, not every scenario would show such attributes.

Unfortunately, at longer time horizons the small sample sizes of the historic data make it much more difficult to make credible inferences about the characteristics of the return distribution, especially in the tails. As such, the calibration criteria are derived from a model (fitted to historic S&P500 monthly returns) and not based solely on empirical observations. However, the calibration points are not strictly taken from one specific model for market returns; instead, they have been adjusted slightly to permit several well known and reasonable models (appropriately parameterized) to pass the criteria. Statistics for the observed data are offered as support for the recommendations.

… and they also provide a table:

Table 1: Calibration Standard for Total Return Wealth Ratios
Percentile 1 Year 5 Years 10 Years 20 Years
2.5% 0.78 0.72 0.79 n/a
5.0% 0.84 0.81 0.94 1.51
10.0% 0.90 0.94 1.16 2.10
90.0% 1.28 2.17 3.63 9.02
95.0% 1.35 2.45 4.36 11.70
2.5% 1.42 2.72 5.12 n/a

where:

The ‘wealth factors’ are defined as gross accumulated values (i.e., before the deduction of fees and charges) with complete reinvestment of income and maturities, starting with a unit investment. These can be less than 1, with “1” meaning a zero return over the holding period.

To interpret the above values, consider the 5-year point of 0.72 at the α = 2.5th percentile. This value implies that there is a 2.5 percent probability of the accumulated value of a unit investment being less than 0.72 in 5-years time, ignoring fees and expenses and without knowing the initial state of the process (i.e., this is an unconditional probability). For left-tail calibration points (i.e., those quantiles less than 50%), lower factors after model calibration are required. For right-tail calibration points (quantiles above 50%), the model must produce higher factors.

To my astonishment, I was able to find a copy of CIA Document 202012 (sounds like an analysis of the Mayan calendar) via the World Bank. I will refer to it as Final Report of the CIA Task Force on Segregated Fund Investment Guarantees. Ths calibration is:

Table 1
Accumulation Period 2.5th percentile 5th percentile 10th percentile
One Year 0.76 0.82 0.90
Five Years 0.75 0.85 1.05
Ten Years 0.85 1.05 1.35

The new standard has a significantly nastier left-tail than the prior standards:

Comparison of Left Tails
One Year Horizon
Standard 2.5th %-ile 5th %-ile 10th %-ile
OSFI New -35% -26% -15%
American -22% -16% -10%
Canadian -24% -18% -10%

However, in the absence of information regarding the insurers’ models together with detailed data, it is impossible to determine how capital requirements will be affected by the change. This could be a welcome first step towards rationalizing seg fund capital requirements; it could also be window-dressing that OSFI knows will have no effect but makes them look tough. As suggested by Desjardins, we will simply have to wait for commentary in the coming batch of quarterly reports. It will be noted that GWO, SLF and MFC have all warned about the potential for adverse change.

For myself, I am disappointed that while OSFI is addressing intricacies of model calibration, it is not mandating additional disclosures or reviewing their highly politicized cover-up from the Fall of 2008. It became quite apparent during the Panic of 2007 that the currently mandated disclosure of the effect of a 10% decline in equity prices is nowhere near good enough to allow investors to take an informed view on the adequacy of capitalization. Would it really be so difficult and so invasive to mandate a table showing the effects on capital and comprehensive income of the effects of 10%, 20% and 30% declines?

SPL.A Wound Up

Tuesday, November 2nd, 2010

Mulvihill Pro-AMS RSP Split Share Corp. has announced:

that its shareholders approved a special resolution amending the Articles of the Fund to terminate the Fund in advance of the redemption date originally scheduled for December 31, 2013. As a result of such approval, the Fund will redeem all Class A Shares and Class B Shares on October 29, 2010 for the redemption amounts to which holders are entitled. It is expected that the last trading day for the shares will be October 28, 2010 and the proceeds from the redemption of the Class A Shares and Class B Shares are expected to be paid in approximately 10 business days from the redemption date. No action need be taken by holders of Class A Shares or Class B Shares to receive their redemption amounts.

Given the small size of the Fund, operating costs are becoming a greater burden on the net asset value while
trading liquidity has been significantly reduced. Redeeming all Class A Shares and Class B Shares on October 29, 2010 will preserve value for shareholders. As a result of the redemption, the Class A Shares and Class B Shares of the Fund will be de-listed by the Toronto Stock Exchange.

The NAV of SPL.A was 8.49 as of October 29. As of the June 30, 2010, financial statements the fund value was $8.92-million.

SPL.A was last mentioned on PrefBlog when its credit rating was discontinued by DBRS. SPL.A was tracked by HIMIPref&trades;, but was relegated to the Scraps index at the October 2002 rebalancing on volume concerns. It was downgraded to Pfd-3 by DBRS as of April 9, 2003.

November 1, 2010

Monday, November 1st, 2010

Fabulous Fab’s trial is progressing … slowly:

U.S. District Judge Barbara S. Jones today dismissed Tourre’s motion seeking a judgment in the case. He had argued that the SEC can’t sue him over a Goldman Sachs deal involving collateralized debt obligations because the transaction didn’t take place in the U.S.

In the same order, Jones said the SEC can file an amended complaint by Nov. 22.

“Defendant Tourre’s motion for judgment on the pleadings is dismissed without prejudice and with leave to renew after plaintiff has filed its amended complaint,” Jones wrote.

The U.S. Supreme Court ruled in June that U.S. securities laws don’t apply to claims of foreign buyers of non-U.S. securities on foreign exchanges, lawyers for the Goldman executive director said in a court filing in September. The collateralized debt obligations, known as Abacus, at issue in the SEC’s complaint weren’t listed on any exchange and the sole investor in the notes was a foreign bank that bought them overseas, according to the filing.

Never waste a crisis – even if it wasn’t really a crisis:

In a speech at Notre Dame University, CFTC Commissioner Bart Chilton said the agency already has the authority to impose limits on how many financial futures contracts any one market player can hold, although he didn’t offer any details on what kind of limits might be appropriate.

“I think we need some sort of boundary on financial futures as well as futures on commodities of finite supply like energy, metals and agriculture,” he said in prepared remarks. “How and what those confines are I don’t know at this time, but it seems only prudent to institute some type of restrictions to ensure we don’t again see another flash crash, or even a miniflash crash.”

“I’m talking about sensible, well-calibrated limits to give us a handle on these markets,” he said.

He said he would like to see limits imposed on “robotic algo-trading” and “high-frequency trading,” although he noted that “like financial futures, it isn’t clear how it would be best achieved.”

Meanwhile, on Friday, a joint advisory committee to the SEC and CFTC will meet to discuss the flash-crash report and come up with some recommendations. Mr. Gensler previously has outlined some areas he would like to explore, including new obligations for brokers executing algorithms for their clients and greater transparency in the public listing at exchanges of bids and offers.

Hurray! All we have to do is support the regulators and investors will never, ever have to worry about losing money again!

The Lancet has taken a strong stand against candy:

One of the world’s most influential medical journals is accusing UNICEF Canada of selling out its values by allowing candy giant Cadbury to use its logo to sell Halloween candy.

In an editorial published online Saturday, the Lancet slammed UNICEF Canada for accepting $500,000 from Cadbury Adams Canada Inc. over a three-year period for construction of schools in Africa in exchange for allowing the company to plaster the iconic – and valuable – UNICEF logo on millions of product packages a year.

UNICEF Canada has made a serious error in judgment by allowing a candy company to use its name to sell high-fat, high-sugar and overall unhealthy products under the guise of raising money for African programs, the editorial states.

In Canada, a country with serious health and obesity problems, “encouraging products which are undeniably unhealthy is irresponsible,” the editorial says.

I was about to buy a bag of Cadbury stuff until I saw the logo, at which point I replaced it on the shelf; but that was because UNICEF is a sleazy organization, not because I’m a precious little doorknob. I bought other brands of chocolate instead; for next year I’m considering cigarettes.

The Canadian preferred share market had yet another good day today, wth PerpetualDiscounts gaining 24bp and FixedResets winning 17bp. Volume continued to be quite good.

HIMIPref™ Preferred Indices
These values reflect the December 2008 revision of the HIMIPref™ Indices

Values are provisional and are finalized monthly
Index Mean
Current
Yield
(at bid)
Median
YTW
Median
Average
Trading
Value
Median
Mod Dur
(YTW)
Issues Day’s Perf. Index Value
Ratchet 0.00 % 0.00 % 0 0.00 0 0.5190 % 2,196.3
FixedFloater 5.06 % 3.64 % 26,623 19.07 1 0.4673 % 3,325.5
Floater 2.71 % 2.38 % 56,186 21.30 4 0.5190 % 2,371.5
OpRet 4.81 % 3.36 % 77,747 1.89 9 0.1582 % 2,378.5
SplitShare 5.88 % -16.99 % 67,524 0.09 2 0.0000 % 2,396.2
Interest-Bearing 0.00 % 0.00 % 0 0.00 0 0.1582 % 2,174.9
Perpetual-Premium 5.66 % 5.11 % 153,386 3.10 24 -0.1005 % 2,013.8
Perpetual-Discount 5.38 % 5.41 % 255,171 14.77 53 0.2364 % 2,029.2
FixedReset 5.22 % 3.00 % 338,201 3.23 50 0.1700 % 2,280.4
Performance Highlights
Issue Index Change Notes
IAG.PR.E Perpetual-Premium -2.45 % YTW SCENARIO
Maturity Type : Call
Maturity Date : 2019-01-30
Maturity Price : 25.00
Evaluated at bid price : 25.51
Bid-YTW : 5.81 %
POW.PR.B Perpetual-Discount 1.08 % YTW SCENARIO
Maturity Type : Limit Maturity
Maturity Date : 2040-11-01
Maturity Price : 24.02
Evaluated at bid price : 24.30
Bid-YTW : 5.54 %
BAM.PR.R FixedReset 1.15 % YTW SCENARIO
Maturity Type : Call
Maturity Date : 2021-07-30
Maturity Price : 25.00
Evaluated at bid price : 26.30
Bid-YTW : 4.33 %
GWO.PR.I Perpetual-Discount 1.52 % YTW SCENARIO
Maturity Type : Limit Maturity
Maturity Date : 2040-11-01
Maturity Price : 21.35
Evaluated at bid price : 21.35
Bid-YTW : 5.34 %
IAG.PR.C FixedReset 1.73 % YTW SCENARIO
Maturity Type : Call
Maturity Date : 2014-01-30
Maturity Price : 25.00
Evaluated at bid price : 27.57
Bid-YTW : 3.05 %
GWO.PR.H Perpetual-Discount 2.21 % YTW SCENARIO
Maturity Type : Limit Maturity
Maturity Date : 2040-11-01
Maturity Price : 22.89
Evaluated at bid price : 23.10
Bid-YTW : 5.30 %
Volume Highlights
Issue Index Shares
Traded
Notes
TD.PR.G FixedReset 136,639 TD crossed two blocks of 25,000 each, both at 27.89. Nesbitt crosse blocks of 48,800 and 25,000 at the same price.
YTW SCENARIO
Maturity Type : Call
Maturity Date : 2014-05-30
Maturity Price : 25.00
Evaluated at bid price : 27.86
Bid-YTW : 2.89 %
BNS.PR.P FixedReset 132,068 RBC crossed 97,400 at 26.55; National crossed 25,000 at 26.57.
YTW SCENARIO
Maturity Type : Call
Maturity Date : 2013-05-25
Maturity Price : 25.00
Evaluated at bid price : 26.57
Bid-YTW : 2.39 %
BAM.PR.T FixedReset 107,129 Recent new issue.
YTW SCENARIO
Maturity Type : Limit Maturity
Maturity Date : 2040-11-01
Maturity Price : 22.99
Evaluated at bid price : 24.70
Bid-YTW : 4.24 %
RY.PR.R FixedReset 106,125 National crossed 50,000 at 27.63; Nesbitt crossed 50,000 at the same price.
YTW SCENARIO
Maturity Type : Call
Maturity Date : 2014-03-26
Maturity Price : 25.00
Evaluated at bid price : 27.62
Bid-YTW : 2.89 %
MFC.PR.A OpRet 67,650 Desjardins bought 36,100 from Nesbitt at 25.50 and crossed 23,600 at the same price.
YTW SCENARIO
Maturity Type : Soft Maturity
Maturity Date : 2015-12-18
Maturity Price : 25.00
Evaluated at bid price : 25.45
Bid-YTW : 3.83 %
TD.PR.M OpRet 63,734 Desjardins crossed 45,000 at 25.80.
YTW SCENARIO
Maturity Type : Call
Maturity Date : 2010-12-01
Maturity Price : 25.75
Evaluated at bid price : 25.80
Bid-YTW : 2.36 %
There were 40 other index-included issues trading in excess of 10,000 shares.