So I was talking to a guy on the weekend who said he’d worked out that his house value had multiplied forty times since he bought it in 1967. Pretty good, eh? How does it compare to other things?
So the S&P 500 beat my buddy’s house over the period, but only by about 1.7% annually; property taxes, maintenance and insurance have been ignored, but so has rent … I suspect that once you throw everything into the mix the house has done a lot better.
Got some data? Let me know and I’ll add it to the table.
Coincidentally, Rob Carrick writes:
National price data from the Canadian Real Estate Association shows an average annual gain of 5.4 per cent nationally from 2004 through 2013 for resale homes. The comparable average return from stocks was just under 8 per cent. If we go back 20 years, we get an 8.3 per cent gain from Canadian stocks and an increase of 4.5 per cent in the average national house price. Over 30 years, stocks made 8.5 per cent and houses 5.5 per cent.
Stocks, or at least the benchmark for the Canadian market, win. Case closed. So why do houses enjoy such a great reputation as an investment? Some answers to this question were recently presented in a blog post by Adrian Spitters, a certified financial planner (CFP) with Assante Capital Management Ltd. in Abbotsford, B.C. For one thing, he thinks people take a much longer-term view of housing prices than they do with stocks. With stocks, they focus a lot on short-term price fluctuations and lose sight of long-term results.
The perception of stocks has also been hurt by two market crashes since 2000, even though long-term investors have still done fine. “Years ago, when people didn’t have access to information online, I don’t think they panicked as much about stocks,” Mr. Spitters said in an interview. “People tend to be more aware of the volatility.”
He also says people ignore the true cost of owning a home and thus come away with an overly optimistic view of how much money they’ve made. Property taxes, furnishings, maintenance, improvements, insurance and mortgage interest all have to be factored into calculations of how much money is being made on housing.
Property taxes, maintenance and insurance, I agree. Furnishings, mortgage interest, I disagree. But one thing is, of course, that houses can be levered up higher than equities.
Sunday School. Coming soon to a trading desk near you!
The video, shared widely on social media Friday, takes aim at the famously crass culture on trading floors – most recently highlighted in The Wolf of Wall Street movie – and is part of a broader campaign to change the corporate culture at scandal-plagued Deutsche Bank, which has faced major penalties in recent years for improper trading practices.
Mr. Fan warns in the video that all e-mails and conversations are open to scrutiny when regulators are investigating a case of suspected wrongdoing and said “communications that run even a small risk of being seen as unprofessional” must stop “right now.”
“Some of you are falling way short of our established standards,” Mr. Fan says in the video. “Let’s be clear: Our reputation is everything. Being boastful, indiscreet and vulgar is not okay. It will have serious consequences for your career, and I have lost patience on this issue.”
Assiduous Reader DW writes in and says:
I’ve read with some interest your recent posts on bond ladders. (I would have responded on your site, if I could figure out how to sign-in without re-registering. Although I’ve commented before, the system has no record of me; and instead of repeating the registration process again, I’ve decided to send you this note.)
I confess that many of the points raised by others and addressed by you are lost on me, in part because it’s easy to buy a bond ladder via an ETF and in part because I buy bond ladders as an act of duration defence, not offence; but also in part because I lack the financial sophistication to grasp some of the finer points – either that or they seem too minor for me to worry about.
But I have a specific question that ties into your point that some people hold short-term instruments to counter-balance longer-term fixed income, such as the preferred shares you recommend. I’m interested in your thoughts on whether it might make sense to use something like First Asset’s Laddered 1-5 Year Strip Bond ETF (BXF) for short-duration exposure. I like the strip aspect of the ETF because it eliminate the adverse tax effect of an ETF holding premium bonds; and I like the longer-term defensive characteristics of the ladder format. Your comments go me wondering whether it might make sense to construct something of a synthetic fixed income barbell by putting half of the fixed income allocation in something like BXF and half in a collection of the PrefLetter recommendations.
On this point, if it’s feasible, it would be nice to see some recommendations in your PrefLetter on this point: namely, how one might go about fitting your preferred share recommendations into an overall fixed income allocation, even if the guidance is only general and lists only a collection of bond ETFs you think are potentially sensible for this purpose. Regardless, the publication is excellent.
Some people lost their accounts during the horrific server migration in December. *sigh* They may re-register, or get me to do it.
Anyway, the first problem in looking at this is that the main page for the First Asset DEX 1-5 Year Laddered Government Strip Bond Index ETF states that:
The First Asset ETF has been designed to replicate, to the extent possible, the performance of a Canadian 1-5 year laddered government strip bond index, net of expenses. The current index is the DEX 1-5 Year Laddered Government Strip Bond Index … More information on the Index is available at the Index Provider’s website at www.canadianbondindices.com
… and the index is not mentioned on the TMX Debt Market Methodolgies page. It’s just the banks’ way of reminding us that they’re important bankers and we’re just ignorant customer scum. Ha-ha! Where else ya gonna go, suckers? Can you spell “monopoly”? However, somebody has inadvertently left a link to the methodology on the CANADIAN DEBT MARKET INDICES page, so we can look at that.
According to the DEX 1-5 year Laddered Government Strip Bond Index Methodology:
a Government only laddered index structure, in CDN$, selected from the constituents of the DEX Strip Bond Index (please refer to the DEX Strip Bond Index Methodology for qualification criteria)
– Laddered into 5 term buckets (1-1.99 yrs, 2-2.99 yrs, 3-3.99 yrs, 4-4.99 yrs, 5-5.99 yrs)
– Index constituents are rebalanced annually, each June 30 (or the last business day of June)
– Bonds will roll out to the next lower bucket on the rebalance date
– Bonds with < 1 year to maturity will roll out of the first bucket on the rebalance date at the mid market
closing level on rebalance date
– Index will re-invest the full market value of all roll out securities into the longest bucket at full units
- Inception Date is June 29, 2012
– 5 bonds are selected for each term bucket (25 in total) in the following proportion:
- 1 Government of Canada (or Government of Canada Agency) Bond
- 4 Provincial Bond (including provincial guarantees)
- Substitutions may be required where no Government of Canada or Agency Bond exists.
– Minimum issue size 50MM
– Select the most liquid in the bucket (as ranked by trailing 12 month average daily dollar volume traded)
They don’t say how they’re computing the “trailing 12 month average daily dollar volume traded”, but I assume it’s from data “provided by [the bank-owned] CDS (Canadian Depository for Securities) for the Canadian Strip marketplace.” as is the case with the Canadian Strip Bond Index. Compete with that, sucker! I feel certain that you, too, can buy such data from CDS at ever-so-reasonable prices.
With respect to distributions, according to the prospectus:
With respect to Strip Bonds, the First Asset ETF will generally be required to include annually in income notional interest deemed to have accrued on the Strip Bonds from the date of purchase, notwithstanding the fact that there is no entitlement to interest payable under the Strip Bonds.
OK, so all this is fair enough. How is it valued?
The value of any bond will be the price provided by FTSE TMX Global Debt Capital Markets Inc. (formerly “PC-Bond” a business unit of TSX Inc). FTSE TMX Global Debt Capital Markets Inc. will determine the price from quotes received from one or more dealers in the applicable bond, selected for this purpose by FTSE TMX Global Debt Capital Markets Inc.
So it looks like that the issues will be valued as strips. While this makes eminent sense, it should be noted that strips are expensive; pricing and yield information is difficult to get ahold of on their website (which is alarming in and of itself) but we can get some information from the December 31, 2013 Financial Statements.
They are, for instance, holding 195M PV of Canada Strips 2015-12-1, valued at $190,543. This means the price is 97.7144, with a term of 1.918 years. That’s an IRR of 1.213%, bond-equivalent-yield of 1.209%. A Two-Year Canada was yielding 1.13% about then.
Repeating all these calculations, very laboriously I might say, results in the calculation that (as of 2013-12-31) the portfolio was yielding 1.79% with a duration of just over three years. It was about 20% federal, 40% Ontario and 40% Quebec. Three year Canadas were about 1.21%. I don’t know about then, but now three year Ontario and Quebec bonds are both trading about 30bp over three year Canadas, So all in all, it looks like the pricing is fair, but you’re still paying strip prices for this stuff.
Strips are expensive and provincials are expensive (due to liquidity) and Canadas are very expensive (due to liquidity). I never recommend anybody ever buy Canadas, because the liquidity premium is grotesque.
Given that what you want is short-duration bonds to counterbalance the long duration of your preferred share portfolio, I would suggest buying short-term provincial bonds instead of strips (because strips are so expensive) and – if your portfolio is of sufficient size – buy short corporates in prudent size as they become available. Current coupon issues only, of course; and remember, in an RRSP it doesn’t matter so you can buy an ETF or fund in a registered plan without worrying about the coupon.
Here’s how business gets done:
A German water utility alleged a former UBS AG (UBSN) banker had an “inappropriate” relationship with consultants advising on disputed swap deals, the latest lawsuit to highlight how complex financial instruments backfired on municipal agencies during the 2008 financial crisis.
Kommunale Wasserwerke Leipzig GmbH said in court documents that Steven Bracy, the banker at the center of the allegations, booked strippers for consultants at Swiss firm Value Partners and went on an African safari with them. That happened even as he was supposed to be advising KWL on its derivative transactions with UBS.
KWL made the allegations in its response to a lawsuit filed by UBS, in which the bank is seeking $138 million under so-called credit protection agreements from 2006 and 2007. The utility argues in court documents that the close relationship between the bank and the consultants creates a conflict of interest that invalidates the deal. Bracy is scheduled to testify at the trial in London today.
…
Bracy, then a UBS employee, “appears” to have asked another man in 2006 to arrange for four strippers to be paid $5,600 each, KWL said in court documents. Later that year, Value Partners invited Bracy and another UBS employee to go on a “luxury safari” in South Africa to discuss a partnership.
…
A lawyer for UBS, Charles Falconer, told the court in April that written agreements show Value Partners was advising KWL on the transaction.
“There was never any doubt in anyone’s mind that Value Partners were acting for KWL,” he said. “Attempts by Value Partners during the course of the transactions to blur the line were rebuffed by UBS.”
Falconer said UBS didn’t force KWL to accept the deal and any blame was with the water supplier and its former managing director, Klaus Heininger. Heininger was convicted by a German court of accepting more than $3 million in bribes from Blatz and Senf beginning in 2005.
…
The strippers and safari weren’t the only gifts allegedly exchanged between UBS and Value Partners. The bank gave tickets to the World Cup soccer quarter-finals in Berlin in 2006 to Blatz and another person at Value Partners, and watches and suitcases to Blatz and Senf later that year, the bank said in court documents. The bank says the gifts were “normal” in the industry, unsolicited, too minor to breach fiduciary duties and not given surreptitiously.
The only thing I find surprising about this is that the strippers did so well. What did they have to do to earn $5,600 each?
Every now and then there’s a story decrying cybersecurity as a military boondoggle:
It’s a threat the government deems serious enough to hire more than 10,000 “cyber warriors” in the near future, according to the Cyber Security Challenge, a public-private contest created to hire the next generation of cybersecurity experts.
And it’s a focus that already consumes billions of dollars in taxpayer dollars each year.
In 2011, the federal government spent over $13 billion on cybersecurity, all but $3 billion of that from the Department of Defense, according to a recent report by the DOD’s Cyber Threat Task Force.
“There has been very little analysis as to the cost or expected benefits for any regulation pertaining to cybersecurity,” said James Gattuso, a senior research fellow at the Heritage Foundation, a nonprofit conservative think tank in Washington, D.C. “It’s admittedly a very difficult thing to measure.”
… and every now and then there’s a story about the lack of cybersecurity:
It shouldn’t be easy to shut down a European ministry for days, depriving bureaucrats of access to e-mail and the web. Someone, however, has managed to do just that to Belgium’s foreign ministry, which had to quarantine its entire computer system last Saturday and only managed to restore the work of the passport and visa processing systems on Thursday. Similar attacks seem to be taking place elsewhere in Europe, as Belgian Foreign Minister Didier Reynders told the Belga news agency after meeting with a senior French diplomat that “everyone (on the European level) notes at this moment a very powerful pickup in hacking activity probably coming from the east and in any case having to do with Ukraine.”
…
Given the attack target’s clout and resources, one would have expected the U.S. and its NATO allies to thoroughly study and block the malware. That didn’t happen. Defense conglomerate BAE Systems wrote in a recent report that “the operation behind the attacks has continued with little modification to the tools and techniques, in spite of the widespread attention a few years ago.”
… and every now and then there’s some actual sabre rattling:
The U.S. dramatically escalated its battle to curb China’s technology theft from American companies by accusing five Chinese military officials of stealing trade secrets, casting the hacker attacks as a direct economic threat.
The indictment effectively accuses China and its government of a vast effort to mine U.S. technology through cyber-espionage, stealing jobs as well as the innovation on which the success of major global companies like United States Steel Corp. (X) and Alcoa Corp. (AA) depends.
…
Those indicted were officers in Unit 61398 of the Third Department of the Chinese People’s Liberation Army. The Justice Department identified them as Wang Dong, Sun Kailiang, Wen Xinyu, Huang Zhenyu and Gu Chunhui.
In one of the cases, the Justice Department said Sun stole proprietary technical and design specifications for piping from Westinghouse, the nuclear reactor arm of Toshiba Corp. (6502), as the company was building four power plants in China and negotiating other business ventures with state-owned enterprises.
In another instance, Wang and Sun hacked into U.S. Steel computers as the company was participating in trade cases, according to the department’s statement.
… which results in more sabre rattling:
China is lashing out at the United States as a cybersecurity “hypocrite” after U.S. authorities indicted Chinese military officers with hacking into the systems of corporations.
China’s foreign ministry spokesman, Hong Lei, accused the U.S. on Tuesday of damaging already-fragile relations between Beijing and Washington. On Monday Beijing summoned the U.S. Ambassador to China to voice its complaints and pulled out of a joint cybersecurity working group, saying the U.S. must “correct its mistake and withdraw its indictment.”
A lot of long bonds are being issued globally:
Global borrowers from Shell in The Hague to Peoria, Illinois-based Caterpillar Inc. (CAT) raised a record $368 billion this year from bonds maturing in 10 years or more, according to data compiled by Bloomberg. The average yield companies pay to raise long-dated debt worldwide fell 61 basis points this year to 4.4 percent, approaching the low of 4.1 percent reached in 2013, Bank of America Merrill Lynch data show
…
The average maturity of global company notes has climbed to 8.5 years, compared with 8.1 years over the past decade, Bank of America Merrill Lynch data show.
OK, I want everybody to go to the TMX website. In the bottom left hand corner will be a little orange “Suggest an idea box”. Click that. Suggest something, or not. Your choice. But then go to the voting and feedback page (you might be able to do this directly. I’m not sure how their cookies work).
I have suggested the following:
Report Closing Quotes
You currently report Last quotations (as of 4:30pm) rather than Closing quotations (as of 4:00pm).
This is ridiculous. The extended session isn’t even an active market, as defined by the accounting profession.
I suspect that your use of Last quotations is a holdover from days prior to the extended session, and results solely from an oversight, since Last quotations have meaning only insofar as they reflect the Closing quotation.
You have ten votes and are allowed to place three of them with any one idea. I want three of your votes for this. For more information on this issue, see TMX DataLinx: “Last” != “Close” and More on the TMX Close != Last. This issue has been driving me nuts for over three years now.
Other ideas that got my support were:
provide real time quotes
It’s time for this – why not make a bold move a jump to the head of the line?
This doesn’t have a hope in hell, since selling real time quotes is extremely lucrative, but it’s a nice thought.
Provide alerts when a company changes their symbol and provide the new symbol is
This would be useful.
There was another about providing the net change rather than the gross price change on an ex-dividend day, but I can’t find it on the site now.
It was a mixed day for the Canadian preferred share market, with PerpetualDiscounts down 19bp, FixedResets gaining 2bp and DeemedRetractibles off 5bp. Volatility was average. Volume was extremely light.
HIMIPref™ Preferred Indices
These values reflect the December 2008 revision of the HIMIPref™ Indices
Values are provisional and are finalized monthly |
| Index |
Mean
Current
Yield
(at bid) |
Median
YTW |
Median
Average
Trading
Value |
Median
Mod Dur
(YTW) |
Issues |
Day’s Perf. |
Index Value |
| Ratchet |
0.00 % |
0.00 % |
0 |
0.00 |
0 |
-0.0702 % |
2,470.6 |
| FixedFloater |
4.51 % |
3.75 % |
33,047 |
17.90 |
1 |
0.4773 % |
3,804.6 |
| Floater |
2.95 % |
3.08 % |
51,010 |
19.48 |
4 |
-0.0702 % |
2,667.6 |
| OpRet |
4.38 % |
-8.90 % |
34,606 |
0.12 |
2 |
0.0389 % |
2,712.7 |
| SplitShare |
4.81 % |
4.10 % |
63,995 |
4.19 |
5 |
0.2676 % |
3,108.2 |
| Interest-Bearing |
0.00 % |
0.00 % |
0 |
0.00 |
0 |
0.0389 % |
2,480.4 |
| Perpetual-Premium |
5.51 % |
-9.94 % |
97,754 |
0.09 |
15 |
0.0391 % |
2,405.7 |
| Perpetual-Discount |
5.31 % |
5.34 % |
111,455 |
14.90 |
21 |
-0.1920 % |
2,542.0 |
| FixedReset |
4.53 % |
3.40 % |
201,907 |
4.33 |
75 |
0.0214 % |
2,558.4 |
| Deemed-Retractible |
4.98 % |
-3.68 % |
144,596 |
0.10 |
42 |
-0.0493 % |
2,525.2 |
| FloatingReset |
2.66 % |
2.33 % |
163,223 |
4.03 |
6 |
0.0594 % |
2,494.9 |
| Performance Highlights |
| Issue |
Index |
Change |
Notes |
| GWO.PR.R |
Deemed-Retractible |
-1.27 % |
YTW SCENARIO
Maturity Type : Hard Maturity
Maturity Date : 2025-01-31
Maturity Price : 25.00
Evaluated at bid price : 23.35
Bid-YTW : 5.75 % |
| FTS.PR.J |
Perpetual-Discount |
-1.23 % |
YTW SCENARIO
Maturity Type : Limit Maturity
Maturity Date : 2044-05-20
Maturity Price : 23.00
Evaluated at bid price : 23.30
Bid-YTW : 5.10 % |
| MFC.PR.F |
FixedReset |
1.36 % |
YTW SCENARIO
Maturity Type : Hard Maturity
Maturity Date : 2025-01-31
Maturity Price : 25.00
Evaluated at bid price : 23.92
Bid-YTW : 3.69 % |
| SLF.PR.G |
FixedReset |
1.73 % |
YTW SCENARIO
Maturity Type : Hard Maturity
Maturity Date : 2025-01-31
Maturity Price : 25.00
Evaluated at bid price : 23.50
Bid-YTW : 3.89 % |
| Volume Highlights |
| Issue |
Index |
Shares
Traded |
Notes |
| BMO.PR.S |
FixedReset |
132,690 |
Recent new issue.
YTW SCENARIO
Maturity Type : Call
Maturity Date : 2019-05-25
Maturity Price : 25.00
Evaluated at bid price : 25.50
Bid-YTW : 3.64 % |
| MFC.PR.D |
FixedReset |
99,831 |
Called for redemption.
YTW SCENARIO
Maturity Type : Call
Maturity Date : 2014-06-19
Maturity Price : 25.00
Evaluated at bid price : 24.97
Bid-YTW : 1.47 % |
| ENB.PF.A |
FixedReset |
27,390 |
YTW SCENARIO
Maturity Type : Limit Maturity
Maturity Date : 2044-05-20
Maturity Price : 23.16
Evaluated at bid price : 25.08
Bid-YTW : 4.14 % |
| NA.PR.S |
FixedReset |
26,506 |
YTW SCENARIO
Maturity Type : Call
Maturity Date : 2019-05-15
Maturity Price : 25.00
Evaluated at bid price : 25.57
Bid-YTW : 3.62 % |
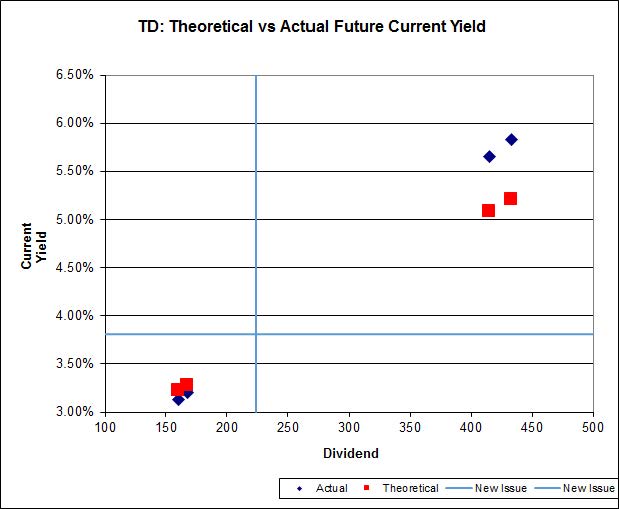
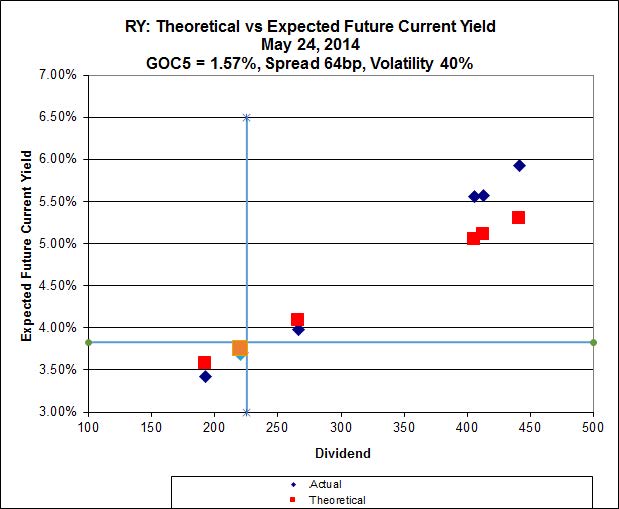
| RY.PR.Z |
FixedReset |
26,198 |
YTW SCENARIO
Maturity Type : Call
Maturity Date : 2019-05-24
Maturity Price : 25.00
Evaluated at bid price : 25.60
Bid-YTW : 3.48 % |
| TRP.PR.D |
FixedReset |
23,330 |
YTW SCENARIO
Maturity Type : Limit Maturity
Maturity Date : 2044-05-20
Maturity Price : 23.17
Evaluated at bid price : 25.00
Bid-YTW : 3.85 % |
| There were 13 other index-included issues trading in excess of 10,000 shares. |
| Wide Spread Highlights |
| Issue |
Index |
Quote Data and Yield Notes |
| MFC.PR.A |
OpRet |
Quote: 25.53 – 26.24
Spot Rate : 0.7100
Average : 0.4495
YTW SCENARIO
Maturity Type : Call
Maturity Date : 2014-06-19
Maturity Price : 25.25
Evaluated at bid price : 25.53
Bid-YTW : -12.99 % |
| FTS.PR.J |
Perpetual-Discount |
Quote: 23.30 – 23.73
Spot Rate : 0.4300
Average : 0.2931
YTW SCENARIO
Maturity Type : Limit Maturity
Maturity Date : 2044-05-20
Maturity Price : 23.00
Evaluated at bid price : 23.30
Bid-YTW : 5.10 % |
| IAG.PR.A |
Deemed-Retractible |
Quote: 23.10 – 23.51
Spot Rate : 0.4100
Average : 0.2906
YTW SCENARIO
Maturity Type : Hard Maturity
Maturity Date : 2025-01-31
Maturity Price : 25.00
Evaluated at bid price : 23.10
Bid-YTW : 5.67 % |
| CU.PR.D |
Perpetual-Discount |
Quote: 24.15 – 24.48
Spot Rate : 0.3300
Average : 0.2432
YTW SCENARIO
Maturity Type : Limit Maturity
Maturity Date : 2044-05-20
Maturity Price : 23.77
Evaluated at bid price : 24.15
Bid-YTW : 5.07 % |
| GWO.PR.R |
Deemed-Retractible |
Quote: 23.35 – 23.60
Spot Rate : 0.2500
Average : 0.1829
YTW SCENARIO
Maturity Type : Hard Maturity
Maturity Date : 2025-01-31
Maturity Price : 25.00
Evaluated at bid price : 23.35
Bid-YTW : 5.75 % |
| BAM.PR.B |
Floater |
Quote: 17.06 – 17.27
Spot Rate : 0.2100
Average : 0.1444
YTW SCENARIO
Maturity Type : Limit Maturity
Maturity Date : 2044-05-20
Maturity Price : 17.06
Evaluated at bid price : 17.06
Bid-YTW : 3.10 % |