Month: May 2014

Market Action

May 6, 2014

The scheduled European hyperinflation has been postponed:

Lower inflation forecasts from the European Commission will put more pressure on the European Central Bank to launch measures to prevent falling prices from destabilizing the weak economic revival.

The EC, the executive arm of the 28-country European Union, predicted on Monday morning that euro zone’s inflation rate will land at 0.8 per cent this year and 1.2 per cent next year. Both figures are well below the ECB’s target rate of close to 2 per cent Less than three months ago, the EC had forecast inflation this year at 1 per cent, and at 1.5 per cent next year. The downward revisions came as more evidence emerged that the euro zone’s deflationary pressures are still fully intact, in spite of rock-bottom interest rates, the end of the euro zone’s recession and slightly lower jobless figures.

So there’s one reason to be bond-bullish. But it takes two to make a market!

Junk-bond investors are accepting yields that are 0.74 percentage point lower than the earnings yield on the Standard & Poor’s 500 index, a measure of profit as a percentage of equity prices.

Historically, debt rated below investment grade has yielded an average 4.2 percentage points more than stocks since March 1995. That relationship has been turned on its head.

Could be a little ‘reaching for yield’ is going on. That always ends in tears.

Meanwhile the feds continue to micro-manage the Canadian economy:

The Conservative government’s bid to ease a multibillion-dollar backlog of Prairie grain is one step closer to becoming law, despite ongoing questions about its details and complaints by Canada’s two major railways.

Bill C-30 was tabled March 26 in an urgent bid to force railways to ship more grain after a bumper crop, and passed third reading in the House of Commons on Monday. That came after a weeks-long delay caused by a complaint over a government error, whereby a committee went too far in altering the bill by adding an amendment the Speaker ruled was out of bounds.

Bill C-30 is aimed at easing a backlog by expanding government power to set minimum shipping levels for railways. It also expands grain sellers’ power to choose a different railway – many had just one choice – and creates a new process for the Canadian Transportation Agency (CTA) to force a railway that fails to hold up its end of a deal to repay certain costs to grain shippers.

I was a little puzzled by the “many had just one choice” part. Apparently:

In most cases, shippers’ grain elevators have nearby access to only one of the two major Canadian railways. And by law, they may not transfer grain to the other railroad unless the elevator is within 30 kilometres of them. Yes, that’s anti-competitive. The bill would raise that limit to 160 km, giving more choice to growers and shippers.

The origins of these regulations on “interswitching” go back to 1904. It’s a relic of the long history of heavy-handed government power over grain and railroads, which included fixed freight rates.

Sounds like a pretty crazy law to me. To at least some extent it’s just another form of protectionism:

“A 160 km interchange limit would open up the southern portion of CNR and CP’s network to competition from U.S. carriers, especially BNSF,” [RBC Capital Markets analyst Walter] Spracklin said in a note to clients.

Mr. Spracklin noted that unlike market share shifts between Canadian railways that might also result from the interswitching rule changes, the market share losses to U.S. competitors would be more permanent because there are no reciprocal interchange provisions in the U.S.

“Accordingly, cargo losses to U.S. carriers would disappear from the Canadian supply chain altogether weakening all stakeholders’ positions (ports, trucks, etc),” Mr. Spracklin said.

But he said market share losses are not the only issue that might result from the new rules. They also threaten to raise costs for Canadian railways by introducing added complexity to their networks and may require extra infrastructure to be added.

The carriers hate the change:

CN said amended interswitching rules would allow U.S. railroads to poach Canadian rail traffic, erode the rate structure and economic viability of Canadian railways and drive traffic to U.S. ports, thus reducing traffic and employment at Canadian ports.


In a March 28 news release, Canadian Pacific Railway said it was disappointed with Ottawa’s decision to introduce legislation that does nothing to improve grain movement but has the potential to cause “great damage” to the Canadian rail transportation system.


“CP … believes that the expansion of regulated interswitching could seriously impact Canada’s competitiveness, as it effectively transfers traffic that normally would move over Canadian railways and ports to U.S. railroads and ports,” it said.


“Interswitching will also lead to double handling of grain shipments, which will slow down the grain supply chain, negatively impacting transit times.”


Federal officials say there are 18 interswitch locations on the Canadian Prairies.


Only 14 primary elevators in Western Canada are affected by interswitching under the current 30 km provisions.


Increasing the interswitch distance to 160 km would give 150 elevators potential access to service by more than one railway, including U.S. railways.

I’m prepared to listen, but it seems to me that in situations in which ‘natural monopoly’ conditions exist – such as railways, telecommunications and pipelines – interswitching should be mandatory, but at premium rates (so that, for instance, somebody who built a network and rented it out in toto could make a very good profit on the deal).

Of course, such mandatory carriage has its detractors:

While economic theory suggests that more competition always benefits the consumer, that may not be true in Canada’s telecom industry, where concentration in the hands of BCE, Rogers and Telus is good for customers, argue authors Martin Masse and Paul Beaudry in a 60-page report released Tuesday.

“It may be preferable for financial resources … to be concentrated in the hands of a few strong players willing to invest in new technologies and services rather than scattered among several small and feeble competitors trying to survive by selling at prices barely above marginal costs,” the report said.

The government, it added, has “lost sight of the ultimate goal of promoting the development of a dynamic, efficient industry.”

For example, Ottawa should drop all remaining foreign ownership restrictions, including in broadcasting, as well as allow the transfer of existing wireless spectrum licenses, the authors said. Even the threat that a major foreign player entering Canada would lead to better service, Mr. Masse said.

The government should also “gradually abandon” so-called mandatory access policies, which allow new entrants to piggy-back on the networks of established players at favourable rates.

I’m all in favour of dropping all remaining foreign ownership restrictions!

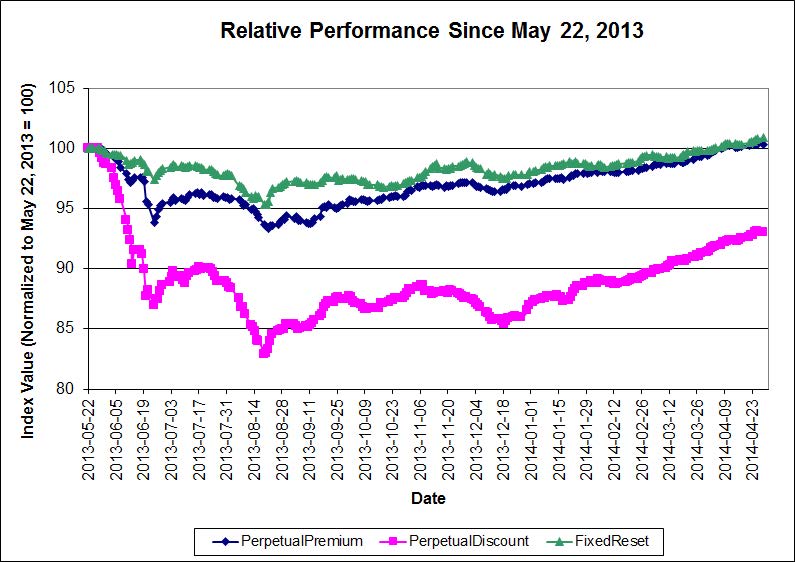
It was another (slightly!) positive day for the Canadian preferred share market, with PerpetualDiscounts gaining 2bp, FixedResets winning 11bp and DeemedRetractibles up 3bp. The Performance Highlights table is lengthy again, with a few losses indicating that some of the recent gains are considered to be out of whack; FixedResets dominated the winners. Volume was quite high.

HIMIPref™ Preferred Indices
These values reflect the December 2008 revision of the HIMIPref™ Indices

Values are provisional and are finalized monthly
Index Mean
Current
Yield
(at bid)
Median
YTW
Median
Average
Trading
Value
Median
Mod Dur
(YTW)
Issues Day’s Perf. Index Value
Ratchet 0.00 % 0.00 % 0 0.00 0 0.2449 % 2,416.1
FixedFloater 4.59 % 3.82 % 30,666 17.81 1 0.7299 % 3,741.3
Floater 3.02 % 3.17 % 53,500 19.28 4 0.2449 % 2,608.7
OpRet 4.34 % -2.09 % 33,697 0.15 2 0.0580 % 2,703.6
SplitShare 4.79 % 4.38 % 62,701 4.18 5 -0.0158 % 3,096.2
Interest-Bearing 0.00 % 0.00 % 0 0.00 0 0.0580 % 2,472.2
Perpetual-Premium 5.51 % -9.60 % 97,017 0.09 15 0.0914 % 2,401.0
Perpetual-Discount 5.29 % 5.34 % 119,890 14.93 21 0.0222 % 2,542.0
FixedReset 4.50 % 3.32 % 210,334 4.14 75 0.1130 % 2,570.0
Deemed-Retractible 4.97 % -5.69 % 138,328 0.14 42 0.0293 % 2,528.5
FloatingReset 2.67 % 2.30 % 135,928 4.21 6 0.0066 % 2,497.2
Performance Highlights
Issue Index Change Notes
TRP.PR.A FixedReset -1.44 % YTW SCENARIO
Maturity Type : Limit Maturity
Maturity Date : 2044-05-06
Maturity Price : 23.33
Evaluated at bid price : 24.01
Bid-YTW : 3.72 %
PWF.PR.P FixedReset -1.18 % YTW SCENARIO
Maturity Type : Limit Maturity
Maturity Date : 2044-05-06
Maturity Price : 23.98
Evaluated at bid price : 24.31
Bid-YTW : 3.43 %
FTS.PR.F Perpetual-Discount -1.10 % YTW SCENARIO
Maturity Type : Limit Maturity
Maturity Date : 2044-05-06
Maturity Price : 24.01
Evaluated at bid price : 24.31
Bid-YTW : 5.11 %
CU.PR.E Perpetual-Discount 1.06 % YTW SCENARIO
Maturity Type : Limit Maturity
Maturity Date : 2044-05-06
Maturity Price : 24.40
Evaluated at bid price : 24.81
Bid-YTW : 5.00 %
BAM.PR.Z FixedReset 1.45 % YTW SCENARIO
Maturity Type : Call
Maturity Date : 2017-12-31
Maturity Price : 25.00
Evaluated at bid price : 26.64
Bid-YTW : 3.04 %
GWO.PR.N FixedReset 1.46 % YTW SCENARIO
Maturity Type : Hard Maturity
Maturity Date : 2025-01-31
Maturity Price : 25.00
Evaluated at bid price : 23.59
Bid-YTW : 3.75 %
SLF.PR.G FixedReset 1.54 % YTW SCENARIO
Maturity Type : Hard Maturity
Maturity Date : 2025-01-31
Maturity Price : 25.00
Evaluated at bid price : 23.71
Bid-YTW : 3.84 %
BAM.PR.X FixedReset 1.59 % YTW SCENARIO
Maturity Type : Limit Maturity
Maturity Date : 2044-05-06
Maturity Price : 22.04
Evaluated at bid price : 22.42
Bid-YTW : 4.06 %
Volume Highlights
Issue Index Shares
Traded
Notes
SLF.PR.F FixedReset 450,280 TD crossed two blocks of 225,000 each, both at 25.34.
YTW SCENARIO
Maturity Type : Call
Maturity Date : 2014-06-30
Maturity Price : 25.00
Evaluated at bid price : 25.33
Bid-YTW : 1.04 %
BNS.PR.P FixedReset 118,819 RBC crossed 113,700 at 25.50.
YTW SCENARIO
Maturity Type : Call
Maturity Date : 2018-04-25
Maturity Price : 25.00
Evaluated at bid price : 25.50
Bid-YTW : 2.84 %
MFC.PR.A OpRet 111,793 RBC crossed 107,200 at 25.90.
YTW SCENARIO
Maturity Type : Call
Maturity Date : 2014-06-19
Maturity Price : 25.25
Evaluated at bid price : 25.80
Bid-YTW : -9.22 %
BNS.PR.Z FixedReset 100,461 Scotia bought 20,100 from RBC at 24.75 and crossed 10,800 at 24.80.
YTW SCENARIO
Maturity Type : Hard Maturity
Maturity Date : 2022-01-31
Maturity Price : 25.00
Evaluated at bid price : 24.76
Bid-YTW : 3.32 %
MFC.PR.D FixedReset 91,954 RBC crossed 78,000 at 25.40.
YTW SCENARIO
Maturity Type : Call
Maturity Date : 2014-06-19
Maturity Price : 25.00
Evaluated at bid price : 25.41
Bid-YTW : 0.18 %
ENB.PR.B FixedReset 62,798 TD crossed 50,000 at 25.32.
YTW SCENARIO
Maturity Type : Call
Maturity Date : 2017-06-01
Maturity Price : 25.00
Evaluated at bid price : 25.32
Bid-YTW : 3.82 %
There were 50 other index-included issues trading in excess of 10,000 shares.
Wide Spread Highlights
Issue Index Quote Data and Yield Notes
MFC.PR.I FixedReset Quote: 26.31 – 26.75
Spot Rate : 0.4400
Average : 0.2482

YTW SCENARIO
Maturity Type : Call
Maturity Date : 2017-09-19
Maturity Price : 25.00
Evaluated at bid price : 26.31
Bid-YTW : 2.95 %

PWF.PR.G Perpetual-Premium Quote: 25.50 – 25.94
Spot Rate : 0.4400
Average : 0.2529

YTW SCENARIO
Maturity Type : Call
Maturity Date : 2014-06-05
Maturity Price : 25.00
Evaluated at bid price : 25.50
Bid-YTW : -16.34 %

MFC.PR.J FixedReset Quote: 25.98 – 26.43
Spot Rate : 0.4500
Average : 0.2844

YTW SCENARIO
Maturity Type : Call
Maturity Date : 2018-03-19
Maturity Price : 25.00
Evaluated at bid price : 25.98
Bid-YTW : 3.07 %

IFC.PR.C FixedReset Quote: 26.06 – 26.43
Spot Rate : 0.3700
Average : 0.2419

YTW SCENARIO
Maturity Type : Call
Maturity Date : 2016-09-30
Maturity Price : 25.00
Evaluated at bid price : 26.06
Bid-YTW : 2.56 %

TD.PR.Q Deemed-Retractible Quote: 26.50 – 26.84
Spot Rate : 0.3400
Average : 0.2316

YTW SCENARIO
Maturity Type : Call
Maturity Date : 2014-06-05
Maturity Price : 25.75
Evaluated at bid price : 26.50
Bid-YTW : -26.52 %

RY.PR.A Deemed-Retractible Quote: 25.75 – 26.03
Spot Rate : 0.2800
Average : 0.1874

YTW SCENARIO
Maturity Type : Call
Maturity Date : 2014-06-23
Maturity Price : 25.25
Evaluated at bid price : 25.75
Bid-YTW : -11.81 %

Market Action

May 5, 2014

Interesting cat-fight in CRA-land:

Standard & Poor’s underestimated the risk of mortgage-backed securities it had planned to rate before the deal was postponed, according to competitor Fitch Ratings.

S&P’s preliminary rankings, which were pulled yesterday after the issuer said it would delay the sale, relied on optimistic home values, Fitch said today in a report. S&P said in a statement yesterday it had asked for more information from issuer Bayview Asset Management LLC after releasing the planned grades as the deal started to be marketed.

Based on the property-price estimates of realty brokers instead of the computer models relied on by S&P, Fitch said the loans exceed current home values by more than 45 percent. That would increase projections for defaults by about 20 percent and the size of losses after foreclosures by 30 percent, Fitch said in its statement.

The $184.9 million transaction, called Bayview Opportunity Master Fund IIIa Trust 2014-9RPL, would be the first sale since the financial crisis of publicly rated securities backed by once-delinquent mortgages, according to Fitch. Similar deals without credit grades have been completed as recently as July 2013, GlobalCapital reported April 28 on its website.

Ed Sweeney, a spokesman for S&P, declined to comment. S&P said in a statement yesterday that Bayview sought to delay the sale after the ratings company requested more information about property valuations and loss severities.

Supply and demand? Schmupply and Schmemand! The best way to lower long term interest rates is to change the rules:

In a world awash with U.S. government bonds, buyers of the longest-term Treasuries are facing a potential shortage of supply.

Excluding those held by the Federal Reserve, Treasuries due in 10 years or more account for just 5 percent of the $12.1 trillion market for U.S. debt. New rules designed to plug shortfalls at pension funds may now triple their purchases of longer-dated Treasuries, creating $300 billion in extra demand over the next two years that would equal almost half the $642 billion outstanding, Bank of Nova Scotia estimates.

Fewer available bonds, along with a lack of inflation and increased foreign buying, help to explain why longer-term Treasuries are surging this year even as the Fed pares its own bond purchases. The demand has pushed down yields on 30-year government debt by more than a half-percentage point to 3.37 percent, the most since 2000, data compiled by Bloomberg show.

Pensions that closed deficits are pouring into Treasuries and exiting stocks to reduce volatility after a provision in the Budget Act of 2013 raised the amount underfunded plans are required to pay in insurance premiums over the next two years. It also imposed stiffer fees on those with shortfalls.

In the next 12 months alone, buying from private pensions will create $150 billion in demand for longer-maturity Treasuries, based on Bank of Nova Scotia’s estimates. That compares with the $40 billion in all maturities of U.S. government debt that the plans bought last year.

There’s a little good news out of CMHC:

The Canada Mortgage and Housing Agency said on Monday that it expects the amount of insurance in force to continue to decline in 2014 to $545-billion, down 2.2 per cent from $557-billion in 2013 and 3.9 per cent from a high of $567-billion in 2011, at the height of the post-recession housing expansion.

CMHC senior vice-president Steven Mennill said the decline was part of a normal repayment pattern and comes as the agency trims the value of new insurance it is prepared to write on the mortgages Canada’s lenders – mostly the nation’s biggest banks – offer to home buyers trying to get into the booming market.

“One of the factors that is important in this is we have reduced the total amount of portfolio insurance that we are prepared to underwrite in any given year – the insurance provided to lenders on a post-facto basis for portfolio, low-ratio loans – from $11-billion to $9-billion, in 2014,” Mennill told reporters on a conference call.

It’s not much of a cut, but it’s a start.

One of the great tensions in regulation right now is the role of underwriters in IPOs. Are they there so they can get a good deal for their beloved clients? Or are they just thinking – When then ducks quack, feed them?:

Wall Street is in business to make money; when investors want to buy something (such as an initial public offering), that something is offered for sale. It doesn’t make any difference if Wall Street knows in its heart of hearts that that something (such as an IPO) is overpriced.

“When the ducks quack, feed them” is a Wall Street proverb cited in print from at least 1991. The adage became especially popular with internet IPOs in the 1990s.

I hadn’t heard that one before, but the principle should be obvious – but, of course, some don’t get it.

Along those lines, Barry Richoltz of Bloomberg argues for a Treasury Fifty:

4. The U.S. now funds long-term obligations with shorter-term financing. If we learned anything during the credit crisis, this is a recipe for disaster. Bringing the length of financing into closer alignment with our obligations simply is good financial stewardship.

5. The private sector is showing the way: Fixed-income investors have been lining up to purchase 30-year bonds from Bank of America, Apple, IBM, General Electric, Wal-Mart, Novartis, Pemex and others. Financial firms such as Morgan Stanley and JPMorgan Chase have been issuing perpetual notes with a fixed rate for 10 years, which then become Libor-plus bonds.

I’m pleased to see that a milestone has been reached on solar-powered fuel production:

Several notable research organizations from academia through to industry (ETH Zürich, Bauhaus Luftfahrt, Deutsches Zentrum für Luft- und Raumfahrt (DLR), ARTTIC and Shell Global Solutions) have explored a thermochemical pathway driven by concentrated solar energy. A new solar reactor technology has been pioneered to produce liquid hydrocarbon fuels suitable for more sustainable transportation.

“Increasing environmental and supply security issues are leading the aviation sector to seek alternative fuels which can be used interchangeably with today’s jet fuel, so-called drop-in solutions”, states Dr. Andreas Sizmann, the project coordinator at Bauhaus Luftfahrt. “With this first-ever proof-of-concept for ‘solar’ kerosene, the SOLAR-JET project has made a major step towards truly sustainable fuels with virtually unlimited feedstocks in the future.

The SOLAR-JET project demonstrated an innovative process technology using concentrated sunlight to convert carbon dioxide and water to a so-called synthesis gas (syngas). This is accomplished by means of a redox cycle with metal-oxide based materials at high temperatures. The syngas, a mixture of hydrogen and carbon monoxide, is finally converted into kerosene by using commercial Fischer-Tropsch technology.

I’m a bit surprised that it’s thermochemical / catalytic instead of bio-engineering / enzymatic, but hey – a step forward is a step forward!

Atlantic Power Preferred Equity preferreds (AZP.PR.A and AZP.PR.B) have had a little zip in them since Friday noon, due to a report that they have hired advisors:

  • Atlantic Power (AT) spiked to a 9.5% gain this afternoon after SparkSpread reported the power producer has hired advisers to explore a potential merger or sale.
  • Atlantic Power reportedly tapped Goldman Sachs and Greenhill to help it consider whether a sale or merger makes sense and can be negotiated.

Today the company commented:

Atlantic Power Corporation (TSX: ATP; NYSE: AT) (the “Company” or “Atlantic Power”) owns and operates a diverse fleet of power generation assets in the United States and Canada. As previously disclosed, the Company continues to focus on how to best position itself to maximize value for its shareholders. In that framework, the Company is considering the relative merits of additional debt reduction, investment in accretive growth opportunities (both internal and external), and other allocation of its available cash. Consistent with the objective of acting in the best interests of the Company, its shareholders and its other stakeholders, the Company, as also previously disclosed, is committed to evaluating a broad range of potential options. These potential options include further selected asset sales or joint ventures to raise additional capital for growth or potential debt reduction, the acquisition of assets, including in exchange for shares, the dividend level, as well as broader strategic options, including a sale or merger of the Company. The Company has engaged Goldman, Sachs & Co. and Greenhill & Co., LLC to assist the Company in its evaluation of these potential options. No assurance can be given as to how the evaluation of any such potential options may evolve. The Company does not intend to comment further on its evaluation of potential options until it otherwise deems further disclosure is appropriate or required.

Well … any of these potential options will almost certainly improve the credit quality of the preferreds, currently rated Pfd-5(high), Trend Negative by DBRS.

Innergex Renewable Energy Inc., pwoud issuer of INE.PR.A and INE.PR.C, has been confirmed at Pfd-4(high) [Stable] by DBRS:

Innergex’s financial risk profile remains weak and is reflective of a B rating range. While Innergex’s EBITDA and operating cash flow continued to increase due to sustained organic growth, DBRS remains concerned about Innergex’s aggressive financing strategy for its development pipeline, combined with the Company’s high dividend payout. As the Company continued to pursue its growth plans, the Company’s deconsolidated leverage increased to 30.5% as of December 31, 2013, from 24.5% as of December 31, 2010. Furthermore, consolidated leverage increased to 68.3% as of December 31, 2013 (from 56.7% as of December 31, 2010), and could exceed 70% over the next several years, further pressuring the balance sheet. Should the Company’s financial profile deteriorate further, this could result in negative rating action.

It was a superb day (again! But they were a long time coming!) for the Canadian preferred share market, with PerpetualDiscounts winning 35bp, FixedResets gaining 13bp and DeemedRetractibles up 30bp. A lengthy list of winners – dominated, strangely enough, by FixedResets – was marred by only one loser. Volume was average.

HIMIPref™ Preferred Indices
These values reflect the December 2008 revision of the HIMIPref™ Indices

Values are provisional and are finalized monthly
Index Mean
Current
Yield
(at bid)
Median
YTW
Median
Average
Trading
Value
Median
Mod Dur
(YTW)
Issues Day’s Perf. Index Value
Ratchet 0.00 % 0.00 % 0 0.00 0 0.2745 % 2,410.2
FixedFloater 4.62 % 3.86 % 30,458 17.75 1 -0.0972 % 3,714.2
Floater 3.03 % 3.17 % 53,215 19.27 4 0.2745 % 2,602.3
OpRet 4.35 % -2.30 % 33,359 0.16 2 0.0773 % 2,702.0
SplitShare 4.79 % 4.38 % 63,496 4.19 5 -0.0396 % 3,096.7
Interest-Bearing 0.00 % 0.00 % 0 0.00 0 0.0773 % 2,470.7
Perpetual-Premium 5.52 % -6.83 % 98,240 0.09 15 0.1726 % 2,398.8
Perpetual-Discount 5.29 % 5.29 % 119,463 14.93 21 0.3483 % 2,541.5
FixedReset 4.50 % 3.39 % 212,676 4.14 75 0.1275 % 2,567.1
Deemed-Retractible 4.97 % -3.83 % 139,024 0.14 42 0.3048 % 2,527.7
FloatingReset 2.67 % 2.31 % 193,812 4.07 6 0.0857 % 2,497.0
Performance Highlights
Issue Index Change Notes
SLF.PR.H FixedReset -1.46 % YTW SCENARIO
Maturity Type : Call
Maturity Date : 2016-09-30
Maturity Price : 25.00
Evaluated at bid price : 25.60
Bid-YTW : 3.03 %
PWF.PR.A Floater 1.03 % YTW SCENARIO
Maturity Type : Limit Maturity
Maturity Date : 2044-05-05
Maturity Price : 19.70
Evaluated at bid price : 19.70
Bid-YTW : 2.66 %
TRP.PR.A FixedReset 1.04 % YTW SCENARIO
Maturity Type : Limit Maturity
Maturity Date : 2044-05-05
Maturity Price : 23.73
Evaluated at bid price : 24.36
Bid-YTW : 3.67 %
SLF.PR.B Deemed-Retractible 1.05 % YTW SCENARIO
Maturity Type : Hard Maturity
Maturity Date : 2025-01-31
Maturity Price : 25.00
Evaluated at bid price : 23.95
Bid-YTW : 5.41 %
BAM.PR.T FixedReset 1.08 % YTW SCENARIO
Maturity Type : Limit Maturity
Maturity Date : 2044-05-05
Maturity Price : 23.49
Evaluated at bid price : 25.29
Bid-YTW : 3.90 %
POW.PR.B Perpetual-Discount 1.10 % YTW SCENARIO
Maturity Type : Limit Maturity
Maturity Date : 2044-05-05
Maturity Price : 24.64
Evaluated at bid price : 24.89
Bid-YTW : 5.42 %
BMO.PR.M FixedReset 1.14 % YTW SCENARIO
Maturity Type : Call
Maturity Date : 2018-08-25
Maturity Price : 25.00
Evaluated at bid price : 25.80
Bid-YTW : 2.57 %
MFC.PR.C Deemed-Retractible 1.15 % YTW SCENARIO
Maturity Type : Hard Maturity
Maturity Date : 2025-01-31
Maturity Price : 25.00
Evaluated at bid price : 22.83
Bid-YTW : 5.69 %
CU.PR.D Perpetual-Discount 1.19 % YTW SCENARIO
Maturity Type : Limit Maturity
Maturity Date : 2044-05-05
Maturity Price : 24.29
Evaluated at bid price : 24.70
Bid-YTW : 5.02 %
ENB.PR.Y FixedReset 1.27 % YTW SCENARIO
Maturity Type : Limit Maturity
Maturity Date : 2044-05-05
Maturity Price : 23.08
Evaluated at bid price : 24.81
Bid-YTW : 3.98 %
GWO.PR.P Deemed-Retractible 1.30 % YTW SCENARIO
Maturity Type : Call
Maturity Date : 2020-03-31
Maturity Price : 25.25
Evaluated at bid price : 25.70
Bid-YTW : 5.12 %
GWO.PR.N FixedReset 1.31 % YTW SCENARIO
Maturity Type : Hard Maturity
Maturity Date : 2025-01-31
Maturity Price : 25.00
Evaluated at bid price : 23.25
Bid-YTW : 3.91 %
W.PR.J Perpetual-Discount 1.33 % YTW SCENARIO
Maturity Type : Call
Maturity Date : 2014-06-04
Maturity Price : 25.00
Evaluated at bid price : 25.17
Bid-YTW : 1.05 %
SLF.PR.A Deemed-Retractible 1.49 % YTW SCENARIO
Maturity Type : Hard Maturity
Maturity Date : 2025-01-31
Maturity Price : 25.00
Evaluated at bid price : 23.80
Bid-YTW : 5.43 %
FTS.PR.H FixedReset 1.61 % YTW SCENARIO
Maturity Type : Limit Maturity
Maturity Date : 2044-05-05
Maturity Price : 21.66
Evaluated at bid price : 22.08
Bid-YTW : 3.59 %
MFC.PR.F FixedReset 1.70 % YTW SCENARIO
Maturity Type : Hard Maturity
Maturity Date : 2025-01-31
Maturity Price : 25.00
Evaluated at bid price : 23.95
Bid-YTW : 3.85 %
TRP.PR.C FixedReset 1.80 % YTW SCENARIO
Maturity Type : Limit Maturity
Maturity Date : 2044-05-05
Maturity Price : 22.82
Evaluated at bid price : 23.20
Bid-YTW : 3.52 %
Volume Highlights
Issue Index Shares
Traded
Notes
FTS.PR.H FixedReset 116,368 RBC bought three blocks form ITG Canada Corp (who?); two of 10,000 each and one of 13,700, all at 22.00; then crossed 50,000 at the same price.
YTW SCENARIO
Maturity Type : Limit Maturity
Maturity Date : 2044-05-05
Maturity Price : 21.66
Evaluated at bid price : 22.08
Bid-YTW : 3.59 %
BMO.PR.S FixedReset 100,001 Recent new issue.
YTW SCENARIO
Maturity Type : Call
Maturity Date : 2019-05-25
Maturity Price : 25.00
Evaluated at bid price : 25.67
Bid-YTW : 3.46 %
BNS.PR.Z FixedReset 73,857 YTW SCENARIO
Maturity Type : Hard Maturity
Maturity Date : 2022-01-31
Maturity Price : 25.00
Evaluated at bid price : 24.71
Bid-YTW : 3.35 %
POW.PR.D Perpetual-Discount 62,285 Scotia crossed blocks of 24,000 and 30,000, both at 23.80.
YTW SCENARIO
Maturity Type : Limit Maturity
Maturity Date : 2044-05-05
Maturity Price : 23.50
Evaluated at bid price : 23.80
Bid-YTW : 5.29 %
BMO.PR.R FloatingReset 59,454 Nesbitt crossed 53,000 at 25.12.
YTW SCENARIO
Maturity Type : Call
Maturity Date : 2018-08-25
Maturity Price : 25.00
Evaluated at bid price : 25.12
Bid-YTW : 2.30 %
SLF.PR.I FixedReset 53,105 RBC crossed 50,000 at 26.35.
YTW SCENARIO
Maturity Type : Call
Maturity Date : 2016-12-31
Maturity Price : 25.00
Evaluated at bid price : 26.32
Bid-YTW : 2.35 %
There were 32 other index-included issues trading in excess of 10,000 shares.
Wide Spread Highlights
Issue Index Quote Data and Yield Notes
TD.PR.Y FixedReset Quote: 25.54 – 25.95
Spot Rate : 0.4100
Average : 0.2355

YTW SCENARIO
Maturity Type : Call
Maturity Date : 2018-10-31
Maturity Price : 25.00
Evaluated at bid price : 25.54
Bid-YTW : 3.07 %

TRP.PR.B FixedReset Quote: 21.00 – 21.30
Spot Rate : 0.3000
Average : 0.1871

YTW SCENARIO
Maturity Type : Limit Maturity
Maturity Date : 2044-05-05
Maturity Price : 21.00
Evaluated at bid price : 21.00
Bid-YTW : 3.58 %

CU.PR.C FixedReset Quote: 26.22 – 26.69
Spot Rate : 0.4700
Average : 0.3905

YTW SCENARIO
Maturity Type : Call
Maturity Date : 2017-06-01
Maturity Price : 25.00
Evaluated at bid price : 26.22
Bid-YTW : 2.59 %

BAM.PR.X FixedReset Quote: 22.07 – 22.31
Spot Rate : 0.2400
Average : 0.1712

YTW SCENARIO
Maturity Type : Limit Maturity
Maturity Date : 2044-05-05
Maturity Price : 21.79
Evaluated at bid price : 22.07
Bid-YTW : 4.14 %

BNA.PR.C SplitShare Quote: 25.15 – 25.32
Spot Rate : 0.1700
Average : 0.1069

YTW SCENARIO
Maturity Type : Hard Maturity
Maturity Date : 2019-01-10
Maturity Price : 25.00
Evaluated at bid price : 25.15
Bid-YTW : 4.40 %

SLF.PR.H FixedReset Quote: 25.60 – 25.77
Spot Rate : 0.1700
Average : 0.1081

YTW SCENARIO
Maturity Type : Call
Maturity Date : 2016-09-30
Maturity Price : 25.00
Evaluated at bid price : 25.60
Bid-YTW : 3.03 %

MAPF

MAPF Performance: April, 2014

The fund outperformed the indices in April, with the help of fine performance from low-coupon Insurance DeemedRetractibles and lower-quality issues.

relPerf_140430
Click for Big

relYield_140430
Click for Big

I continue to believe that the decline in the preferred share market remains overdone; the following table shows the increase in yields since May 22 of some fixed income sectors:

Yield Changes
May 22, 2013
to
April 30, 2014
Sector Yield
May 22
Yield
April 30
Change
Five-Year Canadas 1.38% 1.67% +29bp
Long Canadas 2.57% 2.93% +36bp
Long Corporates 4.15% 4.5% +35bp
FixedResets
Investment Grade
(Interest Equivalent)
3.51% 4.60% +109bp
Perpetual-Discounts
Investment Grade
(Interest Equivalent)
6.34% 6.97% +63bp
The change in yield of PerpetualDiscounts is understated due a massive influx of issues from the PerpetualPremium sub-index over the period, which improved credit quality. When the four issues that comprised the PerpetualDiscount sub-index as of May 22, 2013 are evaluated as of April 30, 2014, the interest-equivalent yield is 7.32% and thus the change is +98bp.

ZPR, is an ETF comprised of FixedResets and Floating Rate issues and a very high proportion of junk issues, returned +1.99%, +3.64% and -0.98% over the past one-, three- and twelve-month periods, respectively (according to the fund’s data), versus returns for the TXPL index of +2.08%, +3.82% and -0.47% respectively. The fund has been able to attract assets of about $1,018-million since inception in November 2012; AUM increased by $35.0-million in April, of which only about $20-million is due to internal growth, indicating that money is still flowing into the fund. I feel that the flows into and out of this fund are very important in determining the performance of its constituents.

TXPR had returns over one- and three-months of +1.85% and +3.69%, respectively with CPD performance within expectations.

Returns for the HIMIPref™ investment grade sub-indices for February were as follows:

HIMIPref™ Indices
Performance to April 30, 2013
Sub-Index 1-Month 3-month
Ratchet N/A N/A
FixFloat +2.67% +0.93%
Floater -1.25% -0.55%
OpRet +0.39% +0.69%
SplitShare +0.37% +2.86%
Interest N/A N/A
PerpetualPremium +1.04% +2.47%
PerpetualDiscount +2.37% +5.14%%
FixedReset +1.35% +2.66%
DeemedRetractible +1.48% +3.92%
FloatingReset +1.61% +2.16%

Malachite Aggressive Preferred Fund’s Net Asset Value per Unit as of the close April 30, 2014, was $10.4405.

Returns to April 30, 2014
Period MAPF BMO-CM “50” Index TXPR
Total Return
CPD – according to Blackrock
One Month +2.12% +1.84% +1.85% +1.80%
Three Months +5.93% +3.40% +3.69% +3.52%
One Year +1.39% +1.11% +0.10% -0.35%
Two Years (annualized) +5.17% +2.87% +2.66% N/A
Three Years (annualized) +4.77% +4.09% +3.52% +2.99%
Four Years (annualized) +9.22% +6.90% +6.02% N/A
Five Years (annualized) +12.79% +8.75% +7.14% +6.48%
Six Years (annualized) +13.82% +5.67% +4.48%  
Seven Years (annualized) +11.79% +3.98%    
Eight Years (annualized) +11.14% +4.01%    
Nine Years (annualized) +10.60% +3.95%    
Ten Years (annualized) +10.52% +4.12%    
Eleven Years (annualized) +11.79% +4.32%    
Twelve Years (annualized) +10.92% +4.46%    
Thirteen Years (annualized) +11.32% +4.18%    
MAPF returns assume reinvestment of distributions, and are shown after expenses but before fees.
CPD Returns are for the NAV and are after all fees and expenses.
* CPD does not directly report its two- or four-year returns.
Figures for Omega Preferred Equity (which are after all fees and expenses) for 1-, 3- and 12-months are +1.63%, +3.25% and +1.45%, respectively, according to Morningstar after all fees & expenses. Three year performance is +3.87%; five year is +7.79%
Figures for Jov Leon Frazer Preferred Equity Fund Class I Units (which are after all fees and expenses) for 1-, 3- and 12-months are +1.28%, +2.10% and -1.71% respectively, according to Morningstar. Three Year performance is +1.49%; five-year is +4.79%
Figures for Manulife Preferred Income Fund (formerly AIC Preferred Income Fund) (which are after all fees and expenses) for 1-, 3- and 12-months are +1.91%, +3.38% & -5.52%, respectively. Three Year performance is +1.53%; five-year is +3.80%
Figures for Horizons AlphaPro Preferred Share ETF (which are after all fees and expenses) for 1-, 3- and 12-months are +1.63%, +3.29% & +1.33%, respectively. Three year performance is +4.56%
Figures for Altamira Preferred Equity Fund are +1.57%, +3.10% and -1.69% for one-, three- and twelve months, respectively.
The figure for BMO S&P/TSX Laddered Preferred Share Index ETF is +1.99%, +3.64% and -0.98% for one-, three- and twelve-months, respectively.
Figures for NexGen Canadian Preferred Share Tax Managed Fund are not available since our wise regulators are protecting you from inappropriate knowledge.
Figures for BMO Preferred Share Fund are similarly off-limits.

MAPF returns assume reinvestment of dividends, and are shown after expenses but before fees. Past performance is not a guarantee of future performance. You can lose money investing in Malachite Aggressive Preferred Fund or any other fund. For more information, see the fund’s main page. The fund is available either directly from Hymas Investment Management or through a brokerage account at Odlum Brown Limited.

A problem that has bedevilled the market over the past two years has been the OSFI decision not to grandfather Straight Perpetuals as Tier 1 bank capital, and their continued foot-dragging regarding a decision on insurer Straight Perpetuals has segmented the market to the point where trading has become much more difficult. The fund occasionally finds an attractive opportunity to trade between GWO issues, which have a good range of annual coupons (but in which trading is now hampered by the fact that the low-coupon issues are trading near par and are callable at par in the near term), but is “stuck” in the MFC and SLF issues, which have a much narrower range of coupon, while the IAG DeemedRetractibles are quite illiquid. Until the market became so grossly segmented, this was not so much of a problem – but now banks are not available to swap into (because they are so expensive) and non-regulated companies are likewise deprecated (because they are not DeemedRetractibles; they should not participate in the increase in value that will follow the OSFI decision I anticipate and, in addition, are analyzed as perpetuals). The fund’s portfolio is, in effect ‘locked in’ to the MFC & SLF issues due to projected gains from a future OSFI decision, to the detriment of trading gains particularly in May, 2013, when the three lowest-coupon SLF DeemedRetractibles (SLF.PR.C, SLF.PR.D and SLF.PR.E) were the worst performing DeemedRetractibles in the sub-index, and in June, 2013, when the insurance-issued DeemedRetractibles behaved like PerpetualDiscounts in a sharply negative market.

At this point, the composition of the BMO-CM “50” index should be discussed; it will be noted that it has greatly outperformed TXPR over the past year, and MAPF holders will have noticed that the fund has only just returned to a positive differential against BMO-CM “50” on a year-over-year basis. While I have not done a thorough analysis of the difference, I’ve done some approximations – note that the numbers in this section are approximations, but are close enough for government work.

I believe that BMO-CM “50” has benefitted greatly over the past year by being over-weight in bank Straight Perpetuals relative to other Straight Perpetuals:

Sampling Error in BMO-CM “50”
Class of
Straight
Perpetual
BMO-CM “50”
Weight
May 2013
Proportion of BMO-CM “50” Straights Shares
Outstanding
April 2014
Proportion
Shares
Outstanding
Performance
May 2013
to
April 2014
Bank DeemedRetractible 17.7% 59.8% 240.5-million 34.5% +5.01%
Insurance DeemedRetractible 6.5% 22.0% 183.5-million 26.3% -1.80%
Bank Straight 1.8% 6.1% 47.2-million 6.8% +4.59%
Straight 3.6% 12.2% 226.6-million 32.5% -0.77%

Thus we see that at the beginning of the downdraft, the BMO-CM “50” was highly overweighted in Bank DeemedRetractibles, which have performed quite well over the year, and highly underweighted in Straight Perpetuals, which have underperformed. Weightings in the other two sectors were about right.

It’s no wonder the fund struggled to outperform the BMO-CM “50” index, and no wonder BMO-CM “50” has outperformed TXPR! One consolation, however, is that Bank DeemedRetractibles all now have a negative Yield-to-Worst; this is a reasonably good single-measure predictor of future performance. So perhaps we’ll see a reversal of these effects over the next few years!

In April, insurance DeemedRetractibles greatly outperformed bank DeemedRetractibles:

DRRelPerf_140430
Click for Big

… and were about even with Straight Perpetuals:

InsStraightRelPerf_140430
Click for Big

A lingering effect of the downdraft of 2013 has been the return of measurable Implied Volatility (all Implied Volatility calculations use bids from May 2):

ImpVol_GWO_140502
Click for Big

ImpVol_PWF_140502
Click for Big

ImpVol_BNS_140502
Click for Big

Implied Volatility of
Three Series of Straight Perpetuals
May 2, 2014
Issuer Pure Yield Implied Volatility
GWO 4.42% (-0.34) 18% (+1)
PWF 2.70% 4.20% (-1.50) 32% (+8)
BNS 0.01% (0) 40% (0)
Bracketted figures are changes since March month-end

It is disconcerting to see the difference between GWO and PWF; if anything, we would expect the implied volatility for GWO to be higher, given that the DeemedRetraction – not yet given significant credence by the market – implies a directionality in prices. The GWO data with the best fit derived for PWF is:

ImpVol_GWO_PWFFit_140502
Click for Big

The seeming discrepancy might be sampling error – if we assume that the highest coupon GWO issue [GWO.PR.F] is “right”, and the next three highest issues [GWO.PR.M, GWO.PR.L, GWO.PR.P] are priced too high (yielding too little). This could be justified if the market is paying a premium (accepting lower yield) for issues with a relatively long term until their first par call … which would be reasonable enough, but rarely happens!

In the September, 2013, edition of PrefLetter, I extended the theory of Implied Volatility to FixedResets – relating the option feature of the Issue Reset Spreads to a theoretical non-callable Market Spread.

ImpVol_BPO_140502
Click for Big

ImpVol_FFH_140502
Click for Big

Implied Volatility of
Two Series of FixedResets
February 28, 2014
Issuer Market Reset Spread
(Non-Callable)
Implied Volatility
BPO 65bp (-9) 40% (0)
FFH 281bp (-39) 15% (+6)
Bracketted figures are changes since March month-end

These are very interesting results: The BPO issues are trading as if calls are a certainty, while FFH issues are trading as if calls are much less likely. The FFH series continues to be perplexing, this time with the four lower-coupon issues showing virtually no implied volatility – with the highest coupon issue (FFH.PR.K) being well off the mark … all I can think of is that the market has decided that FFH.PR.K, with an Issue Reset Spread of 351bp, is sure to be called in 2017, while the other four (highest spread is FFH.PR.C, +315) are not at all likely to be called.

Those of you who have been paying attention will remember that in a “normal” market (which we have not seen in well over a year) the slope of this line is related to the implied volatility of yields in Black-Scholes theory, as discussed in the January, 2010, edition of PrefLetter. As has been previously noted, very high levels of Implied Volatility (in the 40% range, at which point the calculation may be considered virtually meaningless) imply a very strong expectation of directionality in future prices – i.e, an expectation that all issues will be redeemed at par.

It is significant that the preferred share market knows no moderation. I suggest that a good baseline estimate for Volatility over a three year period is 15% but the observed figure is generally higher in a rising market and lower in a declining one … with, of course, a period of adjustment in between, which I suspect we are currently experiencing.

Sometimes everything works … sometimes it’s 50-50 … sometimes nothing works. The fund seeks to earn incremental return by selling liquidity (that is, taking the other side of trades that other market participants are strongly motivated to execute), which can also be referred to as ‘trading noise’ – although for quite some time, noise trading has taken a distant second place to the sectoral play on insurance DeemedRetractibles; something that dismays me, particularly given that the market does not yet agree with me regarding the insurance issues! There were a lot of strongly motivated market participants during the Panic of 2007, generating a lot of noise! Unfortunately, the conditions of the Panic may never be repeated in my lifetime … but the fund will simply attempt to make trades when swaps seem profitable, without worrying about the level of monthly turnover.

There’s plenty of room for new money left in the fund. I have shown in PrefLetter that market pricing for FixedResets is very often irrational and I have lots of confidence – backed up by my bond portfolio management experience in the markets for Canadas and Treasuries, and equity trading on the NYSE & TSX – that there is enough demand for liquidity in any market to make the effort of providing it worthwhile (although the definition of “worthwhile” in terms of basis points of outperformance changes considerably from market to market!) I will continue to exert utmost efforts to outperform but it should be borne in mind that there will almost inevitably be periods of underperformance in the future.

The yields available on high quality preferred shares remain elevated, which is reflected in the current estimate of sustainable income.

Calculation of MAPF Sustainable Income Per Unit
Month NAVPU Portfolio
Average
YTW
Leverage
Divisor
Securities
Average
YTW
Capital
Gains
Multiplier
Sustainable
Income
per
current
Unit
June, 2007 9.3114 5.16% 1.03 5.01% 1.3240 0.3524
September 9.1489 5.35% 0.98 5.46% 1.3240 0.3773
December, 2007 9.0070 5.53% 0.942 5.87% 1.3240 0.3993
March, 2008 8.8512 6.17% 1.047 5.89% 1.3240 0.3938
June 8.3419 6.034% 0.952 6.338% 1.3240 $0.3993
September 8.1886 7.108% 0.969 7.335% 1.3240 $0.4537
December, 2008 8.0464 9.24% 1.008 9.166% 1.3240 $0.5571
March 2009 $8.8317 8.60% 0.995 8.802% 1.3240 $0.5872
June 10.9846 7.05% 0.999 7.057% 1.3240 $0.5855
September 12.3462 6.03% 0.998 6.042% 1.3240 $0.5634
December 2009 10.5662 5.74% 0.981 5.851% 1.1141 $0.5549
March 2010 10.2497 6.03% 0.992 6.079% 1.1141 $0.5593
June 10.5770 5.96% 0.996 5.984% 1.1141 $0.5681
September 11.3901 5.43% 0.980 5.540% 1.1141 $0.5664
December 2010 10.7659 5.37% 0.993 5.408% 1.0298 $0.5654
March, 2011 11.0560 6.00% 0.994 5.964% 1.0298 $0.6403
June 11.1194 5.87% 1.018 5.976% 1.0298 $0.6453
September 10.2709 6.10%
Note
1.001 6.106% 1.0298 $0.6090
December, 2011 10.0793 5.63%
Note
1.031 5.805% 1.0000 $0.5851
March, 2012 10.3944 5.13%
Note
0.996 5.109% 1.0000 $0.5310
June 10.2151 5.32%
Note
1.012 5.384% 1.0000 $0.5500
September 10.6703 4.61%
Note
0.997 4.624% 1.0000 $0.4934
December, 2012 10.8307 4.24% 0.989 4.287% 1.0000 $0.4643
March, 2013 10.9033 3.87% 0.996 3.886% 1.0000 $0.4237
June 10.3261 4.81% 0.998 4.80% 1.0000 $0.4957
September 10.0296 5.62% 0.996 5.643% 1.0000 $0.5660
December, 2013 9.8717 6.02% 1.008 5.972% 1.0000 $0.5895
March, 2014 10.2233 5.55% 0.998 5.561% 1.0000 $0.5685
April, 2014 10.4405 5.43% 1.000 5.43% 1.0000 $0.5669
NAVPU is shown after quarterly distributions of dividend income and annual distribution of capital gains.
Portfolio YTW includes cash (or margin borrowing), with an assumed interest rate of 0.00%
The Leverage Divisor indicates the level of cash in the account: if the portfolio is 1% in cash, the Leverage Divisor will be 0.99
Securities YTW divides “Portfolio YTW” by the “Leverage Divisor” to show the average YTW on the securities held; this assumes that the cash is invested in (or raised from) all securities held, in proportion to their holdings.
The Capital Gains Multiplier adjusts for the effects of Capital Gains Dividends. On 2009-12-31, there was a capital gains distribution of $1.989262 which is assumed for this purpose to have been reinvested at the final price of $10.5662. Thus, a holder of one unit pre-distribution would have held 1.1883 units post-distribution; the CG Multiplier reflects this to make the time-series comparable. Note that Dividend Distributions are not assumed to be reinvested.
Sustainable Income is the resultant estimate of the fund’s dividend income per current unit, before fees and expenses. Note that a “current unit” includes reinvestment of prior capital gains; a unitholder would have had the calculated sustainable income with only, say, 0.9 units in the past which, with reinvestment of capital gains, would become 1.0 current units.
DeemedRetractibles are comprised of all Straight Perpetuals (both PerpetualDiscount and PerpetualPremium) issued by BMO, BNS, CM, ELF, GWO, HSB, IAG, MFC, NA, RY, SLF and TD, which are not exchangable into common at the option of the company (definition refined in May, 2011). These issues are analyzed as if their prospectuses included a requirement to redeem at par on or prior to 2022-1-31 (banks) or 2025-1-31 (insurers and insurance holding companies), in addition to the call schedule explicitly defined. See OSFI Does Not Grandfather Extant Tier 1 Capital, CM.PR.D, CM.PR.E, CM.PR.G: Seeking NVCC Status and the January, February, March and June, 2011, editions of PrefLetter for the rationale behind this analysis.
Yields for September, 2011, to January, 2012, were calculated by imposing a cap of 10% on the yields of YLO issues held, in order to avoid their extremely high calculated yields distorting the calculation and to reflect the uncertainty in the marketplace that these yields will be realized. From February to September 2012, yields on these issues have been set to zero. All YLO issues held were sold in October 2012.

Significant positions were held in DeemedRetractible, SplitShare and FixedReset issues on February 28; all of these currently have their yields calculated with the presumption that they will be called by the issuers at par prior to 2022-1-31 (banks) or 2025-1-31 (insurers and insurance holding companies) or on a different date (SplitShares). This presents another complication in the calculation of sustainable yield. The fund also holds positions in various SplitShare issues which also have their yields calculated with the expectation of a maturity at par.

I no longer show calculations that assume the conversion of the entire portfolio into PerpetualDiscounts, as the fund has only a small position in these issues.

I will also note that the sustainable yield calculated above is not directly comparable with any yield calculation currently reported by any other preferred share fund as far as I am aware. The Sustainable Yield depends on:
i) Calculating Yield-to-Worst for each instrument and using this yield for reporting purposes;
ii) Using the contemporary value of Five-Year Canadas (set at 1.68% for the April 30 calculation) to estimate dividends after reset for FixedResets.

Most funds report Current Yield. For instance, ZPR reports a “Portfolio Yield” of 4.70% as of April 24, 2014 and notes:

Portfolio yield is calculated as the most recent income received by the ETF in the form of dividends interest and other income annualized based on the payment frequently divided by the current market value of ETFs investments.

In other words – it’s the Current Yield, a meaningless number. The Current Yield of MAPF is 5.01% as of April 30, but I will neither report that with any degree of prominence nor take any great pleasure in the fact that it’s a little higher than the ZPR number. It’s meaningless; to discuss it in the context of portfolio reporting is misleading.

It should be noted that the concept of this Sustainable Income calculation was developed when the fund’s holdings were overwhelmingly PerpetualDiscounts – see, for instance, the bottom of the market in November 2008. It is easy to understand that for a PerpetualDiscount, the technique of multiplying yield by price will indeed result in the coupon – a PerpetualDiscount paying $1 annually will show a Sustainable Income of $1, regardless of whether the price is $24 or $17.

Things are not quite so neat when maturity dates and maturity prices that are different from the current price are thrown into the mix. If we take a notional Straight Perpetual paying $5 annually, the price is $100 when the yield is 5% (all this ignores option effects). As the yield increases to 6%, the price declines to 83.33; and 83.33 x 6% is the same $5. Good enough.

But a ten year bond, priced at 100 when the yield is equal to its coupon of 5%, will decline in price to 92.56; and 92.56 x 6% is 5.55; thus, the calculated Sustainable Income has increased as the price has declined as shown in the graph:


Click for Big

The difference is because the bond’s yield calculation includes the amortization of the discount; therefore, so does the Sustainable Income estimate.

Different assumptions lead to different results from the calculation, but the overall positive trend is apparent. I’m very pleased with the long-term results! It will be noted that if there was no trading in the portfolio, one would expect the sustainable yield to be constant (before fees and expenses). The success of the fund’s trading is showing up in

  • the very good performance against the index
  • the long term increases in sustainable income per unit

As has been noted, the fund has maintained a credit quality equal to or better than the index; outperformance has generally been due to exploitation of trading anomalies.

Again, there are no predictions for the future! The fund will continue to trade between issues in an attempt to exploit market gaps in liquidity, in an effort to outperform the index and keep the sustainable income per unit – however calculated! – growing.

MAPF

MAPF: Portfolio Composition April 2014

Turnover decreased slightly in April, to about 5%.

There is extreme segmentation in the marketplace, with OSFI’s NVCC rule changes in February 2011 having had the effect of splitting the formerly relatively homogeneous Straight Perpetual class of preferreds into three parts:

  • Unaffected Straight Perpetuals
  • DeemedRetractibles explicitly subject to the rules (banks)
  • DeemedRetractibles considered by me, but not (yet!) by the market, to be likely to be explicitly subject to the rules in the future (insurers and insurance holding companies)

This segmentation, and the extreme valuation differences between the segments, has cut down markedly on the opportunities for trading. Another trend that hasn’t helped was the migration of PerpetualDiscounts into PerpetualPremiums (due to price increases) in early 2013 – many of the PerpetualPremiums had negative Yields-to-Worst and those that don’t aren’t particularly thrilling; speaking very generally, PerpetualPremiums are to be avoided, not traded! This effect has caused the first of the three segments noted above to be untradeable for most practical purposes. Last summer’s downdraft reversed the trend and resulted in a large pool of PerpetualDiscounts, but due to their long term they are still, as a class, inferior to DeemedRetractibles.

To make this more clear, it used to be that there were 70-odd Straight Perpetuals and I was more or less indifferent as to which ones I owned (subject, of course, to issuer concentration concerns and other risk management factors). Thus, if any one of these 70 were to go down in price by – say – $0.25, I would quite often have something in inventory that I’d be willing to swap for it. The segmentation means that I am no longer indifferent; in addition to checking the valuation of a potential buy to other Straights, I also have to check its peer group. This cuts down on the potential for trading.

There is no real hope that this situation will be corrected in the near-term. OSFI has indicated that the long-promised “Draft Definition of Capital” for insurers will not be issued “for public consultation in late 2012 or early 2013”, as they fear that it might encourage speculation in the marketplace. It is not clear why OSFI is so afraid of informed speculation, since the constant speculation in the marketplace is currently less informed than it would be with a little bit of regulatory clarity.

As a result of this delay, I have extended the Deemed Maturity date for insurers and insurance holding companies by three years (to 2025-1-31), in the expectation that when OSFI finally does provide clarity, they will allow the same degree of lead-in time for these companies as they did for banks. This had a major effect on the durations of preferred shares subject to the change but, fortunately, not much on their calculated yields as most of these issues were either trading near par when the change was made or were trading at sufficient premium that a par call was expected on economic grounds. However, with the declines in the market over the past nine months, the expected capital gain on redemption of the insurance-issued DeemedRetractibles has become an important component of the calculated yield.

Due to further footdragging by OSFI, I will be extending the DeemedMaturity date for insurance issues by another two years in the near future.

Sectoral distribution of the MAPF portfolio on April 30 was as follows:

MAPF Sectoral Analysis 2014-04-30
HIMI Indices Sector Weighting YTW ModDur
Ratchet 0% N/A N/A
FixFloat 0% N/A N/A
Floater 0% N/A N/A
OpRet 0% N/A N/A
SplitShare 15.0% (-0.1) 4.17% 5.68
Interest Rearing 0% N/A N/A
PerpetualPremium 0% N/A N/A
PerpetualDiscount 10.6% (+0.1) 5.16% 15.13
Fixed-Reset 6.8% (-2.5) 3.79% 7.56
Deemed-Retractible 56.8% (+2.0) 5.90% 8.25
Scraps (Various) 10.8% (+0.6) 6.05% 11.72
Cash 0% (-0.2) 0.00% 0.00
Total 100% 5.43% 8.92
Totals and changes will not add precisely due to rounding. Bracketted figures represent change from March month-end. Cash is included in totals with duration and yield both equal to zero.
DeemedRetractibles are comprised of all Straight Perpetuals (both PerpetualDiscount and PerpetualPremium) issued by BMO, BNS, CM, ELF, GWO, HSB, IAG, MFC, NA, RY, SLF and TD, which are not exchangable into common at the option of the company. These issues are analyzed as if their prospectuses included a requirement to redeem at par on or prior to 2022-1-31 (banks) or 2025-1-3 (insurers and insurance holding companies), in addition to the call schedule explicitly defined. See OSFI Does Not Grandfather Extant Tier 1 Capital, CM.PR.D, CM.PR.E, CM.PR.G: NVCC Status Confirmed and the January, February, March and June, 2011, editions of PrefLetter for the rationale behind this analysis. (all recent editions have a short summary of the argument included in the “DeemedRetractible” section)

Note that the estimate for the time this will become effective for insurers and insurance holding companies was extended by three years in April 2013, due to the delays in OSFI’s providing clarity on the issue.

The “total” reflects the un-leveraged total portfolio (i.e., cash is included in the portfolio calculations and is deemed to have a duration and yield of 0.00.). MAPF will often have relatively large cash balances, both credit and debit, to facilitate trading. Figures presented in the table have been rounded to the indicated precision.

Credit distribution is:

MAPF Credit Analysis 2014-4-30
DBRS Rating Weighting
Pfd-1 0 (0)
Pfd-1(low) 28.3% (-0.1)
Pfd-2(high) 51.9% (-0.7)
Pfd-2 0%
Pfd-2(low) 9.0% (+0.5)
Pfd-3(high) 1.0% (0)
Pfd-3 5.4% (+0.9)
Pfd-3(low) 2.2% (-0.4)
Pfd-4(high) 0%
Pfd-4 0%
Pfd-4(low) 0.8% (0)
Pfd-5(high) 1.4% (0)
Cash 0% (-0.6)
Totals will not add precisely due to rounding. Bracketted figures represent change from March month-end.
A position held in NPI.PR.A is not rated by DBRS, but has been included as “Pfd-3(high)” in the above table on the basis of its S&P rating of P-3(high).

Liquidity Distribution is:

MAPF Liquidity Analysis 2014-4-30
Average Daily Trading Weighting
<$50,000 0.0% (0)
$50,000 – $100,000 26.9% (+7.8)
$100,000 – $200,000 25.0% (+5.2)
$200,000 – $300,000 42.9% (-12.7)
>$300,000 5.2% (-0.1)
Cash 0.0% (-0.2)
Totals will not add precisely due to rounding. Bracketted figures represent change from March month-end.

MAPF is, of course, Malachite Aggressive Preferred Fund, a “unit trust” managed by Hymas Investment Management Inc. Further information and links to performance, audited financials and subscription information are available the fund’s web page. The fund may be purchased either directly from Hymas Investment Management or through a brokerage account at Odlum Brown Limited. A “unit trust” is like a regular mutual fund, but is sold by offering memorandum rather than prospectus. This is cheaper, but means subscription is restricted to “accredited investors” (as defined by the Ontario Securities Commission) or those who subscribe for $150,000+. Fund past performances are not a guarantee of future performance. You can lose money investing in MAPF or any other fund.

A similar portfolio composition analysis has been performed on the Claymore Preferred Share ETF (symbol CPD) (and other funds) as of August 31, 2012, and published in the October (mainly methodology), November (most funds), and December (ZPR) 2012, PrefLetter. While direct comparisons are difficult due to the introduction of the DeemedRetractible class of preferred share (see above) it is fair to say:

  • MAPF credit quality is better
  • MAPF liquidity is a bit lower
  • MAPF Yield is higher
  • Weightings
    • MAPF is much more exposed to DeemedRetractibles
    • MAPF is much less exposed to Operating Retractibles
    • MAPF is much more exposed to SplitShares
    • MAPF is less exposed to FixFloat / Floater / Ratchet
    • MAPF weighting in FixedResets is much lower
Market Action

May 2, 2014

The build up of corporate cash since the Credit Crunch has a nice side-effect:

Rather than get the euros or pounds they need through currency markets, there’s speculation U.S. companies including General Electric Co. may be dipping into offshore cash piles they’ve built up to mitigate tax liabilities.

“Before the market gets excited that mega takeovers from the U.S. could lift the euro and pound, it’s worth recognizing that U.S. companies are sitting on truly huge cash piles abroad,” Steven Barrow, the head of Group of 10 research at Standard Bank Plc in London, wrote in an April 29 note to clients. “That does change the way we have to look at these takeovers from a currency perspective.”

The New York Times produced an excellent graphic regarding relative price changes over the past decade; regrettably but understandably they’ve made it a PNG which doesn’t reproduce well on this blog. Anyway, the point is that the cost of College tuition and fees has soared relative to everything else. I last complained about the universities’ mission-creep on March 6, 2014.

It was another excellent day for the Canadian preferred share market, with PerpetualDiscounts up 19bp, FixedResets winning 26bp and DeemedRetractibles gaining 15bp. Volatility was high, with a lengthy list of winners dominated by FixedResets. Volume was average.

HIMIPref™ Preferred Indices
These values reflect the December 2008 revision of the HIMIPref™ Indices

Values are provisional and are finalized monthly
Index Mean
Current
Yield
(at bid)
Median
YTW
Median
Average
Trading
Value
Median
Mod Dur
(YTW)
Issues Day’s Perf. Index Value
Ratchet 0.00 % 0.00 % 0 0.00 0 0.8597 % 2,403.6
FixedFloater 4.62 % 3.85 % 30,409 17.77 1 0.1461 % 3,717.8
Floater 3.03 % 3.18 % 52,833 19.28 4 0.8597 % 2,595.2
OpRet 4.35 % -7.00 % 33,369 0.08 2 -0.0387 % 2,699.9
SplitShare 4.79 % 4.33 % 63,718 4.20 5 0.0872 % 3,097.9
Interest-Bearing 0.00 % 0.00 % 0 0.00 0 -0.0387 % 2,468.8
Perpetual-Premium 5.53 % -5.42 % 99,692 0.08 15 0.0654 % 2,394.6
Perpetual-Discount 5.31 % 5.35 % 120,128 14.90 21 0.1907 % 2,532.7
FixedReset 4.51 % 3.38 % 208,500 4.15 75 0.2562 % 2,563.8
Deemed-Retractible 4.98 % -4.25 % 143,597 0.14 42 0.1483 % 2,520.1
FloatingReset 2.68 % 2.30 % 143,689 4.22 6 0.0132 % 2,494.9
Performance Highlights
Issue Index Change Notes
FTS.PR.H FixedReset -1.05 % YTW SCENARIO
Maturity Type : Limit Maturity
Maturity Date : 2044-05-02
Maturity Price : 21.41
Evaluated at bid price : 21.73
Bid-YTW : 3.70 %
CU.PR.C FixedReset 1.04 % YTW SCENARIO
Maturity Type : Call
Maturity Date : 2017-06-01
Maturity Price : 25.00
Evaluated at bid price : 26.21
Bid-YTW : 2.60 %
GWO.PR.N FixedReset 1.06 % YTW SCENARIO
Maturity Type : Hard Maturity
Maturity Date : 2025-01-31
Maturity Price : 25.00
Evaluated at bid price : 22.95
Bid-YTW : 4.09 %
SLF.PR.I FixedReset 1.07 % YTW SCENARIO
Maturity Type : Call
Maturity Date : 2016-12-31
Maturity Price : 25.00
Evaluated at bid price : 26.48
Bid-YTW : 2.10 %
MFC.PR.F FixedReset 1.07 % YTW SCENARIO
Maturity Type : Hard Maturity
Maturity Date : 2025-01-31
Maturity Price : 25.00
Evaluated at bid price : 23.55
Bid-YTW : 4.08 %
SLF.PR.G FixedReset 1.09 % YTW SCENARIO
Maturity Type : Hard Maturity
Maturity Date : 2025-01-31
Maturity Price : 25.00
Evaluated at bid price : 23.25
Bid-YTW : 4.10 %
SLF.PR.H FixedReset 1.09 % YTW SCENARIO
Maturity Type : Call
Maturity Date : 2016-09-30
Maturity Price : 25.00
Evaluated at bid price : 25.98
Bid-YTW : 2.37 %
HSE.PR.A FixedReset 1.09 % YTW SCENARIO
Maturity Type : Limit Maturity
Maturity Date : 2044-05-02
Maturity Price : 22.81
Evaluated at bid price : 23.16
Bid-YTW : 3.80 %
GWO.PR.I Deemed-Retractible 1.16 % YTW SCENARIO
Maturity Type : Hard Maturity
Maturity Date : 2025-01-31
Maturity Price : 25.00
Evaluated at bid price : 22.70
Bid-YTW : 5.74 %
PWF.PR.A Floater 1.51 % YTW SCENARIO
Maturity Type : Limit Maturity
Maturity Date : 2044-05-02
Maturity Price : 19.50
Evaluated at bid price : 19.50
Bid-YTW : 2.68 %
PWF.PR.P FixedReset 2.88 % YTW SCENARIO
Maturity Type : Limit Maturity
Maturity Date : 2044-05-02
Maturity Price : 23.52
Evaluated at bid price : 24.65
Bid-YTW : 3.35 %
Volume Highlights
Issue Index Shares
Traded
Notes
MFC.PR.D FixedReset 78,218 CIBC bought four blocks from RBC: 12,200 shares, 11,100 shares, 11,400 and 10,600, all at 25.42. CIBC also bought 24,900 from TD at the same price.
YTW SCENARIO
Maturity Type : Call
Maturity Date : 2014-06-19
Maturity Price : 25.00
Evaluated at bid price : 25.36
Bid-YTW : 1.67 %
SLF.PR.I FixedReset 69,146 Desjardins crossed blocks of 43,000 and 10,000, both at 26.30.
YTW SCENARIO
Maturity Type : Call
Maturity Date : 2016-12-31
Maturity Price : 25.00
Evaluated at bid price : 26.48
Bid-YTW : 2.10 %
RY.PR.Z FixedReset 66,690 RBC crossed blocks of 24,900 and 30,000, both at 25.75.
YTW SCENARIO
Maturity Type : Call
Maturity Date : 2019-05-24
Maturity Price : 25.00
Evaluated at bid price : 25.76
Bid-YTW : 3.30 %
POW.PR.D Perpetual-Discount 56,895 Scotia crossed 54,000 at 23.80.
YTW SCENARIO
Maturity Type : Limit Maturity
Maturity Date : 2044-05-02
Maturity Price : 23.46
Evaluated at bid price : 23.76
Bid-YTW : 5.29 %
BAM.PR.P FixedReset 52,170 Scotia crossed 50,000 at 25.65.
YTW SCENARIO
Maturity Type : Call
Maturity Date : 2014-09-30
Maturity Price : 25.00
Evaluated at bid price : 25.65
Bid-YTW : 2.13 %
BNS.PR.Z FixedReset 44,950 RBC crossed 25,000 at 24.75.
YTW SCENARIO
Maturity Type : Hard Maturity
Maturity Date : 2022-01-31
Maturity Price : 25.00
Evaluated at bid price : 24.70
Bid-YTW : 3.38 %
There were 31 other index-included issues trading in excess of 10,000 shares.
Wide Spread Highlights
Issue Index Quote Data and Yield Notes
PWF.PR.H Perpetual-Premium Quote: 25.50 – 26.01
Spot Rate : 0.5100
Average : 0.2999

YTW SCENARIO
Maturity Type : Call
Maturity Date : 2014-06-01
Maturity Price : 25.00
Evaluated at bid price : 25.50
Bid-YTW : -17.21 %

CU.PR.C FixedReset Quote: 26.21 – 26.70
Spot Rate : 0.4900
Average : 0.3034

YTW SCENARIO
Maturity Type : Call
Maturity Date : 2017-06-01
Maturity Price : 25.00
Evaluated at bid price : 26.21
Bid-YTW : 2.60 %

VNR.PR.A FixedReset Quote: 25.74 – 26.10
Spot Rate : 0.3600
Average : 0.2122

YTW SCENARIO
Maturity Type : Call
Maturity Date : 2017-10-15
Maturity Price : 25.00
Evaluated at bid price : 25.74
Bid-YTW : 3.51 %

BAM.PR.T FixedReset Quote: 25.02 – 25.35
Spot Rate : 0.3300
Average : 0.1933

YTW SCENARIO
Maturity Type : Limit Maturity
Maturity Date : 2044-05-02
Maturity Price : 23.40
Evaluated at bid price : 25.02
Bid-YTW : 3.99 %

TRP.PR.C FixedReset Quote: 22.79 – 23.25
Spot Rate : 0.4600
Average : 0.3282

YTW SCENARIO
Maturity Type : Limit Maturity
Maturity Date : 2044-05-02
Maturity Price : 22.44
Evaluated at bid price : 22.79
Bid-YTW : 3.62 %

ENB.PR.Y FixedReset Quote: 24.50 – 24.85
Spot Rate : 0.3500
Average : 0.2188

YTW SCENARIO
Maturity Type : Limit Maturity
Maturity Date : 2044-05-02
Maturity Price : 22.96
Evaluated at bid price : 24.50
Bid-YTW : 4.08 %

Market Action

May 1, 2014

In honour of May Day, Ontario has a pre-election budget:

Opinion research suggests there are far more swing voters on the Liberals’ left than on their right. So the government’s agenda, which includes a 2014-15 deficit, significantly higher than the one previously forecast, all but abandons hope of appealing to moderate fiscal conservatives. Instead, it is mostly about competing with the NDP.

According to KPMG:

The budget proposes to lower the taxable income threshold for the 13.16% tax rate from $514,090 to $220,000. The budget also adds a new tax rate of 12.16% on taxable income between $150,000 and $220,000. These changes would apply to taxation years ending after December 31, 2013. The new income thresholds would not be adjusted for inflation each year.

Therefore, they estimate:

OntMargTax_150_220
Click for Big

OntMargTax_220_514>
Click for Big

OntMargTax_514up
Click for Big

… whence we can calculate …

Ontario 2014 Budget Proposal
Effect on Eligible Dividend Equivalency Factors
Income
Range
Current Proposed
$150-220M 1.32 1.31
$220-514M 1.32 1.31
>$514M 1.31

So fear not, preferred share fans! Business as usual.

KPMG continues:

The budget proposes a mandatory new provincial pension plan based on the Canada Pension Plan (CPP). The Ontario Retirement Pension Plan (ORPP), which would be introduced in 2017, is intended to provide additional retirement income. The ORPP would be publically administered at arm’s length from the Ontario government.

The plan would require equal contributions shared between employers and employees (not exceeding 1.9% each, or 3.8% in total) up to a maximum annual earnings threshold of $90,000. The threshold would increase each year, consistent with the CPP maximum earnings threshold. Benefits would be earned as contributions are made.

Enrolment into the ORPP would occur in stages, starting with large employers, with contribution rates phased-in over two years. Individuals that already participate in a similar workplace pension plan would not be required to enroll in the ORPP.

The budget proposes to introduce a new asset pooling entity to enable pooling pension plan assets in the public sector. The entity would operate at arm’s length from the government. Legislation is expected in spring 2015.

The government also said it intends to address the following pension issues:
• Target benefit pension plans
• Regulation of financial planning
• Changes to the funding rules.

Pooling pension plan assets is a well-intentioned dumb idea (see, for example, March 22, 2013). But there will be some nice jobs going for a few lucky arse-suckers; no performance necessary. However, I think auditions for the CEO role at ORPP have already been held, as discussed on October 16, 2013.

Janet McFarland of the Globe points out:

Unlike the CPP, the ORPP will not cover all workers in the province, the government said.

Instead, it will cover about half of Ontario’s 6 million-person work force, excluding the self-employed, all workers whose companies already offer workplace pension plans, and Ontarians working in federally regulated sectors like banking, transportation and telecommunications. The latter group cannot be included because the province does not have jurisdiction over pensions for workers in federal sectors, while the government is excluding those with existing workplace pension plans because it says the program is aimed at those who most need help saving for retirement.

KPMG continues with the revelation that farmers will be getting yet another government cheque:

The budget announces that Ontario will draft legislation to implement a non-refundable income tax credit for farmers who donate food to community food programs, including food banks for donations beginning January 1, 2014.

And there are the usual favourite targets:

The budget proposes to increase tobacco tax from 12.350 cents to 13.975 cents per cigarette (i.e., from $24.70 to $27.95 per carton of 200 cigarettes) and per gram of tobacco products (other than cigarettes or cigars). This measure would be effective 12:01am on May 2, 2014. As a result, wholesalers of tobacco tax are required to take an inventory of all tobacco products (except cigars) held at the end of May 1, 2014 and remit additional tax on this inventory.

The budget proposes to raise the tax on aviation fuel to 3.7 cents per litre (from 2.7 cents per litre) for 2014, with an additional tax increase of one cent per year until 2018. This measure is effective on Royal Assent, with subsequent rate increases effective on April 1 of 2015, 2016 and 2017.

The NYSE’s getting fined for not ticking sufficient boxes:

As SROs, the NYSE exchanges are required to conduct their operations in accordance and compliance with their own rules as well as the federal securities laws. They are required to file all proposed rules and rule changes with the Commission, which publishes them for public comment, before they take effect. This transparency enables all participants trading on the exchanges to understand how their orders are processed and executed.

According to the SEC’s order instituting settled administrative proceedings, the NYSE exchanges repeatedly engaged in business practices that either violated exchange rules or required a rule when the exchanges had none in effect. For example, all of the NYSE exchanges used an error account maintained at Archipelago Securities to trade out of securities positions taken on as a result of their operations despite not having rules in effect that permitted them to maintain and use such an account. In another example, NYSE Arca failed to execute a certain type of limit order under specified market conditions despite having a rule in effect that stated that NYSE Arca would execute such orders.

The SEC’s order finds that the NYSE exchanges violated Section 19(b) and 19(g) of the Securities Exchange Act of 1934 through misconduct that included the following:

NYSE, NYSE Arca, and NYSE MKT (formerly NYSE Amex) used an error account maintained at Archipelago Securities to assume and trade out of securities positions without a rule in effect that permitted such trading and in a manner inconsistent with their rules for the routing broker, which limited Archipelago Securities’ activity primarily to outbound and inbound routing of orders on behalf of those exchanges.

NYSE provided co-location services to customers on disparate contractual terms without an exchange rule in effect that permitted and governed the provision of such services on a fair and equitable basis.
NYSE operated a block trading facility (New York Block Exchange) that for a period of time did not function in accordance with the rules submitted by NYSE and approved by the SEC.
NYSE distributed an automated feed of closing order imbalance information to its floor brokers at an earlier time than was specified in NYSE’s rules.

NYSE Arca failed to execute Mid-Point Passive Liquidity Orders (MPLOs) in locked markets (where the bid and ask prices are the same) contrary to its exchange rule in effect at the time.

In addition, the SEC’s order finds that NYSE Arca accepted MPLOs in sub-penny amounts for National Market System stocks trading at over $1.00 per share, in violation of Rule 612(a) of Regulation NMS.

The SEC’s order further finds that Archipelago Securities failed to establish and maintain policies reasonably designed to prevent the misuse of material, nonpublic information in connection with error account trading.

Wow – that’s enough to make you faint, huh? I love that last one, it’s classic: Archipelago didn’t actually do anything wrong, they just failed to write down that they wouldn’t do anything wrong.

I was intrigued by an advertisement for a discussion at Rotman on OSFI … until I saw the speakers list:

Stanley Hartt, Counsel, Norton Rose Fulbright; former Deputy Minister of Finance Canada
Hon. Michael Wilson, former Minister of Finance of Canada; Chairman, Barclays Capital Canada Inc.; Chancellor, University of Toronto
Hon. Barbara McDougall, former Minister of State (Finance) of Canada

Smiley boys. Not a single practitioner. Not even a big-bank zombie who will toe the line nicely. Have a nice time.

Manulife’s 14Q1 Quarterly Report casts broad hints that MFC.PR.D will be redeemed:

If the Company redeems, subject to regulatory approval, $450 million of preferred shares which will become redeemable at par in June, we would expect a further 3 point decline in the MCCSR ratio.

Mind you, a redemption of MFC.PR.D (FixedReset, 6.60%+456) will not actually surprise anybody.

In common with the Ontario government, the Canadian preferred share market celebrated May Day with a very nice pop; PerpetualDiscounts winning 50bp, FixedResets gaining 22bp and DeemedRetractibles up 23bp. Volatility was suitably present, with Floating Rate issues getting hit (gee, I guess the yanking of government policy rates has been postponed again). Volume was above average.

HIMIPref™ Preferred Indices
These values reflect the December 2008 revision of the HIMIPref™ Indices

Values are provisional and are finalized monthly
Index Mean
Current
Yield
(at bid)
Median
YTW
Median
Average
Trading
Value
Median
Mod Dur
(YTW)
Issues Day’s Perf. Index Value
Ratchet 0.00 % 0.00 % 0 0.00 0 -0.8667 % 2,383.1
FixedFloater 4.63 % 3.86 % 30,731 17.76 1 -0.2913 % 3,712.4
Floater 3.06 % 3.20 % 50,589 19.22 4 -0.8667 % 2,573.1
OpRet 4.35 % -7.65 % 33,842 0.09 2 0.0774 % 2,701.0
SplitShare 4.79 % 4.41 % 64,508 4.20 5 -0.0475 % 3,095.2
Interest-Bearing 0.00 % 0.00 % 0 0.00 0 0.0774 % 2,469.8
Perpetual-Premium 5.53 % -6.05 % 100,223 0.08 15 0.0367 % 2,393.1
Perpetual-Discount 5.32 % 5.38 % 116,194 14.86 21 0.4975 % 2,527.8
FixedReset 4.52 % 3.43 % 210,691 4.15 75 0.2171 % 2,557.2
Deemed-Retractible 4.99 % -4.45 % 144,871 0.15 42 0.2335 % 2,516.3
FloatingReset 2.68 % 2.29 % 135,783 4.22 6 0.0396 % 2,494.6
Performance Highlights
Issue Index Change Notes
BAM.PR.B Floater -1.67 % YTW SCENARIO
Maturity Type : Limit Maturity
Maturity Date : 2044-05-01
Maturity Price : 16.47
Evaluated at bid price : 16.47
Bid-YTW : 3.21 %
BAM.PR.K Floater -1.14 % YTW SCENARIO
Maturity Type : Limit Maturity
Maturity Date : 2044-05-01
Maturity Price : 16.43
Evaluated at bid price : 16.43
Bid-YTW : 3.22 %
CU.PR.D Perpetual-Discount 1.08 % YTW SCENARIO
Maturity Type : Limit Maturity
Maturity Date : 2044-05-01
Maturity Price : 23.96
Evaluated at bid price : 24.35
Bid-YTW : 5.09 %
POW.PR.D Perpetual-Discount 1.11 % YTW SCENARIO
Maturity Type : Limit Maturity
Maturity Date : 2044-05-01
Maturity Price : 23.42
Evaluated at bid price : 23.72
Bid-YTW : 5.30 %
ENB.PR.B FixedReset 1.16 % YTW SCENARIO
Maturity Type : Call
Maturity Date : 2017-06-01
Maturity Price : 25.00
Evaluated at bid price : 25.24
Bid-YTW : 3.92 %
TRP.PR.B FixedReset 1.49 % YTW SCENARIO
Maturity Type : Limit Maturity
Maturity Date : 2044-05-01
Maturity Price : 21.16
Evaluated at bid price : 21.16
Bid-YTW : 3.60 %
PWF.PR.L Perpetual-Discount 1.57 % YTW SCENARIO
Maturity Type : Limit Maturity
Maturity Date : 2044-05-01
Maturity Price : 24.25
Evaluated at bid price : 24.55
Bid-YTW : 5.21 %
Volume Highlights
Issue Index Shares
Traded
Notes
BNS.PR.Q FixedReset 113,795 TD crossed blocks of 50,000 and 60,000, both at 25.55.
YTW SCENARIO
Maturity Type : Call
Maturity Date : 2018-10-25
Maturity Price : 25.00
Evaluated at bid price : 25.52
Bid-YTW : 3.13 %
RY.PR.L FixedReset 100,175 TD crossed blocks of 50,000 and 30,000, both at 26.55.
YTW SCENARIO
Maturity Type : Call
Maturity Date : 2019-02-24
Maturity Price : 25.00
Evaluated at bid price : 26.52
Bid-YTW : 2.85 %
TD.PR.K FixedReset 75,783 TD crossed 62,900 at 25.33.
YTW SCENARIO
Maturity Type : Call
Maturity Date : 2014-07-31
Maturity Price : 25.00
Evaluated at bid price : 25.29
Bid-YTW : 1.67 %
TD.PR.O Deemed-Retractible 74,091 TD crossed 60,600 at 25.76.
YTW SCENARIO
Maturity Type : Call
Maturity Date : 2014-05-31
Maturity Price : 25.25
Evaluated at bid price : 25.65
Bid-YTW : -13.69 %
GWO.PR.F Deemed-Retractible 63,688 TD crossed 60,000 at 25.45.
YTW SCENARIO
Maturity Type : Call
Maturity Date : 2014-05-31
Maturity Price : 25.00
Evaluated at bid price : 25.42
Bid-YTW : -8.36 %
BAM.PF.E FixedReset 56,905 Scotia crossed 35,000 at 25.10.
YTW SCENARIO
Maturity Type : Limit Maturity
Maturity Date : 2044-05-01
Maturity Price : 23.14
Evaluated at bid price : 25.10
Bid-YTW : 4.19 %
There were 41 other index-included issues trading in excess of 10,000 shares.
Wide Spread Highlights
Issue Index Quote Data and Yield Notes
GWO.PR.I Deemed-Retractible Quote: 22.44 – 22.99
Spot Rate : 0.5500
Average : 0.3403

YTW SCENARIO
Maturity Type : Hard Maturity
Maturity Date : 2025-01-31
Maturity Price : 25.00
Evaluated at bid price : 22.44
Bid-YTW : 5.88 %

CU.PR.F Perpetual-Discount Quote: 22.40 – 22.86
Spot Rate : 0.4600
Average : 0.2808

YTW SCENARIO
Maturity Type : Limit Maturity
Maturity Date : 2044-05-01
Maturity Price : 22.10
Evaluated at bid price : 22.40
Bid-YTW : 5.09 %

HSB.PR.C Deemed-Retractible Quote: 25.29 – 25.59
Spot Rate : 0.3000
Average : 0.1812

YTW SCENARIO
Maturity Type : Call
Maturity Date : 2014-06-30
Maturity Price : 25.00
Evaluated at bid price : 25.29
Bid-YTW : 0.58 %

TD.PR.R Deemed-Retractible Quote: 26.63 – 26.98
Spot Rate : 0.3500
Average : 0.2381

YTW SCENARIO
Maturity Type : Call
Maturity Date : 2014-05-31
Maturity Price : 25.75
Evaluated at bid price : 26.63
Bid-YTW : -32.37 %

POW.PR.B Perpetual-Discount Quote: 24.64 – 24.96
Spot Rate : 0.3200
Average : 0.2130

YTW SCENARIO
Maturity Type : Limit Maturity
Maturity Date : 2044-05-01
Maturity Price : 24.33
Evaluated at bid price : 24.64
Bid-YTW : 5.46 %

PWF.PR.E Perpetual-Premium Quote: 25.20 – 25.50
Spot Rate : 0.3000
Average : 0.2152

YTW SCENARIO
Maturity Type : Call
Maturity Date : 2014-05-31
Maturity Price : 25.00
Evaluated at bid price : 25.20
Bid-YTW : -3.99 %