Archive for July, 2014

July 10, 2014

Thursday, July 10th, 2014

Looks like Canadian shadow banking is picking up:

Canada’s banks developed their commercial banking arms over decades by lending to companies that typically generate annual revenue of $50-million or less, nurturing scores of client relationships. Since the financial crisis, however, private equity firms have been scooping up smaller companies, shaking up their historical banking relationships.

Anatol von Hahn, Bank of Nova Scotia’s head of personal and commercial banking, said he would be “be very surprised if we don’t have double, triple” the number of small Canadian companies that are owned by private equity firms twenty years from now. Because they are flush with cash that they simply can’t sit on, private equity firms are often willing to pay big multiples to buy small businesses. “They’re playing a huge role,” he said.

To adapt to the changing dynamics, Scotiabank has gone so far as to invest in certain private equity funds in order to get access to the companies they acquire, according to Mr. von Hahn, allowing the bank to pitch itself as a potential banking partner.

The trend isn’t playing out in Canada alone. U.S. firms are looking for mid-market acquisitions north of the border. In May, New Jersey-based private equity player Swander Pace Capital acquired Montreal’s Recochem, marking its 10th acquisition north of the border in the past decade. More acquisitions could come because the firm recently raised a brand new $350-million fund.

Could we be heading towards European banking crisis redux?

Shares in Banco Espírito Santo SA … were suspended from trading Thursday after falling an additional 17%. Shares of the lender’s controlling shareholder, Espírito Santo Financial Group SA, were also suspended because, it said, of “ongoing material difficulties” at its parent company, Espírito Santo International. “ESFG is currently assessing the financial impact of its exposure to ESI.”

A spokesman for Espírito Santo International declined to comment.

This week’s downward spiral has knocked 32% off the bank’s market value and has dragged down Portugal’s main stock index with it.

On Thursday, the turmoil spread elsewhere in Southern Europe, illustrating how investors remain nervous about the fragility of the continent’s financial system. In Spain, a bank and a construction company each called off planned bond sales. In Italy, a drug company pulled its stock offering. In Greece, a government-bond sale came in smaller than expected. And stock markets across the continent fell, along with the euro.

It has been more than a year since fears about the health of a European bank rattled markets. Lately, after years of crisis, investors, bankers and regulators have been growing more confident about the stability of the continent’s financial system. Regulators hoped the banking industry’s improving health would be on display in coming months as they conduct so-called stress tests on more than 120 large banks.

Instead, Espírito Santo’s rapid descent, and the collateral damage in other European markets, suggests that conditions remain precarious.

Critics of Espírito Santo’s complex corporate structure have worried for years about the linkages among companies within the conglomerate. Among the concerns: whether the group’s nonfinancial companies—including a hotel chain and a hospital operator—were using the bank and its customers to raise funds.

Here in Ontario, our wise masters are protecting us from lower prices:

Ontario’s governing Liberals say they want to remove barriers to interprovincial trade, but suggest they’re reluctant to lift some restrictions that give Ontario companies an advantage.

Finance Minister Charles Sousa says there are a number of sectors within Ontario’s economy that are strong because they’re protected.

Sousa says he’s open to talks on how to grow the economy, but he doesn’t want to jeopardize the livelihood of Ontario companies.

Sousa’s comments come after the leaders of three western provinces called for the removal of trade barriers to reduce the cost of doing business and help provincial economies grow.

As far as I can tell, Mr. Sousa did not explain why strong companies need protection.

It was a mixed day for the Canadian preferred share market, with PerpetualDiscounts down 4bp, FixedResets gaining 14bp and DeemedRetractibles off 3bp. Volatility was average, but uniformly positive. Volume was below average overall, and concentrated in a handful of issues.

HIMIPref™ Preferred Indices
These values reflect the December 2008 revision of the HIMIPref™ Indices

Values are provisional and are finalized monthly
Index Mean
Current
Yield
(at bid)
Median
YTW
Median
Average
Trading
Value
Median
Mod Dur
(YTW)
Issues Day’s Perf. Index Value
Ratchet 3.14 % 3.13 % 22,179 19.40 1 0.0000 % 2,531.9
FixedFloater 4.15 % 3.43 % 28,342 18.45 1 -0.2179 % 4,138.9
Floater 2.87 % 2.95 % 46,425 19.86 4 0.1367 % 2,760.5
OpRet 4.02 % -5.05 % 86,525 0.08 1 0.0785 % 2,720.0
SplitShare 4.26 % 3.99 % 54,773 4.05 6 -0.0333 % 3,115.1
Interest-Bearing 0.00 % 0.00 % 0 0.00 0 0.0785 % 2,487.2
Perpetual-Premium 5.53 % -4.30 % 85,467 0.09 17 0.0417 % 2,425.6
Perpetual-Discount 5.25 % 5.18 % 110,158 15.23 20 -0.0449 % 2,571.2
FixedReset 4.39 % 3.59 % 200,106 4.61 76 0.1436 % 2,562.2
Deemed-Retractible 4.98 % 1.94 % 131,236 0.12 43 -0.0278 % 2,547.2
FloatingReset 2.66 % 2.15 % 109,597 3.89 6 -0.0723 % 2,514.5
Performance Highlights
Issue Index Change Notes
CU.PR.C FixedReset 1.13 % YTW SCENARIO
Maturity Type : Call
Maturity Date : 2017-06-01
Maturity Price : 25.00
Evaluated at bid price : 26.05
Bid-YTW : 2.65 %
RY.PR.L FixedReset 1.33 % YTW SCENARIO
Maturity Type : Call
Maturity Date : 2019-02-24
Maturity Price : 25.00
Evaluated at bid price : 26.76
Bid-YTW : 2.77 %
CIU.PR.C FixedReset 1.35 % YTW SCENARIO
Maturity Type : Limit Maturity
Maturity Date : 2044-07-10
Maturity Price : 22.24
Evaluated at bid price : 22.55
Bid-YTW : 3.38 %
BAM.PR.C Floater 1.42 % YTW SCENARIO
Maturity Type : Limit Maturity
Maturity Date : 2044-07-10
Maturity Price : 17.85
Evaluated at bid price : 17.85
Bid-YTW : 2.95 %
Volume Highlights
Issue Index Shares
Traded
Notes
TD.PF.A FixedReset 318,878 Nesbitt crossed 100,000 at 25.50. TD crossed blocks of 14,700 and 84,900 at the same price. Desjardins crossed 100,000 at the same price again.
YTW SCENARIO
Maturity Type : Call
Maturity Date : 2019-10-31
Maturity Price : 25.00
Evaluated at bid price : 25.51
Bid-YTW : 3.57 %
BMO.PR.T FixedReset 212,720 Nesbitt crossed two blocks of 50,000 each, both at 25.45. Scotia crossed blocks of 32,000 and 50,000 at the same price.
YTW SCENARIO
Maturity Type : Call
Maturity Date : 2019-08-25
Maturity Price : 25.00
Evaluated at bid price : 25.45
Bid-YTW : 3.61 %
BMO.PR.S FixedReset 192,599 RBC crossed blocks of 10,000 and 11,600 at 25.60. TD crossed 25,000 at 25.70. Nesbitt crossed blocks of 50,000 and 69,300, both at 25.70.
YTW SCENARIO
Maturity Type : Call
Maturity Date : 2019-05-25
Maturity Price : 25.00
Evaluated at bid price : 25.73
Bid-YTW : 3.55 %
CM.PR.M FixedReset 184,573 Called for redemption July 31.
YTW SCENARIO
Maturity Type : Call
Maturity Date : 2014-08-30
Maturity Price : 25.00
Evaluated at bid price : 24.97
Bid-YTW : 4.86 %
CM.PR.K FixedReset 181,858 Called for redemption July 31.
YTW SCENARIO
Maturity Type : Hard Maturity
Maturity Date : 2022-01-31
Maturity Price : 25.00
Evaluated at bid price : 24.98
Bid-YTW : 3.79 %
CM.PR.O FixedReset 176,412 Recent new issue.
YTW SCENARIO
Maturity Type : Call
Maturity Date : 2019-07-31
Maturity Price : 25.00
Evaluated at bid price : 25.51
Bid-YTW : 3.55 %
TD.PR.K FixedReset 144,299 Called for redemption July 31..
YTW SCENARIO
Maturity Type : Call
Maturity Date : 2014-08-30
Maturity Price : 25.00
Evaluated at bid price : 24.98
Bid-YTW : 4.29 %
NA.PR.S FixedReset 135,592 Scotia crossed blocks of 35,400 and 25,000, both at 25.56. National sold 28,400 to anonymous at 25.60. TD crossed 24,700 at 25.60.
YTW SCENARIO
Maturity Type : Call
Maturity Date : 2019-05-15
Maturity Price : 25.00
Evaluated at bid price : 25.62
Bid-YTW : 3.46 %
RY.PR.H FixedReset 126,715 Desjardins crossed 26,500 at 25.50 and blocks of 25,000 and 15,000 at 25.55. Scotia crossed 30,000 at 25.50.
YTW SCENARIO
Maturity Type : Call
Maturity Date : 2019-08-24
Maturity Price : 25.00
Evaluated at bid price : 25.50
Bid-YTW : 3.57 %
BNS.PR.Q FixedReset 125,406 RBC crossed 75,000 at 25.43; Desjardins crossed 50,000 at the same price.
YTW SCENARIO
Maturity Type : Call
Maturity Date : 2018-10-25
Maturity Price : 25.00
Evaluated at bid price : 25.44
Bid-YTW : 3.13 %
There were 20 other index-included issues trading in excess of 10,000 shares.
Wide Spread Highlights
Issue Index Quote Data and Yield Notes
PWF.PR.O Perpetual-Premium Quote: 26.15 – 26.45
Spot Rate : 0.3000
Average : 0.2062

YTW SCENARIO
Maturity Type : Call
Maturity Date : 2014-10-31
Maturity Price : 26.00
Evaluated at bid price : 26.15
Bid-YTW : 2.67 %

PWF.PR.A Floater Quote: 20.00 – 20.30
Spot Rate : 0.3000
Average : 0.2133

YTW SCENARIO
Maturity Type : Limit Maturity
Maturity Date : 2044-07-10
Maturity Price : 20.00
Evaluated at bid price : 20.00
Bid-YTW : 2.64 %

HSB.PR.D Deemed-Retractible Quote: 25.33 – 25.60
Spot Rate : 0.2700
Average : 0.1942

YTW SCENARIO
Maturity Type : Call
Maturity Date : 2014-12-31
Maturity Price : 25.00
Evaluated at bid price : 25.33
Bid-YTW : 2.49 %

SLF.PR.I FixedReset Quote: 26.13 – 26.40
Spot Rate : 0.2700
Average : 0.2059

YTW SCENARIO
Maturity Type : Call
Maturity Date : 2016-12-31
Maturity Price : 25.00
Evaluated at bid price : 26.13
Bid-YTW : 2.42 %

PWF.PR.P FixedReset Quote: 23.16 – 23.38
Spot Rate : 0.2200
Average : 0.1769

YTW SCENARIO
Maturity Type : Limit Maturity
Maturity Date : 2044-07-10
Maturity Price : 22.75
Evaluated at bid price : 23.16
Bid-YTW : 3.52 %

HSE.PR.A FixedReset Quote: 23.10 – 23.22
Spot Rate : 0.1200
Average : 0.0805

YTW SCENARIO
Maturity Type : Limit Maturity
Maturity Date : 2044-07-10
Maturity Price : 22.72
Evaluated at bid price : 23.10
Bid-YTW : 3.72 %

DGS.PR.A To Get Bigger

Thursday, July 10th, 2014

Brompton Group has announced:

Dividend Growth Split Corp. (the “Company”) is pleased to announce it has filed a preliminary short form prospectus with respect to a treasury offering of class A and preferred shares. The class A and preferred share offering prices will be set at levels that ensure that existing unitholders are not diluted.
Dividend Growth Split Corp. invests in a portfolio of common shares of high quality, large capitalization companies, which have among the highest dividend growth rates of those companies included in the S&P/TSX Composite Index. Currently, the portfolio consists of common shares of the following 20 companies:

Great-West Lifeco Inc. The Bank of Nova Scotia AGF Management Limited Shaw Communications Inc.
Industrial Alliance Insurance and Financial Services Inc. Canadian Imperial Bank of Commerce IGM Financial Inc. TELUS Corporation
Manulife Financial Corporation National Bank of Canada Power Corporation of Canada Canadian Utilities Limited
Sun Life Financial Inc. Royal Bank of Canada Manitoba Telecom Services Limited Enbridge Inc.
Bank of Montreal The Toronto-Dominion Bank Rogers Communications Inc. TransCanada Corporation

The investment objectives for the class A shares are to provide holders with regular monthly cash distributions targeted to be $0.10 per class A share and to provide the opportunity for growth in the net asset value per class A share.

The investment objectives for the preferred shares are to provide holders with fixed cumulative preferential quarterly cash distributions, currently in the amount of $0.13125 per preferred share, representing a yield on the original issue price of 5.25% per annum, and to return the original issue price to holders of preferred shares on the original November 30, 2014 maturity date.

On October 1, 2013, the Company announced an extension of the maturity date of the class A and preferred shares of the Company for an additional 5 year term to November 28, 2019, subject to extension for successive terms of up to 5 years. The preferred share dividend rate for the extended term will be announced at least 60 days prior to the original November 30, 2014 maturity date. The new dividend rate will be determined based on then-current market yields for preferred shares with similar terms.

The syndicate of agents for the offering is being led by RBC Capital Markets, CIBC, Scotiabank and TD Securities Inc. and includes BMO Capital Markets, National Bank Financial Inc., GMP Securities L.P., Raymond James Ltd., Canaccord Genuity Corp., Desjardins Securities Inc., Dundee Securities Ltd., Mackie Research Capital Corporation, and Manulife Securities Incorporated.

DGS.PR.A was last mentioned on PrefBlog when there was a similar offering in January.

DGS.PR.A is tracked by HIMIPref™ but is relegated to the Scraps index on credit concerns.

July 9, 2014

Thursday, July 10th, 2014

The National Securities Regulator has just gotten a little more national:

Two more provinces have agreed to join a voluntary national securities regulator expected to begin operations in the fall of 2015, bringing the total number on board to four and giving the upcoming capital markets watchdog a more pan-Canadian scope.

Sources say Saskatchewan and New Brunswick will sign on to the Cooperative Capital Markets Regulator Wednesday in a ceremony in Ottawa with federal Finance Minister Joe Oliver, embracing a plan backed by Ontario and British Columbia last September.

Marketwatch has a nice chart on market trends:

This chart shows how much money is flooding into investment vehicles — index mutual funds and exchange-traded funds — that track stock indexes. These two types of funds have grabbed about 24% of the U.S. mutual fund and ETF market, down from less than 5% in 1998, according to Deutsche Bank data.

Big full-service brokerages, “which control 50% of all invested household wealth in America, have successfully pushed the majority of their advisors’ practices toward more hands-off investing approaches,” said Josh Brown of The Reformed Broker in a recent blog post, referring to charging a flat percentage fee on assets, rather than commissions. “At the same time, do-it-yourselfers have made Vanguard, State Street and BlackRock’s iShares three of the world’s largest asset managers — and they are primarily purveyors of passive indexing products.”

cashFlows

There were modest gains for the Canadian preferred share market, with PerpetualDiscounts winning 7bp, FixedResets gaining 1bp and DeemedRetractibles up 2bp. Volatility was minimal. Volume was average.

PerpetualDiscounts now yield 5.17%, equivalent to 6.72% interest at the standard equivalency factor of 1.3x. Long corporates now yield about 4.3%, so the pre-tax interest-equivalent spread (in this context, the “Seniority Spread”) is now about 240bp, a slight (and perhaps spurious) narrowing from the 245bp reported July 2.

HIMIPref™ Preferred Indices
These values reflect the December 2008 revision of the HIMIPref™ Indices

Values are provisional and are finalized monthly
Index Mean
Current
Yield
(at bid)
Median
YTW
Median
Average
Trading
Value
Median
Mod Dur
(YTW)
Issues Day’s Perf. Index Value
Ratchet 3.14 % 3.13 % 22,987 19.41 1 -0.0418 % 2,531.9
FixedFloater 4.14 % 3.42 % 28,662 18.47 1 2.6846 % 4,148.0
Floater 2.87 % 2.98 % 46,793 19.80 4 0.2605 % 2,756.8
OpRet 4.02 % -4.25 % 87,763 0.08 1 -0.0392 % 2,717.9
SplitShare 4.26 % 4.01 % 56,618 4.05 6 0.0603 % 3,116.2
Interest-Bearing 0.00 % 0.00 % 0 0.00 0 -0.0392 % 2,485.2
Perpetual-Premium 5.53 % -2.41 % 85,341 0.09 17 -0.0231 % 2,424.6
Perpetual-Discount 5.25 % 5.17 % 111,585 15.23 20 0.0663 % 2,572.4
FixedReset 4.39 % 3.62 % 199,089 4.62 76 0.0076 % 2,558.5
Deemed-Retractible 4.98 % 1.63 % 136,042 0.13 43 0.0202 % 2,548.0
FloatingReset 2.66 % 2.13 % 110,761 3.86 6 0.0526 % 2,516.3
Performance Highlights
Issue Index Change Notes
CIU.PR.C FixedReset 1.04 % YTW SCENARIO
Maturity Type : Limit Maturity
Maturity Date : 2044-07-09
Maturity Price : 21.76
Evaluated at bid price : 22.25
Bid-YTW : 3.41 %
BAM.PR.G FixedFloater 2.68 % YTW SCENARIO
Maturity Type : Limit Maturity
Maturity Date : 2044-07-09
Maturity Price : 22.98
Evaluated at bid price : 22.95
Bid-YTW : 3.42 %
Volume Highlights
Issue Index Shares
Traded
Notes
BMO.PR.T FixedReset 334,546 Nesbitt crossed two blocks of 100,000 each, both at 25.45. RBC crossed blocks of 10,000 shares, 12,300 and 50,000, all at 25.45. TD crossed 40,000 at the same price.
YTW SCENARIO
Maturity Type : Call
Maturity Date : 2019-08-25
Maturity Price : 25.00
Evaluated at bid price : 25.44
Bid-YTW : 3.62 %
CM.PR.O FixedReset 201,900 Recent new issue.
YTW SCENARIO
Maturity Type : Call
Maturity Date : 2019-07-31
Maturity Price : 25.00
Evaluated at bid price : 25.43
Bid-YTW : 3.62 %
TD.PF.A FixedReset 168,241 TD crossed 100,000 at 25.47. Desjardins crossed 30,000 at the same price.
YTW SCENARIO
Maturity Type : Call
Maturity Date : 2019-10-31
Maturity Price : 25.00
Evaluated at bid price : 25.47
Bid-YTW : 3.60 %
RY.PR.H FixedReset 164,150 RBC crossed 50,000 at 25.45. TD crossed 30,000 at the same price; Nesbitt crossed 50,000 at the same price. CIBC sold 10,000 to anonymous at the same price again.
YTW SCENARIO
Maturity Type : Call
Maturity Date : 2019-08-24
Maturity Price : 25.00
Evaluated at bid price : 25.46
Bid-YTW : 3.61 %
ENB.PF.C FixedReset 133,597 Scotia crossed 75,400 at 25.12. RBC crossed 10,000 at 25.10.
YTW SCENARIO
Maturity Type : Limit Maturity
Maturity Date : 2044-07-09
Maturity Price : 23.16
Evaluated at bid price : 25.10
Bid-YTW : 4.20 %
BNS.PR.P FixedReset 132,946 RBC crossed 88,600 and 40,000, both at 25.46.
YTW SCENARIO
Maturity Type : Call
Maturity Date : 2018-04-25
Maturity Price : 25.00
Evaluated at bid price : 25.41
Bid-YTW : 2.84 %
There were 30 other index-included issues trading in excess of 10,000 shares.
Wide Spread Highlights
Issue Index Quote Data and Yield Notes
BAM.PR.B Floater Quote: 17.70 – 18.20
Spot Rate : 0.5000
Average : 0.3060

YTW SCENARIO
Maturity Type : Limit Maturity
Maturity Date : 2044-07-09
Maturity Price : 17.70
Evaluated at bid price : 17.70
Bid-YTW : 2.98 %

BAM.PR.G FixedFloater Quote: 22.95 – 23.95
Spot Rate : 1.0000
Average : 0.8072

YTW SCENARIO
Maturity Type : Limit Maturity
Maturity Date : 2044-07-09
Maturity Price : 22.98
Evaluated at bid price : 22.95
Bid-YTW : 3.42 %

CIU.PR.C FixedReset Quote: 22.25 – 22.84
Spot Rate : 0.5900
Average : 0.4280

YTW SCENARIO
Maturity Type : Limit Maturity
Maturity Date : 2044-07-09
Maturity Price : 21.76
Evaluated at bid price : 22.25
Bid-YTW : 3.41 %

RY.PR.L FixedReset Quote: 26.41 – 26.84
Spot Rate : 0.4300
Average : 0.2895

YTW SCENARIO
Maturity Type : Call
Maturity Date : 2019-02-24
Maturity Price : 25.00
Evaluated at bid price : 26.41
Bid-YTW : 3.08 %

BAM.PR.C Floater Quote: 17.60 – 17.95
Spot Rate : 0.3500
Average : 0.2904

YTW SCENARIO
Maturity Type : Limit Maturity
Maturity Date : 2044-07-09
Maturity Price : 17.60
Evaluated at bid price : 17.60
Bid-YTW : 3.00 %

GWO.PR.H Deemed-Retractible Quote: 23.87 – 24.05
Spot Rate : 0.1800
Average : 0.1219

YTW SCENARIO
Maturity Type : Hard Maturity
Maturity Date : 2025-01-31
Maturity Price : 25.00
Evaluated at bid price : 23.87
Bid-YTW : 5.47 %

Moody’s Assesses Canadian Banking System: Outlook Negative

Wednesday, July 9th, 2014

In a report available only to clients, Moody’s has stated:

Our outlook for the Canadian banking system has been changed to negative from stable to reflect the evolving support environment in Canada. The outlook expresses our expectation of how bank creditworthiness will evolve in this system over the next 12-18 months.

Our outlook for the Canadian banking system has been changed to negative from stable. This change reflects our view that the Canadian government’s plan to introduce a bail-in regime for senior debt combined with the accelerating global trend towards explicit inclusion of burden-sharing with senior debt holders as a means of reducing the public cost of bank resolutions could reduce the predictability of support being provided to the senior debt holders and uninsured depositors of the large Canadian banks.

Most rated Canadian banks’ long-term ratings benefit from at least two notches of uplift due to systemic support, which reflects our currently very high expectation that the government would provide support if required. On June 11, 2014 we affirmed the long-term ratings of the seven largest Canadian banks but changed the outlook to negative from stable on the supported senior debt and uninsured deposit ratings of these banks, to reflect the fact that the balance of risk has shifted to the downside for unsecured bank creditors given the Canadian government’s plans to implement a “bail-in” regime for domestic systemically important banks and the evolving global support environment.

The above-noted actions do not reflect any change in our assessment of the standalone credit profiles of the Canadian banks, all but one of which maintain their stable outlooks (see page 3).

July 8, 2014

Tuesday, July 8th, 2014

Banks engage in maturity transformation and this sometimes gets them in trouble. Many mutual funds and ETFs engage in liquidity transformation, and this is getting some people worried:

Junk-loan funds harbor a significant, structural risk that’s been masked by a three-year rally: Managers may struggle to raise enough cash to meet investor redemptions if too many try to get out at once.

While investors have plowed into the loan market by purchasing mutual-fund shares that trade daily, it typically takes more than two weeks for a money manager selling loans to get cash in exchange for the debt. The concern is that this discrepancy will make it difficult for fund investors to leave the $750 billion leveraged-loan market, where individuals have been playing a bigger role than ever.

“Should investor flows reverse, the mismatch in bank-loan funds could pose a material risk,” Moody’s Investors Service analysts led by Stephen Tu wrote in a July 7 report. “Methods to address sizable investor redemptions in bank loan funds are inadequate.”

In the US Regulation NMS is coming under attack:

The Securities and Exchange Commission’s rules for a national market system have come under scrutiny as lawmakers examine whether high-frequency traders have exploited changes introduced by regulators, exchanges and brokers. The SEC’s rules require all exchanges and brokers to connect to one another to ensure that investors receive the best available prices when they buy shares.

The Senate Banking Committee’s hearing today could intensify pressure on the SEC to change rules it enacted over the past decade. SEC Chair Mary Jo White has said the agency will examine whether its rules have pushed trading away from public markets in favor of private venues such as dark pools.

“The costs associated with maintaining access to each venue, retaining technologists and regulatory staff, and developing increasingly sophisticated risk controls are passed on to investors and result in unnecessary systemic risk,” exchange operator Intercontinental Exchange Inc. (ICE) Chief Executive Officer Jeffrey Sprecher told lawmakers.

Certainly, requirements that everybody connect everywhere are ridiculous; antithetical to the entire concept of competition. It will be quite enough if brokerages disclose the names of the exchanges to which they connect directly and those to which they are indirectly connected by virtue of jitney arrangements with other brokers.

It was an off day for the Canadian preferred share market, with PerpetualDiscounts and DeemedRetractibles both off 2bp and FixedResets down 16bp. The Performance Highlights table is dominated by losing Enbridge issues (which saw yet another new issue announcement today) and winning Power Financial issues (which went ex-dividend). Volume was low.

HIMIPref™ Preferred Indices
These values reflect the December 2008 revision of the HIMIPref™ Indices

Values are provisional and are finalized monthly
Index Mean
Current
Yield
(at bid)
Median
YTW
Median
Average
Trading
Value
Median
Mod Dur
(YTW)
Issues Day’s Perf. Index Value
Ratchet 3.14 % 3.13 % 22,246 19.41 1 0.8435 % 2,533.0
FixedFloater 4.25 % 3.53 % 28,399 18.26 1 -0.2677 % 4,039.5
Floater 2.88 % 2.99 % 46,246 19.79 4 -0.4776 % 2,749.6
OpRet 4.02 % -4.85 % 86,468 0.08 1 -0.4297 % 2,719.0
SplitShare 4.68 % 4.00 % 84,899 4.06 7 -0.1139 % 3,114.3
Interest-Bearing 0.00 % 0.00 % 0 0.00 0 -0.4297 % 2,486.2
Perpetual-Premium 5.53 % -6.52 % 81,712 0.09 17 0.1068 % 2,425.1
Perpetual-Discount 5.25 % 5.16 % 113,007 15.23 20 -0.0242 % 2,570.7
FixedReset 4.39 % 3.65 % 202,939 4.62 76 -0.1598 % 2,558.3
Deemed-Retractible 4.98 % 1.83 % 135,252 0.14 43 -0.0194 % 2,547.4
FloatingReset 2.66 % 2.15 % 114,976 3.86 6 -0.0329 % 2,515.0
Performance Highlights
Issue Index Change Notes
ENB.PR.F FixedReset -1.40 % YTW SCENARIO
Maturity Type : Limit Maturity
Maturity Date : 2044-07-08
Maturity Price : 23.13
Evaluated at bid price : 24.65
Bid-YTW : 4.09 %
ENB.PF.A FixedReset -1.29 % YTW SCENARIO
Maturity Type : Limit Maturity
Maturity Date : 2044-07-08
Maturity Price : 23.19
Evaluated at bid price : 25.17
Bid-YTW : 4.19 %
ENB.PR.B FixedReset -1.25 % YTW SCENARIO
Maturity Type : Limit Maturity
Maturity Date : 2044-07-08
Maturity Price : 23.23
Evaluated at bid price : 24.56
Bid-YTW : 4.03 %
BAM.PF.E FixedReset -1.02 % YTW SCENARIO
Maturity Type : Limit Maturity
Maturity Date : 2044-07-08
Maturity Price : 23.16
Evaluated at bid price : 25.11
Bid-YTW : 4.10 %
PWF.PR.K Perpetual-Discount 1.04 % YTW SCENARIO
Maturity Type : Limit Maturity
Maturity Date : 2044-07-08
Maturity Price : 23.73
Evaluated at bid price : 24.00
Bid-YTW : 5.15 %
PWF.PR.L Perpetual-Discount 1.13 % YTW SCENARIO
Maturity Type : Limit Maturity
Maturity Date : 2044-07-08
Maturity Price : 24.12
Evaluated at bid price : 24.61
Bid-YTW : 5.16 %
CIU.PR.C FixedReset 1.43 % YTW SCENARIO
Maturity Type : Limit Maturity
Maturity Date : 2044-07-08
Maturity Price : 21.61
Evaluated at bid price : 22.02
Bid-YTW : 3.46 %
Volume Highlights
Issue Index Shares
Traded
Notes
ENB.PF.C FixedReset 300,831 RBC crossed blocks of 65,000 and 10,000, both at 25.10. TD crossed blocks of two blocks of 25,000 shares each and one of 34,600 at the same price. Nesbitt crossed 14,800 at the same price again.
YTW SCENARIO
Maturity Type : Limit Maturity
Maturity Date : 2044-07-08
Maturity Price : 23.16
Evaluated at bid price : 25.11
Bid-YTW : 4.20 %
BNA.PR.F SplitShare 191,265 Recent new issue. I understand there was an inventory blow-out sale today.
YTW SCENARIO
Maturity Type : Hard Maturity
Maturity Date : 2021-10-08
Maturity Price : 25.00
Evaluated at bid price : 24.41
Bid-YTW : 4.91 %
ENB.PR.J FixedReset 130,410 Nesbitt crossed blocks of 16,100 and 100,000, both at 25.19.
YTW SCENARIO
Maturity Type : Limit Maturity
Maturity Date : 2044-07-08
Maturity Price : 23.25
Evaluated at bid price : 25.19
Bid-YTW : 4.11 %
BMO.PR.T FixedReset 94,125 Recent new issue.
YTW SCENARIO
Maturity Type : Call
Maturity Date : 2019-08-25
Maturity Price : 25.00
Evaluated at bid price : 25.40
Bid-YTW : 3.65 %
MFC.PR.L FixedReset 85,730 Nesbitt crossed 70,000 at 25.18.
YTW SCENARIO
Maturity Type : Hard Maturity
Maturity Date : 2025-01-31
Maturity Price : 25.00
Evaluated at bid price : 25.11
Bid-YTW : 3.83 %
HSE.PR.A FixedReset 84,044 Nesbitt crossed 75,000 at 23.14.
YTW SCENARIO
Maturity Type : Limit Maturity
Maturity Date : 2044-07-08
Maturity Price : 22.65
Evaluated at bid price : 23.02
Bid-YTW : 3.73 %
There were 23 other index-included issues trading in excess of 10,000 shares.
Wide Spread Highlights
Issue Index Quote Data and Yield Notes
CU.PR.E Perpetual-Discount Quote: 24.16 – 24.60
Spot Rate : 0.4400
Average : 0.2932

YTW SCENARIO
Maturity Type : Limit Maturity
Maturity Date : 2044-07-08
Maturity Price : 23.77
Evaluated at bid price : 24.16
Bid-YTW : 5.11 %

BAM.PR.G FixedFloater Quote: 22.35 – 23.09
Spot Rate : 0.7400
Average : 0.5958

YTW SCENARIO
Maturity Type : Limit Maturity
Maturity Date : 2044-07-08
Maturity Price : 22.53
Evaluated at bid price : 22.35
Bid-YTW : 3.53 %

IGM.PR.B Perpetual-Premium Quote: 25.75 – 26.08
Spot Rate : 0.3300
Average : 0.2295

YTW SCENARIO
Maturity Type : Call
Maturity Date : 2018-12-31
Maturity Price : 25.00
Evaluated at bid price : 25.75
Bid-YTW : 5.08 %

BAM.PF.A FixedReset Quote: 25.78 – 26.02
Spot Rate : 0.2400
Average : 0.1481

YTW SCENARIO
Maturity Type : Call
Maturity Date : 2018-09-30
Maturity Price : 25.00
Evaluated at bid price : 25.78
Bid-YTW : 3.74 %

MFC.PR.F FixedReset Quote: 23.29 – 23.75
Spot Rate : 0.4600
Average : 0.3770

YTW SCENARIO
Maturity Type : Hard Maturity
Maturity Date : 2025-01-31
Maturity Price : 25.00
Evaluated at bid price : 23.29
Bid-YTW : 4.10 %

RY.PR.A Deemed-Retractible Quote: 25.49 – 25.74
Spot Rate : 0.2500
Average : 0.1682

YTW SCENARIO
Maturity Type : Call
Maturity Date : 2014-08-07
Maturity Price : 25.25
Evaluated at bid price : 25.49
Bid-YTW : -0.55 %

New Issue: ENB FixedReset 4.40%+266

Tuesday, July 8th, 2014

Holy Smokes, Enbridge just keeps pounding them out!

Enbridge Inc. has announced:

that it has entered into an agreement with a group of underwriters to sell ten million Cumulative Redeemable Preference Shares, Series 13 (the “Series 13 Preferred Shares”) at a price of $25.00 per share for distribution to the public. Closing of the offering is expected on July 17, 2014.

The holders of Series 13 Preferred Shares will be entitled to receive fixed cumulative dividends at an annual rate of $1.10 per share, payable quarterly on the first day of March, June, September and December, as and when declared by the Board of Directors of Enbridge, yielding 4.40 per cent per annum, for the initial fixed rate period to but excluding June 1, 2020. The first quarterly dividend payment date is scheduled for December 1, 2014. The dividend rate will reset on June 1, 2020 and every five years thereafter at a rate equal to the sum of the then five-year Canadian Government bond yield plus 2.66 per cent. The Series 13 Preferred Shares are redeemable by Enbridge, at its option, on June 1, 2020 and on June 1 of every fifth year thereafter.

The holders of Series 13 Preferred Shares will have the right to convert their shares into Cumulative Redeemable Preference Shares, Series 14 (the “Series 14 Preferred Shares”), subject to certain conditions, on June 1, 2020 and on June 1 of every fifth year thereafter. The holders of Series 14 Preferred Shares will be entitled to receive quarterly floating rate cumulative dividends, as and when declared by the Board of Directors of Enbridge, at a rate equal to the sum of the 90-day Government of Canada Treasury bill rate plus 2.66 per cent.

Enbridge has granted to the underwriters an option, exercisable at any time up to 48 hours prior to the closing of the offering, to purchase up to an additional two million Series 13 Preferred Shares at a price of $25.00 per share.

The offering is being made only in Canada by means of a prospectus supplement to the base shelf prospectus of the Corporation dated June 6, 2013. Proceeds will be used to partially fund capital projects, to reduce existing indebtedness and for other general corporate purposes of the Corporation and its affiliates.

The syndicate of underwriters is led by CIBC World Markets, RBC Capital Markets, TD Securities, and Scotiabank.

That’s a nice long first coupon – there may be some dividend capture possibilities in November!

Later, they announced:

that as a result of strong investor demand for its previously announced offering of Cumulative Redeemable Preference Shares, Series 13 (the “Series 13 Preferred Shares”), the size of the offering has been increased to 14 million Series 13 Preferred Shares. The aggregate gross proceeds will be C$350 million. Closing of the offering is expected on July 17, 2014.

Update, 2014-7-11: Rated Pfd-2(low) [Stable] by DBRS.

July 7, 2014

Monday, July 7th, 2014

For all the recent hope about the US – given its recent jobs number – the rest of the world isn’t doing all that well:

International Monetary Fund Managing Director Christine Lagarde signaled a cut in the institution’s global growth forecasts, saying investment is still weak and that risks remain in the U.S. even as its rebound accelerates.

“The global economy is gathering speed, though the pace may be a bit less than we previously predicted because the growth potential is lower and investment” spending remains lackluster, Lagarde told the Cercle des Economistes conference in Aix-en-Provence, France.

The remarks underline the threats to global economic growth at a time when the U.S. Federal Reserve is trimming stimulus and the European Central Bank is fighting inflation that is less than half its targeted level. The IMF is preparing to update its economic forecasts this month after predicting April 8 that the global economy will expand 3.6 percent this year and 3.9 percent in 2015.

In the meantime, all the new rules are disrupting the repo market:

The Federal Reserve’s bond purchases combined with demand from banks to meet tightened regulatory requirements is making it harder for traders to easily borrow and lend certain desired securities in the $1.6 trillion-a-day market for repurchase agreements. That’s causing such trades to go uncompleted at some of the highest rates since the financial crisis.

Disruptions in so-called repos, which Wall Street’s biggest banks rely on for their day-to-day financing needs, are another unintended consequence of extraordinary central-bank policies that pulled the economy out of the worst financial crisis since the Great Depression. They also belie the stability projected by bond yields at about record lows.

Negative rates happen when certain Treasuries are in such high demand or short supply that lenders of cash are actually paying collateral providers interest so they can obtain the needed securities. Traders said that is a big reason why repo rates on desired Treasuries have recently gotten as low as negative 3 percent.

Now, more repo trades are going uncompleted, or failing, because it’s either too difficult or expensive for the borrower to obtain and deliver Treasuries. Such failures to deliver Treasuries have averaged $65.6 billion a week this year, reaching as much as $197.6 billion in the week ended June 18, Fed data show.

Uncompleted trades averaged $51.6 billion in 2013, and $28.8 billion in 2012, according to the Fed.

“The effect of all the collateral issues we see now is an indication of not so much how things are, but how bad things will be when you really need liquidity,” said Jeffrey Snider, chief investment strategist at West Palm Beach, Florida-based Alhambra Investment Partners LLC, in a telephone interview June 30. “That’s when you get into potentially dire situations.”

The conditions for repo stress were on display last month. The 2.5 percent note due in May 2024 reached negative 3 percentage points in repo in the days preceding a June 11 Treasury auction of $21 billion in notes to finance government operations.

Repo rates have been most prone to go negative, a situation known as specials in the market, in the days preceding an auction as traders who previously sold the debt seek to buy the securities to cover those positions.

Those fascinated by the topic might want to read the New York Fed paper Key Mechanics of The U.S. Tri-Party Repo Market.

League Assets Corp. and its IGW REIT have given us what may well be a foretaste of the market’s next disaster – private equity:

League made a name for itself by telling investors that their money was safer within a private REIT because it wouldn’t be subject to fluctuations in the public markets. However, cracks started to show over the past few years, and major caution flags were raised in 2013 when League tried to restructure itself by going public. Some investors worried that tapping new, unknowing public investors for fresh funds was the only way League would be able to resolve its cash crunch. (The detailed story of League’s rise and fall was reported in Report on Business Magazine earlier this year.)

Since League filed for protection under the Companies’ Creditors Arrangement Act, PwC has tried to untangle the company’s complex structure and determine who would get paid what. Through this process, the firm concluded that the following were the main problems that led to League’s undoing:

At the time of its CCAA filing, League hoped it would be able to restructure itself and continue operating. PwC disagreed. Instead, all of the buildings are being sold off, and only two have yet to be sold. While this process has generated funds to help pay back creditors and investors, it has only generated $235-million because League had to sell its properties in what has quickly become a weak commercial property market.

Norm Cham of the SEC had this to say about Private Equity recently:

There is no single methodology for determining the fair value of a security or other asset because fair value depends upon the facts and circumstances of each situation. As a general principle, however, the fair value of a security or other asset held by a fund would be the amount that the fund might reasonably expect to receive for the security or other asset upon its current sale. When determining the fair value of a security or other asset held by an alternative mutual fund, all indications of value that are available must be taken into account.[6] One key to effective valuation is the development of robust valuation policies and procedures. Issues that alternative mutual fund managers may consider addressing in their policies and procedures include: (1) the requirement that the fund monitor for circumstances that may necessitate the use of fair value prices, (2) the provision of a methodology by which a fund determines fair value, (3) the process for price overrides, (4) assurance that controls are in place to review, monitor and approve all overrides in a timely manner, and (5) the prompt notification to, and review and approval by, persons not directly involved in portfolio management to mitigate conflicts of interest.[7]

In other words … “tick the box”. And the blind led the blind into the abyss.

Japan has learned nothing from the western solar energy boondoggle:

The Japanese government’s subsidy program originally paid about triple the amount Germany extended for its solar industries.

Japan approved a cut in tariffs for solar power as a building boom meant the technology made up 97 percent of new renewable capacity since it offered incentives.

The tariff was reduced in April 2013 to 37.8 yen per kilowatt hour from 42 yen. Japan’s method of subsidy for the industry is similar to the program Germany, Spain and the U.K. implemented, offering an above-market rate for solar power.

Japan gave final approval in March for the 11 percent cut to 32 yen a kilowatt-hour for the 20 years from the fiscal year starting April and offered 36 yen for offshore wind, the Ministry of Economy, Trade and Industry said in a statement.

The recent Ontari-ari-ari-Owe election has brought with it the promise of a new fund that will provide citizens with extra pension income – provided, of course, that all the Ontario Bonds this fund will buy doesn’t go bust! The US Treasury has other ideas:

Retirees with 401(k) plans and individual retirement accounts will have more flexibility to purchase annuities that don’t start paying out until age 80 or 85, under final rules from the U.S. Treasury Department.

The rules announced today provide a new way for retirees to limit the drawdowns of their account balances that are now required starting after age 70 1/2. Instead, under the rules, they could use as much as 25 percent of their account balances up to $125,000 to purchase deferred annuities.

The Treasury Department’s final rules give the government’s blessing to the concept of longevity insurance, which hasn’t taken hold in the market, in part because of the required distribution rules and because of relatively high fees that deter potential purchasers.

In 2013, deferred income annuities were a $2.2 billion market, less than 1 percent of all annuity sales, according to the Limra Secure Retirement Institute. Deferred income annuity sales have more than doubled for each of the past two years.

A man who purchases a deferred annuity at age 60 for $50,000 can receive $17,614 in annual income for life starting at age 80, according to New York Life.

And that’s with today’s rates!

There was little overall movement in the Canadian preferred share market today, with PerpetualDiscounts and FixedResets both up 2bp and DeemedRetractibles flat. Volatility was minimal. Volume was average.

HIMIPref™ Preferred Indices
These values reflect the December 2008 revision of the HIMIPref™ Indices

Values are provisional and are finalized monthly
Index Mean
Current
Yield
(at bid)
Median
YTW
Median
Average
Trading
Value
Median
Mod Dur
(YTW)
Issues Day’s Perf. Index Value
Ratchet 3.16 % 3.15 % 23,152 19.34 1 -0.9607 % 2,511.8
FixedFloater 4.24 % 3.52 % 28,202 18.28 1 0.2685 % 4,050.4
Floater 2.87 % 2.97 % 46,804 19.83 4 -0.6507 % 2,762.8
OpRet 4.00 % -10.02 % 86,887 0.08 1 0.3922 % 2,730.7
SplitShare 4.68 % 4.05 % 85,835 4.06 7 -0.1012 % 3,117.9
Interest-Bearing 0.00 % 0.00 % 0 0.00 0 0.3922 % 2,496.9
Perpetual-Premium 5.51 % -4.45 % 80,883 0.08 17 0.0023 % 2,422.5
Perpetual-Discount 5.24 % 5.18 % 111,872 15.02 20 0.0192 % 2,571.3
FixedReset 4.38 % 3.64 % 202,583 4.48 76 0.0223 % 2,562.4
Deemed-Retractible 4.98 % 1.94 % 129,854 0.14 43 0.0028 % 2,547.9
FloatingReset 2.66 % 2.14 % 115,813 3.86 6 0.2967 % 2,515.8
Performance Highlights
Issue Index Change Notes
BAM.PR.X FixedReset -1.34 % YTW SCENARIO
Maturity Type : Limit Maturity
Maturity Date : 2044-07-07
Maturity Price : 21.84
Evaluated at bid price : 22.11
Bid-YTW : 4.06 %
BAM.PR.B Floater -1.17 % YTW SCENARIO
Maturity Type : Limit Maturity
Maturity Date : 2044-07-07
Maturity Price : 17.68
Evaluated at bid price : 17.68
Bid-YTW : 2.98 %
BAM.PR.C Floater -1.11 % YTW SCENARIO
Maturity Type : Limit Maturity
Maturity Date : 2044-07-07
Maturity Price : 17.75
Evaluated at bid price : 17.75
Bid-YTW : 2.97 %
Volume Highlights
Issue Index Shares
Traded
Notes
ENB.PF.C FixedReset 136,141 RBC crossed 38,600 at 25.33; Nesbitt crossed 20,000 at the same price.
YTW SCENARIO
Maturity Type : Limit Maturity
Maturity Date : 2044-07-07
Maturity Price : 23.23
Evaluated at bid price : 25.33
Bid-YTW : 4.15 %
BAM.PF.F FixedReset 130,800 RBC crossed 126,800 at 25.44.
YTW SCENARIO
Maturity Type : Call
Maturity Date : 2019-09-30
Maturity Price : 25.00
Evaluated at bid price : 25.48
Bid-YTW : 4.20 %
GWO.PR.S Deemed-Retractible 118,960 Nesbitt crossed 100,000 at 25.50.
YTW SCENARIO
Maturity Type : Hard Maturity
Maturity Date : 2025-01-31
Maturity Price : 25.00
Evaluated at bid price : 25.50
Bid-YTW : 5.12 %
TD.PR.I FixedReset 112,443 Called for redemption July 31.
YTW SCENARIO
Maturity Type : Call
Maturity Date : 2014-08-30
Maturity Price : 25.00
Evaluated at bid price : 24.99
Bid-YTW : 3.77 %
HSE.PR.A FixedReset 107,116 Nesbitt crossed 102,700 at 23.18.
YTW SCENARIO
Maturity Type : Limit Maturity
Maturity Date : 2044-07-07
Maturity Price : 22.75
Evaluated at bid price : 23.13
Bid-YTW : 3.71 %
CM.PR.K FixedReset 101,265 Called for redemption July 31.
YTW SCENARIO
Maturity Type : Call
Maturity Date : 2014-08-30
Maturity Price : 25.00
Evaluated at bid price : 24.98
Bid-YTW : 3.64 %
There were 30 other index-included issues trading in excess of 10,000 shares.
Wide Spread Highlights
Issue Index Quote Data and Yield Notes
CU.PR.C FixedReset Quote: 25.86 – 26.50
Spot Rate : 0.6400
Average : 0.3785

YTW SCENARIO
Maturity Type : Call
Maturity Date : 2017-06-01
Maturity Price : 25.00
Evaluated at bid price : 25.86
Bid-YTW : 2.91 %

BAM.PR.G FixedFloater Quote: 22.41 – 23.00
Spot Rate : 0.5900
Average : 0.4378

YTW SCENARIO
Maturity Type : Limit Maturity
Maturity Date : 2044-07-07
Maturity Price : 22.58
Evaluated at bid price : 22.41
Bid-YTW : 3.52 %

MFC.PR.H FixedReset Quote: 26.26 – 27.50
Spot Rate : 1.2400
Average : 1.1003

YTW SCENARIO
Maturity Type : Call
Maturity Date : 2017-03-19
Maturity Price : 25.00
Evaluated at bid price : 26.26
Bid-YTW : 2.75 %

MFC.PR.F FixedReset Quote: 23.37 – 23.77
Spot Rate : 0.4000
Average : 0.2859

YTW SCENARIO
Maturity Type : Hard Maturity
Maturity Date : 2025-01-31
Maturity Price : 25.00
Evaluated at bid price : 23.37
Bid-YTW : 4.06 %

ELF.PR.H Perpetual-Discount Quote: 24.64 – 25.00
Spot Rate : 0.3600
Average : 0.2481

YTW SCENARIO
Maturity Type : Limit Maturity
Maturity Date : 2044-07-07
Maturity Price : 24.22
Evaluated at bid price : 24.64
Bid-YTW : 5.59 %

CU.PR.D Perpetual-Discount Quote: 24.20 – 24.75
Spot Rate : 0.5500
Average : 0.4449

YTW SCENARIO
Maturity Type : Limit Maturity
Maturity Date : 2044-07-07
Maturity Price : 23.81
Evaluated at bid price : 24.20
Bid-YTW : 5.10 %

DBRS Confirms All Big-6 Banks

Monday, July 7th, 2014

DBRS has confirmed RY at Pfd-2 (high) [NVCC non-compliant] and Pfd-2 [NVCC compliant]:

Like its other Canadian peers, the Bank has exposure to the Canadian residential mortgage market and other real estate lending. A slowdown in these markets may slow earnings generation, while a downturn in the residential mortgage or commercial real estate markets could hurt asset quality indicators and ultimately have an impact on provisioning levels.

The Bank’s Deposits & Senior Debt rating of AA is composed of an intrinsic assessment of AA (low) and a support assessment of SA2 (reflecting the expectation of systemic and timely external support by the Government of Canada). The SA2 support assessment results in a one-notch benefit to the Issuer Rating and the Deposits & Senior Debt and Subordinated Debt ratings.

confirmed TD at Pfd-2(high) / Pfd-2:

Like its other Canadian peers, the Bank has exposure to the Canadian residential mortgage market and other real estate lending. A slowdown in these markets may slow earnings generation, while a downturn in the residential mortgage or commercial real estate markets could hurt asset quality indicators and ultimately have an impact on provisioning levels.

TD’s Deposits & Senior Debt rating of AA is composed of an intrinsic assessment of AA (low) and a support assessment of SA2 (reflecting the expectation of systemic and timely external support by the Government of Canada). The SA2 ranking results in a one-notch benefit to the Issuer Rating and the Deposits & Senior Debt and Subordinated Debt ratings.

NA at Pfd-2 / Pfd-2(low):

Like its other Canadian peers, the Bank has exposure to the Canadian residential mortgage market and other real estate lending. A slowdown in these markets may slow earnings generation, while a downturn in the residential mortgage or commercial real estate markets could hurt asset quality indicators and ultimately have an impact on provisioning levels.

National’s Deposits & Senior Debt rating of AA (low) is composed of an intrinsic assessment of A (high) and a support assessment of SA2 (reflecting the expectation of systemic and timely external support by the Government of Canada), which results in a one-notch increase from the intrinsic assessment to the Issuer Rating and the Deposits & Senior Debt and Subordinated Debt ratings.

BMO at Pfd-2(high) / Pfd-2:

Like its other Canadian peers, the Bank has exposure to the Canadian residential mortgage market and other real estate lending. A slowdown in these markets may slow earnings generation, while a downturn in the residential mortgage or commercial real estate markets could hurt asset quality indicators and ultimately have an impact on provisioning levels.

BMO’s long-term Deposits & Senior Debt rating of AA is composed of an intrinsic assessment of AA (low) and a support assessment of SA2 (reflecting the expectation of systemic and timely external support by the Government of Canada). The SA2 status results in a one-notch benefit to the senior debt and deposits and subordinated debt ratings.

CM at Pfd-2(high) / Pfd-2 (CM’s last non-compliant issues will be called July 31):

Like its other Canadian peers, the Bank has exposure to the Canadian residential mortgage market and other real estate lending. A slowdown in these markets may slow earnings generation, while a downturn in the residential mortgage or commercial real estate markets could hurt asset quality indicators and ultimately have an impact on provisioning levels.

CIBC’s long-term Deposits & Senior Debt rating at AA is composed of its assigned intrinsic assessment of AA (low) and its support assessment of SA2 (reflecting the expectation of systemic and timely external support by the Government of Canada). The SA2 ranking results in a one-notch benefit to the senior debt and deposits and subordinated debt ratings.

and finally BNS at Pfd-2(high) (BNS doesn’t have any NVCC-compliant issues yet):

Like its other Canadian bank peers, Scotiabank has exposure to the Canadian residential mortgage market and other real estate lending. A slowdown in these markets may slow earnings generation, while a downturn in the residential mortgage or commercial real estate markets could hurt asset quality indicators and ultimately have an impact on provisioning levels. Scotiabank’s long-term deposits and senior debt rating, at AA, is composed of its intrinsic assessment of AA (low) and its support assessment of SA2 (reflecting the expectation of systemic and timely external support by the Government of Canada). The SA2 ranking results in a one-notch benefit to the Deposits & Senior Debt and Subordinated Debt ratings.

TXPR / TXPL Index Revision

Monday, July 7th, 2014

S&P Dow Jones Indices Canadian Index Operations has announced:

the following index changes as a result of the quarterly S&P/TSX Preferred Share Index and S&P/TSX Preferred Share Laddered Index Reviews. These changes will be effective at the open on Monday, July 21, 2014.

S&P/TSX Preferred Share Index

ADDITIONS
Symbol Issue Name CUSIP
BMO.PR.S Bank of Montreal 4.00% Class B Preferred Series 27 063679 40 1
BMO.PR.T Bank of Montreal 3.90% Class B Preferred Series 29 063679 60 9
BAM.PF.F Brookfield Asset Management Inc. 4.50% Class A Preferred Series 40 112585 53 4
CM.PR.O CIBC 3.90% Class A Preferred Series 39 136069 44 0
EMA.PR.F Emera Inc. 4.25% First Preferred Series F 290876 80 4
ENB.PF.C Enbridge Inc. 4.40% Preferred Series 11 29250N 59 2
GWO.PR.S Great-West Lifeco Inc. 5.25% First Preferred Series S 39138C 73 4
LB.PR.H Laurentian Bank of Canada 4.30% Class A Preferred Series 13 51925D 82 5
RY.PR.H Royal Bank of Canada 3.90% Preferred Series BB 78012H 56 7
TD.PF.A Toronto-Dominion Bank 3.90% Class A First Preferred Series 1 891145 69 0
DELETIONS
Symbol Issue Name CUSIP
AQN.PR.A Algonquin Power & Utilities Corp. 4.50% Preferred Series A 015857 30 3
BMO.PR.K Bank of Montreal 5.25% Class B Preferred Series 14 063671 14 3
BCE.PR.C BCE Inc. 3.55% First Preferred Series AC 05534B 78 6
BCE.PR.T BCE Inc. 3.39% First Preferred Series T 05534B 81 0
HSB.PR.D HSBC Bank Canada 5.00% Class 1 Preferred Series D 40427H 70 7
LB.PR.F Laurentian Bank of Canada 4.00% Class A Preferred Series 11 51925D 84 1

S&P/TSX Preferred Share Laddered Index

ADDITIONS
Symbol Issue Name CUSIP
BMO.PR.S Bank of Montreal 4.00% Class B Preferred Series 27 063679 40 1
BMO.PR.T Bank of Montreal 3.90% Class B Preferred Series 29 063679 60 9
BAM.PF.F Brookfield Asset Management Inc. 4.50% Class A Preferred Series 40 112585 53 4
CM.PR.O CIBC 3.90% Class A Preferred Series 39 136069 44 0
LB.PR.H Laurentian Bank of Canada 4.30% Class A Preferred Series 13 51925D 82 5
RY.PR.H Royal Bank of Canada 3.90% Preferred Series BB 78012H 56 7
TD.PF.A Toronto-Dominion Bank 3.90% Class A First Preferred Series 1 891145 69 0
DELETIONS
Symbol Issue Name CUSIP
BAM.PR.G Brookfield Asset Management Inc. 3.80% Class A Preferred Series 9 112585 60 9

It is interesting to see that BAM.PR.G will be deleted from TXPL. This issue is already dirt-cheap compared to its Strong Pair, BAM.PR.E, according to the calculator.

MAPF Performance: June 2014

Sunday, July 6th, 2014

The fund underperformed the BMO-CM “50” and TXPL indices in June, but was about even with TXPR.

relPerf_140630
Click for Big

relYield_140630
Click for Big

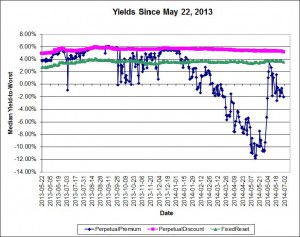
I continue to believe that the decline in the preferred share market remains overdone; the following table shows the increase in yields since May 22 of some fixed income sectors:

Yield Changes
May 22, 2013
to
June 30, 2014
Sector Yield
May 22
2013
Yield
May 30
2014
Change
Five-Year Canadas 1.38% 1.53% +15bp
Long Canadas 2.57% 2.78% +21bp
Long Corporates 4.15% 4.3% +15bp
FixedResets
Investment Grade
(Interest Equivalent)
3.51% 4.67% +116bp
Perpetual-Discounts
Investment Grade
(Interest Equivalent)
6.34% 6.70% +26bp
The change in yield of PerpetualDiscounts is understated due a massive influx of issues from the PerpetualPremium sub-index over the period, which improved credit quality. When the four issues that comprised the PerpetualDiscount sub-index as of May 22, 2013 are evaluated as of June 30, 2014, the interest-equivalent yield is 7.25% and thus the change is +91bp.

ZPR, is an ETF comprised of FixedResets and Floating Rate issues and a very high proportion of junk issues, returned XXX%, XXX% and XXX% over the past one-, three- and twelve-month periods, respectively (according to the fund’s data), versus returns for the TXPL index of +1.65%, +2.51% and +2.10% respectively. The fund has been able to attract assets of about $1,044-million since inception in November 2012; AUM increased by $31-million in June; given an index return of 1.65% an increase of $16.7-million was expected, indicating that money is still flowing into the fund. I feel that the flows into and out of this fund are very important in determining the performance of its constituents.

TXPR had returns over one- and three-months of +1.38% and +2.66%, respectively with CPD performance within expectations.

Returns for the HIMIPref™ investment grade sub-indices for June were as follows:

HIMIPref™ Indices
Performance to June 30, 2014
Sub-Index 1-Month 3-month
Ratchet N/A N/A
FixFloat +4.81% +9.70%
Floater +1.36% +3.86%
OpRet +0.41% +1.22%
SplitShare +0.20% +1.27%
Interest N/A N/A
PerpetualPremium +0.51% +2.08%
PerpetualDiscount +0.65% +4.49%%
FixedReset +1.55% +1.54%
DeemedRetractible +1.05% +2.91%
FloatingReset +1.03% +2.16%

Malachite Aggressive Preferred Fund’s Net Asset Value per Unit as of the close June 30, 2014, was $10.5877 after a distribution of 0.128251.

Returns to June 30, 2014
Period MAPF BMO-CM “50” Index TXPR
Total Return
CPD – according to Blackrock
One Month +1.39% +1.56% +1.38% +1.34%
Three Months +4.82% +2.42% +2.66% +2.53%
One Year +7.93% +3.40% +3.43% +2.97%
Two Years (annualized) +7.03% +3.21% +2.96% N/A
Three Years (annualized) +4.59% +3.67% +3.30% +2.78%
Four Years (annualized) +8.17% +6.21% +5.28% N/A
Five Years (annualized) +10.57% +7.47% +6.15% +5.51%
Six Years (annualized) +15.31% +6.16% +5.13%  
Seven Years (annualized) +12.26% +4.59% +3.42%  
Eight Years (annualized) +11.36% +3.97%    
Nine Years (annualized) +10.58% +3.83%    
Ten Years (annualized) +10.51% +4.10%    
Eleven Years (annualized) +11.37% +4.11%    
Twelve Years (annualized) +11.01% +4.43%    
Thirteen Years (annualized) +11.34% +4.33%    
MAPF returns assume reinvestment of distributions, and are shown after expenses but before fees.
CPD Returns are for the NAV and are after all fees and expenses.
* CPD does not directly report its two- or four-year returns.
Figures for National Bank Preferred Equity Income Fund (formerly Omega Preferred Equity) (which are after all fees and expenses) for 1-, 3- and 12-months are +1.12%, +2.38% and +4.59%, respectively, according to Morningstar after all fees & expenses. Three year performance is +3.61%; five year is +6.70%
Figures for Jov Leon Frazer Preferred Equity Fund Class I Units (which are after all fees and expenses) for 1-, 3- and 12-months are +1.08%, +1.68% and +0.75% respectively, according to Morningstar. Three Year performance is +1.30%; five-year is +3.80%
Figures for Manulife Preferred Income Fund (formerly AIC Preferred Income Fund) (which are after all fees and expenses) for 1-, 3- and 12-months are +1.16%, +3.30% & +0.07%, respectively. Three Year performance is +1.42%; five-year is +3.75%
Figures for Horizons AlphaPro Preferred Share ETF (which are after all fees and expenses) for 1-, 3- and 12-months are +1.25%, +2.52% & 4.44%, respectively. Three year performance is 4.18%
Figures for National Bank Preferred Equity Fund (formerly Altamira Preferred Equity Fund) are +1.31%, +2.40% and -1.75% for one-, three- and twelve months, respectively.
The figure for BMO S&P/TSX Laddered Preferred Share Index ETF is +1.59%, +2.35% and +1.54% for one-, three- and twelve-months, respectively.
Figures for NexGen Canadian Preferred Share Tax Managed Fund are not available since our wise regulators are protecting you from inappropriate knowledge.
Figures for BMO Preferred Share Fund are similarly off-limits.

MAPF returns assume reinvestment of dividends, and are shown after expenses but before fees. Past performance is not a guarantee of future performance. You can lose money investing in Malachite Aggressive Preferred Fund or any other fund. For more information, see the fund’s main page. The fund is available either directly from Hymas Investment Management or through a brokerage account at Odlum Brown Limited.

A problem that has bedevilled the market over the past two years has been the OSFI decision not to grandfather Straight Perpetuals as Tier 1 bank capital, and their continued foot-dragging regarding a decision on insurer Straight Perpetuals has segmented the market to the point where trading has become much more difficult. The fund occasionally finds an attractive opportunity to trade between GWO issues, which have a good range of annual coupons (but in which trading is now hampered by the fact that the low-coupon issues are trading near par and are callable at par in the near term), but is “stuck” in the MFC and SLF issues, which have a much narrower range of coupon, while the IAG DeemedRetractibles are quite illiquid. Until the market became so grossly segmented, this was not so much of a problem – but now banks are not available to swap into (because they are so expensive) and non-regulated companies are likewise deprecated (because they are not DeemedRetractibles; they should not participate in the increase in value that will follow the OSFI decision I anticipate and, in addition, are analyzed as perpetuals). The fund’s portfolio is, in effect ‘locked in’ to the MFC & SLF issues due to projected gains from a future OSFI decision, to the detriment of trading gains particularly in May, 2013, when the three lowest-coupon SLF DeemedRetractibles (SLF.PR.C, SLF.PR.D and SLF.PR.E) were the worst performing DeemedRetractibles in the sub-index, and in June, 2013, when the insurance-issued DeemedRetractibles behaved like PerpetualDiscounts in a sharply negative market.

This year, however, the sharp decline in the indices from early-mid-May to early-mid-June did cause sufficient changes in valuation such that some low coupon DeemedRetractibles were swapped into some low-reset FixedResets from the same issuer.

At this point, the composition of the BMO-CM “50” index should be discussed; it will be noted that it has greatly outperformed TXPR over the past year, and MAPF holders will have noticed that the fund has only just returned to a positive differential against BMO-CM “50” on a year-over-year basis. While I have not done a thorough analysis of the difference, I’ve done some approximations – note that the numbers in this section are approximations, but are close enough for government work.

I believe that BMO-CM “50” has benefitted greatly over the past year by being over-weight in bank Straight Perpetuals relative to other Straight Perpetuals:

Sampling Error in BMO-CM “50”
Class of
Straight
Perpetual
BMO-CM “50”
Weight
May 2013
Proportion of BMO-CM “50” Straights Shares
Outstanding
May 2014
Proportion
Shares
Outstanding
Performance
May 2013
to
May 2014
Bank DeemedRetractible 17.7% 59.8% 240.5-million 34.9% +4.81%
Insurance DeemedRetractible 6.5% 22.0% 183.5-million 26.6% -0.86%
Bank Straight 1.8% 6.1% 47.2-million 6.8% +4.88%
Straight 3.6% 12.2% 218.6-million 31.7% +0.51%

Thus we see that at the beginning of the downdraft, the BMO-CM “50” was highly overweighted in Bank DeemedRetractibles, which performed quite well over the year, and highly underweighted in Straight Perpetuals, which have underperformed. Weightings in the other two sectors were about right.

It’s no wonder the fund struggled to outperform the BMO-CM “50” index, and no wonder BMO-CM “50” has outperformed TXPR! One consolation, however, is that many Bank DeemedRetractibles now have a negative Yield-to-Worst; this is a reasonably good single-measure predictor of future performance. So perhaps we’ll see a reversal of these effects over the next few years!

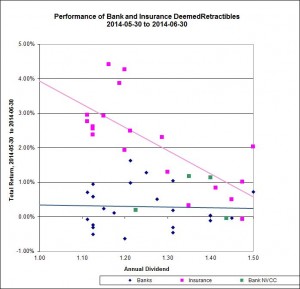
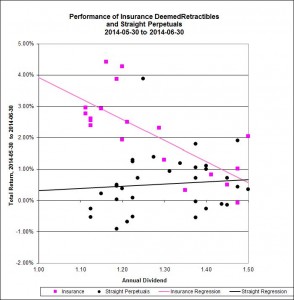
In June, insurance DeemedRetractibles greatly outperformed bank DeemedRetractibles:
DRRelPerf_1406Click for Big

… and also strongly outperformed Straight Perpetuals:
straightRelPerf_1406
Click for Big

Of the regressions shown in the above two charts, the Adjusted Correlation of the Insurance DeemedRetractible performance is of good quality, at 0.51, but the other two correlations are poor.

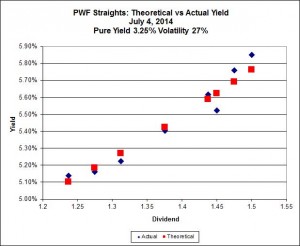
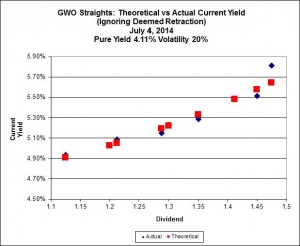
A lingering effect of the downdraft of 2013 has been the return of measurable Implied Volatility (all Implied Volatility calculations use bids from May 30):
ImpVol_GWO_140704
Click for Big

ImpVol_PWF_140704
Click for Big

ImpVol_BNS_140704
Click for Big

Implied Volatility of
Three Series of Straight Perpetuals
May 30, 2014
Issuer Pure Yield Implied Volatility
GWO 4.11% (-0.42) 20% (+2)
PWF 3.25% (-0.01) 27% (-1)
BNS 0.01% (0) 33% (+1)
Bracketted figures are changes since May month-end

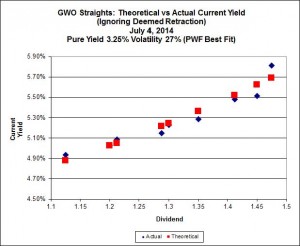
It is disconcerting to see the difference between GWO and PWF; if anything, we would expect the implied volatility for GWO to be higher, given that the DeemedRetraction – not yet given significant credence by the market – implies a directionality in prices. The GWO data with the best fit derived for PWF is, however, not readily distinguishable from the best fit although the best fit has a noticeably lower Sum of Squared Errors (0.97 vs 1.19):
ImpVol_GWO_PWFBestFit_140704
Click for Big

The seeming discrepancy might be sampling error.

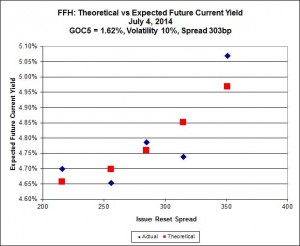
In the September, 2013, edition of PrefLetter, I extended the theory of Implied Volatility to FixedResets – relating the option feature of the Issue Reset Spreads to a theoretical non-callable Market Spread.

ImpVol_BPO_140704
Click for Big

ImpVol_FFH_140704
Click for Big

Implied Volatility of
Two Series of FixedResets
May 30, 2014
Issuer Market Reset Spread
(Non-Callable)
Implied Volatility
BPO 77bp (-5) 40% (0)
FFH 303bp (+25) 10% (-5)
Bracketted figures are changes since May month-end

These are very interesting results: The BPO issues are trading as if calls are a certainty, while FFH issues are trading as if calls are much less likely. The FFH series continues to be perplexing, this time with the four lower-coupon issues showing virtually no implied volatility – with the highest coupon issue (FFH.PR.K) being well off the mark … all I can think of is that the market has decided that FFH.PR.K, with an Issue Reset Spread of 351bp, is sure to be called in 2017, while the other four (highest spread is FFH.PR.C, +315) are not at all likely to be called.

Those of you who have been paying attention will remember that in a “normal” market (which we have not seen in well over a year) the slope of this line is related to the implied volatility of yields in Black-Scholes theory, as discussed in the January, 2010, edition of PrefLetter. As has been previously noted, very high levels of Implied Volatility (in the 40% range, at which point the calculation may be considered virtually meaningless) imply a very strong expectation of directionality in future prices – i.e, an expectation that all issues will be redeemed at par.

It is significant that the preferred share market knows no moderation. I suggest that a good baseline estimate for Volatility over a three year period is 15% but the observed figure is generally higher in a rising market and lower in a declining one … with, of course, a period of adjustment in between, which I suspect we are currently experiencing.

Sometimes everything works … sometimes it’s 50-50 … sometimes nothing works. The fund seeks to earn incremental return by selling liquidity (that is, taking the other side of trades that other market participants are strongly motivated to execute), which can also be referred to as ‘trading noise’ – although for quite some time, noise trading has taken a distant second place to the sectoral play on insurance DeemedRetractibles; something that dismays me, particularly given that the market does not yet agree with me regarding the insurance issues! There were a lot of strongly motivated market participants during the Panic of 2007, generating a lot of noise! Unfortunately, the conditions of the Panic may never be repeated in my lifetime … but the fund will simply attempt to make trades when swaps seem profitable, without worrying about the level of monthly turnover.

There’s plenty of room for new money left in the fund. I have shown in PrefLetter that market pricing for FixedResets is very often irrational and I have lots of confidence – backed up by my bond portfolio management experience in the markets for Canadas and Treasuries, and equity trading on the NYSE & TSX – that there is enough demand for liquidity in any market to make the effort of providing it worthwhile (although the definition of “worthwhile” in terms of basis points of outperformance changes considerably from market to market!) I will continue to exert utmost efforts to outperform but it should be borne in mind that there will almost inevitably be periods of underperformance in the future.

The yields available on high quality preferred shares remain elevated, which is reflected in the current estimate of sustainable income.

Calculation of MAPF Sustainable Income Per Unit
Month NAVPU Portfolio
Average
YTW
Leverage
Divisor
Securities
Average
YTW
Capital
Gains
Multiplier
Sustainable
Income
per
current
Unit
June, 2007 9.3114 5.16% 1.03 5.01% 1.3240 0.3524
September 9.1489 5.35% 0.98 5.46% 1.3240 0.3773
December, 2007 9.0070 5.53% 0.942 5.87% 1.3240 0.3993
March, 2008 8.8512 6.17% 1.047 5.89% 1.3240 0.3938
June 8.3419 6.034% 0.952 6.338% 1.3240 $0.3993
September 8.1886 7.108% 0.969 7.335% 1.3240 $0.4537
December, 2008 8.0464 9.24% 1.008 9.166% 1.3240 $0.5571
March 2009 $8.8317 8.60% 0.995 8.802% 1.3240 $0.5872
June 10.9846 7.05% 0.999 7.057% 1.3240 $0.5855
September 12.3462 6.03% 0.998 6.042% 1.3240 $0.5634
December 2009 10.5662 5.74% 0.981 5.851% 1.1141 $0.5549
March 2010 10.2497 6.03% 0.992 6.079% 1.1141 $0.5593
June 10.5770 5.96% 0.996 5.984% 1.1141 $0.5681
September 11.3901 5.43% 0.980 5.540% 1.1141 $0.5664
December 2010 10.7659 5.37% 0.993 5.408% 1.0298 $0.5654
March, 2011 11.0560 6.00% 0.994 5.964% 1.0298 $0.6403
June 11.1194 5.87% 1.018 5.976% 1.0298 $0.6453
September 10.2709 6.10%
Note
1.001 6.106% 1.0298 $0.6090
December, 2011 10.0793 5.63%
Note
1.031 5.805% 1.0000 $0.5851
March, 2012 10.3944 5.13%
Note
0.996 5.109% 1.0000 $0.5310
June 10.2151 5.32%
Note
1.012 5.384% 1.0000 $0.5500
September 10.6703 4.61%
Note
0.997 4.624% 1.0000 $0.4934
December, 2012 10.8307 4.24% 0.989 4.287% 1.0000 $0.4643
March, 2013 10.9033 3.87% 0.996 3.886% 1.0000 $0.4237
June 10.3261 4.81% 0.998 4.80% 1.0000 $0.4957
September 10.0296 5.62% 0.996 5.643% 1.0000 $0.5660
December, 2013 9.8717 6.02% 1.008 5.972% 1.0000 $0.5895
March, 2014 10.2233 5.55% 0.998 5.561% 1.0000 $0.5685
June, 2014 10.5877 5.09% 0.998 5.100% 1.0000 $0.5395
NAVPU is shown after quarterly distributions of dividend income and annual distribution of capital gains.
Portfolio YTW includes cash (or margin borrowing), with an assumed interest rate of 0.00%
The Leverage Divisor indicates the level of cash in the account: if the portfolio is 1% in cash, the Leverage Divisor will be 0.99
Securities YTW divides “Portfolio YTW” by the “Leverage Divisor” to show the average YTW on the securities held; this assumes that the cash is invested in (or raised from) all securities held, in proportion to their holdings.
The Capital Gains Multiplier adjusts for the effects of Capital Gains Dividends. On 2009-12-31, there was a capital gains distribution of $1.989262 which is assumed for this purpose to have been reinvested at the final price of $10.5662. Thus, a holder of one unit pre-distribution would have held 1.1883 units post-distribution; the CG Multiplier reflects this to make the time-series comparable. Note that Dividend Distributions are not assumed to be reinvested.
Sustainable Income is the resultant estimate of the fund’s dividend income per current unit, before fees and expenses. Note that a “current unit” includes reinvestment of prior capital gains; a unitholder would have had the calculated sustainable income with only, say, 0.9 units in the past which, with reinvestment of capital gains, would become 1.0 current units.
DeemedRetractibles are comprised of all Straight Perpetuals (both PerpetualDiscount and PerpetualPremium) issued by BMO, BNS, CM, ELF, GWO, HSB, IAG, MFC, NA, RY, SLF and TD, which are not exchangable into common at the option of the company (definition refined in May, 2011). These issues are analyzed as if their prospectuses included a requirement to redeem at par on or prior to 2022-1-31 (banks) or 2025-1-31 (insurers and insurance holding companies), in addition to the call schedule explicitly defined. See OSFI Does Not Grandfather Extant Tier 1 Capital, CM.PR.D, CM.PR.E, CM.PR.G: Seeking NVCC Status and the January, February, March and June, 2011, editions of PrefLetter for the rationale behind this analysis.
Yields for September, 2011, to January, 2012, were calculated by imposing a cap of 10% on the yields of YLO issues held, in order to avoid their extremely high calculated yields distorting the calculation and to reflect the uncertainty in the marketplace that these yields will be realized. From February to September 2012, yields on these issues have been set to zero. All YLO issues held were sold in October 2012.

Significant positions were held in DeemedRetractible, SplitShare and FixedReset issues on June 30; all of these currently have their yields calculated with the presumption that they will be called by the issuers at par prior to 2022-1-31 (banks) or 2025-1-31 (insurers and insurance holding companies) or on a different date (SplitShares). This presents another complication in the calculation of sustainable yield. The fund also holds positions in various SplitShare issues which also have their yields calculated with the expectation of a maturity at par.

I no longer show calculations that assume the conversion of the entire portfolio into PerpetualDiscounts, as the fund has only a small position in these issues.

I will also note that the sustainable yield calculated above is not directly comparable with any yield calculation currently reported by any other preferred share fund as far as I am aware. The Sustainable Yield depends on:
i) Calculating Yield-to-Worst for each instrument and using this yield for reporting purposes;
ii) Using the contemporary value of Five-Year Canadas (set at 1.54% for the June 30 calculation) to estimate dividends after reset for FixedResets.

Most funds report Current Yield. For instance, ZPR reports a “Dividend Yield” of 4.7% as of May 30, 2014, but this is the Current Yield, a meaningless number. The Current Yield of MAPF is 4.94% as of May 30, but I will neither report that with any degree of prominence nor take any great pleasure in the fact that it’s a little higher than the ZPR number. It’s meaningless; to discuss it in the context of portfolio reporting is misleading.

However, BMO has taken a significant step forward in that they are no longer reporting the “Portfolio Yield” directly on their website; the information is taken from the “Enhanced Fund Profile” which is available only as a PDF link. CPD doesn’t report this metric on the CPD fact sheet or on their website. I may have one less thing to mock the fundcos about!

It should be noted that the concept of this Sustainable Income calculation was developed when the fund’s holdings were overwhelmingly PerpetualDiscounts – see, for instance, the bottom of the market in November 2008. It is easy to understand that for a PerpetualDiscount, the technique of multiplying yield by price will indeed result in the coupon – a PerpetualDiscount paying $1 annually will show a Sustainable Income of $1, regardless of whether the price is $24 or $17.

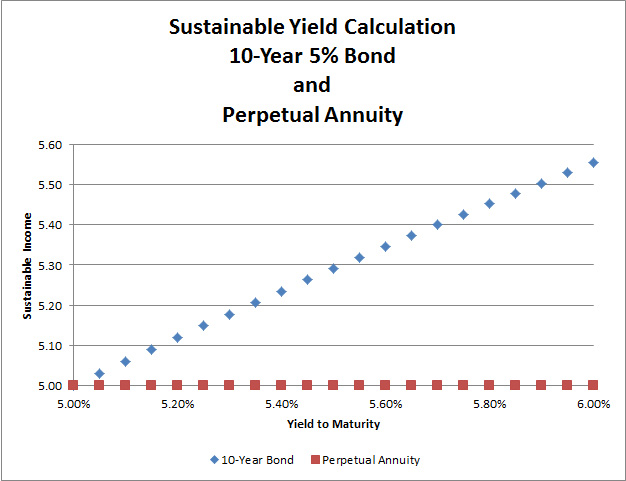
Things are not quite so neat when maturity dates and maturity prices that are different from the current price are thrown into the mix. If we take a notional Straight Perpetual paying $5 annually, the price is $100 when the yield is 5% (all this ignores option effects). As the yield increases to 6%, the price declines to 83.33; and 83.33 x 6% is the same $5. Good enough.

But a ten year bond, priced at 100 when the yield is equal to its coupon of 5%, will decline in price to 92.56; and 92.56 x 6% is 5.55; thus, the calculated Sustainable Income has increased as the price has declined as shown in the graph:

Click for Big

The difference is because the bond’s yield calculation includes the amortization of the discount; therefore, so does the Sustainable Income estimate.

Different assumptions lead to different results from the calculation, but the overall positive trend is apparent. I’m very pleased with the long-term results! It will be noted that if there was no trading in the portfolio, one would expect the sustainable yield to be constant (before fees and expenses). The success of the fund’s trading is showing up in

  • the very good performance against the index
  • the long term increases in sustainable income per unit

As has been noted, the fund has maintained a credit quality equal to or better than the index; outperformance has generally been due to exploitation of trading anomalies.

Again, there are no predictions for the future! The fund will continue to trade between issues in an attempt to exploit market gaps in liquidity, in an effort to outperform the index and keep the sustainable income per unit – however calculated! – growing.